
1. Introduction
Deciphering the environment and timing of clay formation in the geosphere is a critical task for modeling the evolution of major geological systems at the surface or near-surface of the continents, such as weathering covers, sedimentary basins or hydrothermal systems (Meunier, 2005). Geochronology of clay minerals has therefore motivated an increasing number of studies, overriding the natural complexity of these finely divided minerals (e.g., Balan et al., 2005; Clauer et al., 2012; Toulkeridis et al., 1998). In addition to Rb/Sr or Sm/Nd dating that have been scarcely used in the literature (Brookins, 1990; Bros et al., 1992; Tillberg et al., 2020), the most frequently used isotopic geochronometer hosted by clay minerals is the 40K/40Ar couple in illite. The 40K/40Ar and 40Ar/39Ar methods were reviewed and discussed by Clauer et al. (2012) and Clauer (2013). They have important applications which include the dating of fault gouges (Abd Elmola et al., 2018; Bense et al., 2014; Kemp et al., 2019; Lyons & Snellenburg, 1971; van der Pluijm et al., 2001), of diagenetic transformations in detrital sediments (Hamilton, 1999; J. Hoffman & Hower, 1979; Meunier, 2005; Mossmann, 1991; and reference therein) and of fluid transfers in the crust (Hamilton, 1989; Mark et al., 2010; Pevear, 1999). This approach is however restricted to potassium-bearing clay minerals which challenges its application in environments belonging to the realm of kaolinite, such as sedimentary kaolins or tropical weathering covers. The wide representation of these environments at the Earth’s surface (Dill, 2016; Nahon, 2003) motivates the development of alternative dating methods.
Dating kaolinite by Electron Paramagnetic Resonance Spectroscopy (EPR) has been developed since the end of the 20th century, expanding the field of clay dating to tropical soils and sediments (Allard et al., 2018, 2020; Ansart et al., 2025; Balan et al., 2005; Mathian et al., 2019, 2020, 2022). The principle of the approach is similar to those that have long been used to date speleothems or fossilized remains of animals constituted of carbonate- or phosphate-group minerals (Ikeya, 1993). It is based on the accumulation with time of paramagnetic point defects in the mineral structure (e.g., Allard et al., 2012). These radiation-induced defects (RIDs) are produced by ionizing radiations and typically consist of electronic holes trapped on oxygen atoms. Thus, their electronic structure becomes He s2 2p5 and the paramagnetic property derives from one unpaired electron remaining in the 2p orbital. They have been observed in various clay minerals, such as kaolinite (Angel et al., 1974; Clozel et al., 1994; Jones et al., 1974), dickite (Allard et al., 2003), halloysite (Chaikum & Carr, 1987), illite (Morichon et al., 2008), sudoite (Morichon et al., 2010) and in a few specimens of montmorillonite (Fukuchi, 1996; Sorieul et al., 2005); a diversity which potentially extends the application field of the method. Various types of paramagnetic RIDs can be distinguished through their EPR spectrum and their thermal stability. For example, kaolinite hosts at least three types of defects, among which the so-called A-centers are stable at the scale of geological periods, as assessed from isochronal heating experiments whose results are extrapolated to ambient temperature (Ataytür et al., 2024; Clozel et al., 1994; Riegler, Allard, et al., 2016). Indeed, the half-life of A-centers in kaolinite is so high (> 1012 yrs extrapolated at room temperature from second order annealing kinetics) that no annealing is expected in most geosystems, except through significant thermal episodes that have to be specified. Major uncertainties in the EPR dating of minerals relate to the determination of the radiation dose received by the mineral. In the case of carbonates or phosphates materials, the radioactive elements are incorporated in the mineral structure. This internal irradiation facilitates the determination of the total dose experienced by the minerals (Ikeya, 1993). By contrast, kaolinite group minerals or sudoites are not expected to incorporate radioactive elements in their structure and their dating relies on irradiation by external sources. Accordingly, the dose rate depends on many parameters, including the spatial distribution of the radioelements, the water content and micro-structure of the sample, the accumulation or loss of radon (Allard et al., 2018, 2020; Ansart et al., 2025; Balan et al., 2005; Mathian et al., 2019, 2020, 2022). Note that both internal (inside the clay structure) and external (outside the crystallites) irradiation must be considered in the case of illite, which contains 40K. However, when radioelements are scattered homogeneously in the clay matrix that can be considered as an infinite medium, the dose rates in the collected sample and in its surrounding are equal. Owing to the finely divided nature of clay minerals, all α, β, γ radiations are absorbed in the clay material. In addition, an inherent difficulty arises when the clay sample contains intimately mixed generations of clay minerals formed at different periods, as seen e.g., for sedimentary illites (Środoń et al., 2002), iron oxides or manganese oxides at microscopic scale (see e.g., Heller et al., 2022; Shuster et al., 2005). All these factors may contribute to significant uncertainties in the EPR ages. After pioneering attempts of dating clay minerals by EPR (Ambrosi & Chen, 1990; Fukuchi, 1996; Limsuwan et al., 2011; Nambi & Sankaran, 1985), the methodology was progressively improved in dating exercises of tropical weathering covers or sediments containing kaolinite as a major component (Allard et al., 2018, 2020; Ansart et al., 2025; Balan et al., 2005; Mathian et al., 2019, 2020, 2022). The studies of Cenozoic or Quaternary formations showed that the multiple steps involved in the EPR dating protocol typically yield an average 20–30% error on the age (Mathian et al., 2019, 2020, 2022). An intercomparison with other dating methods on an extended period of time is also lacking, mostly because independently and accurately dated clay mineral samples that could be also analyzed by EPR are scarce. In particular, lateritic weathering profiles appear as choice targets for the EPR dating method because they contain kaolinite as a major secondary mineral, are notoriously difficult to date despite they can potentially bring important information on paleoclimates, either at global or regional scales. Owing to the relevance of weathering covers, there is a particular need for detailed benchmarking of the EPR dating of clays within the Cenozoic period. Here, we report the EPR ages of selected clay mineral samples (illite and kaolinite) from distinct geological contexts with ages distributed from Neoproterozoic to Quaternary. The ages of formation or deposition of the clays could be determined independently, either through 40Ar/39Ar dating, stratigraphic correlation, or U-Th/He dating of lateritic duricrust embedding the clay minerals. Benchmarking ages provide encouraging results on the EPR dating protocol, which could extend its application field beyond the Phanerozoïc eon.
2. Characteristics of samples and geological setting
2.1. Illite 43031 from the Thelon Basin (Canada)
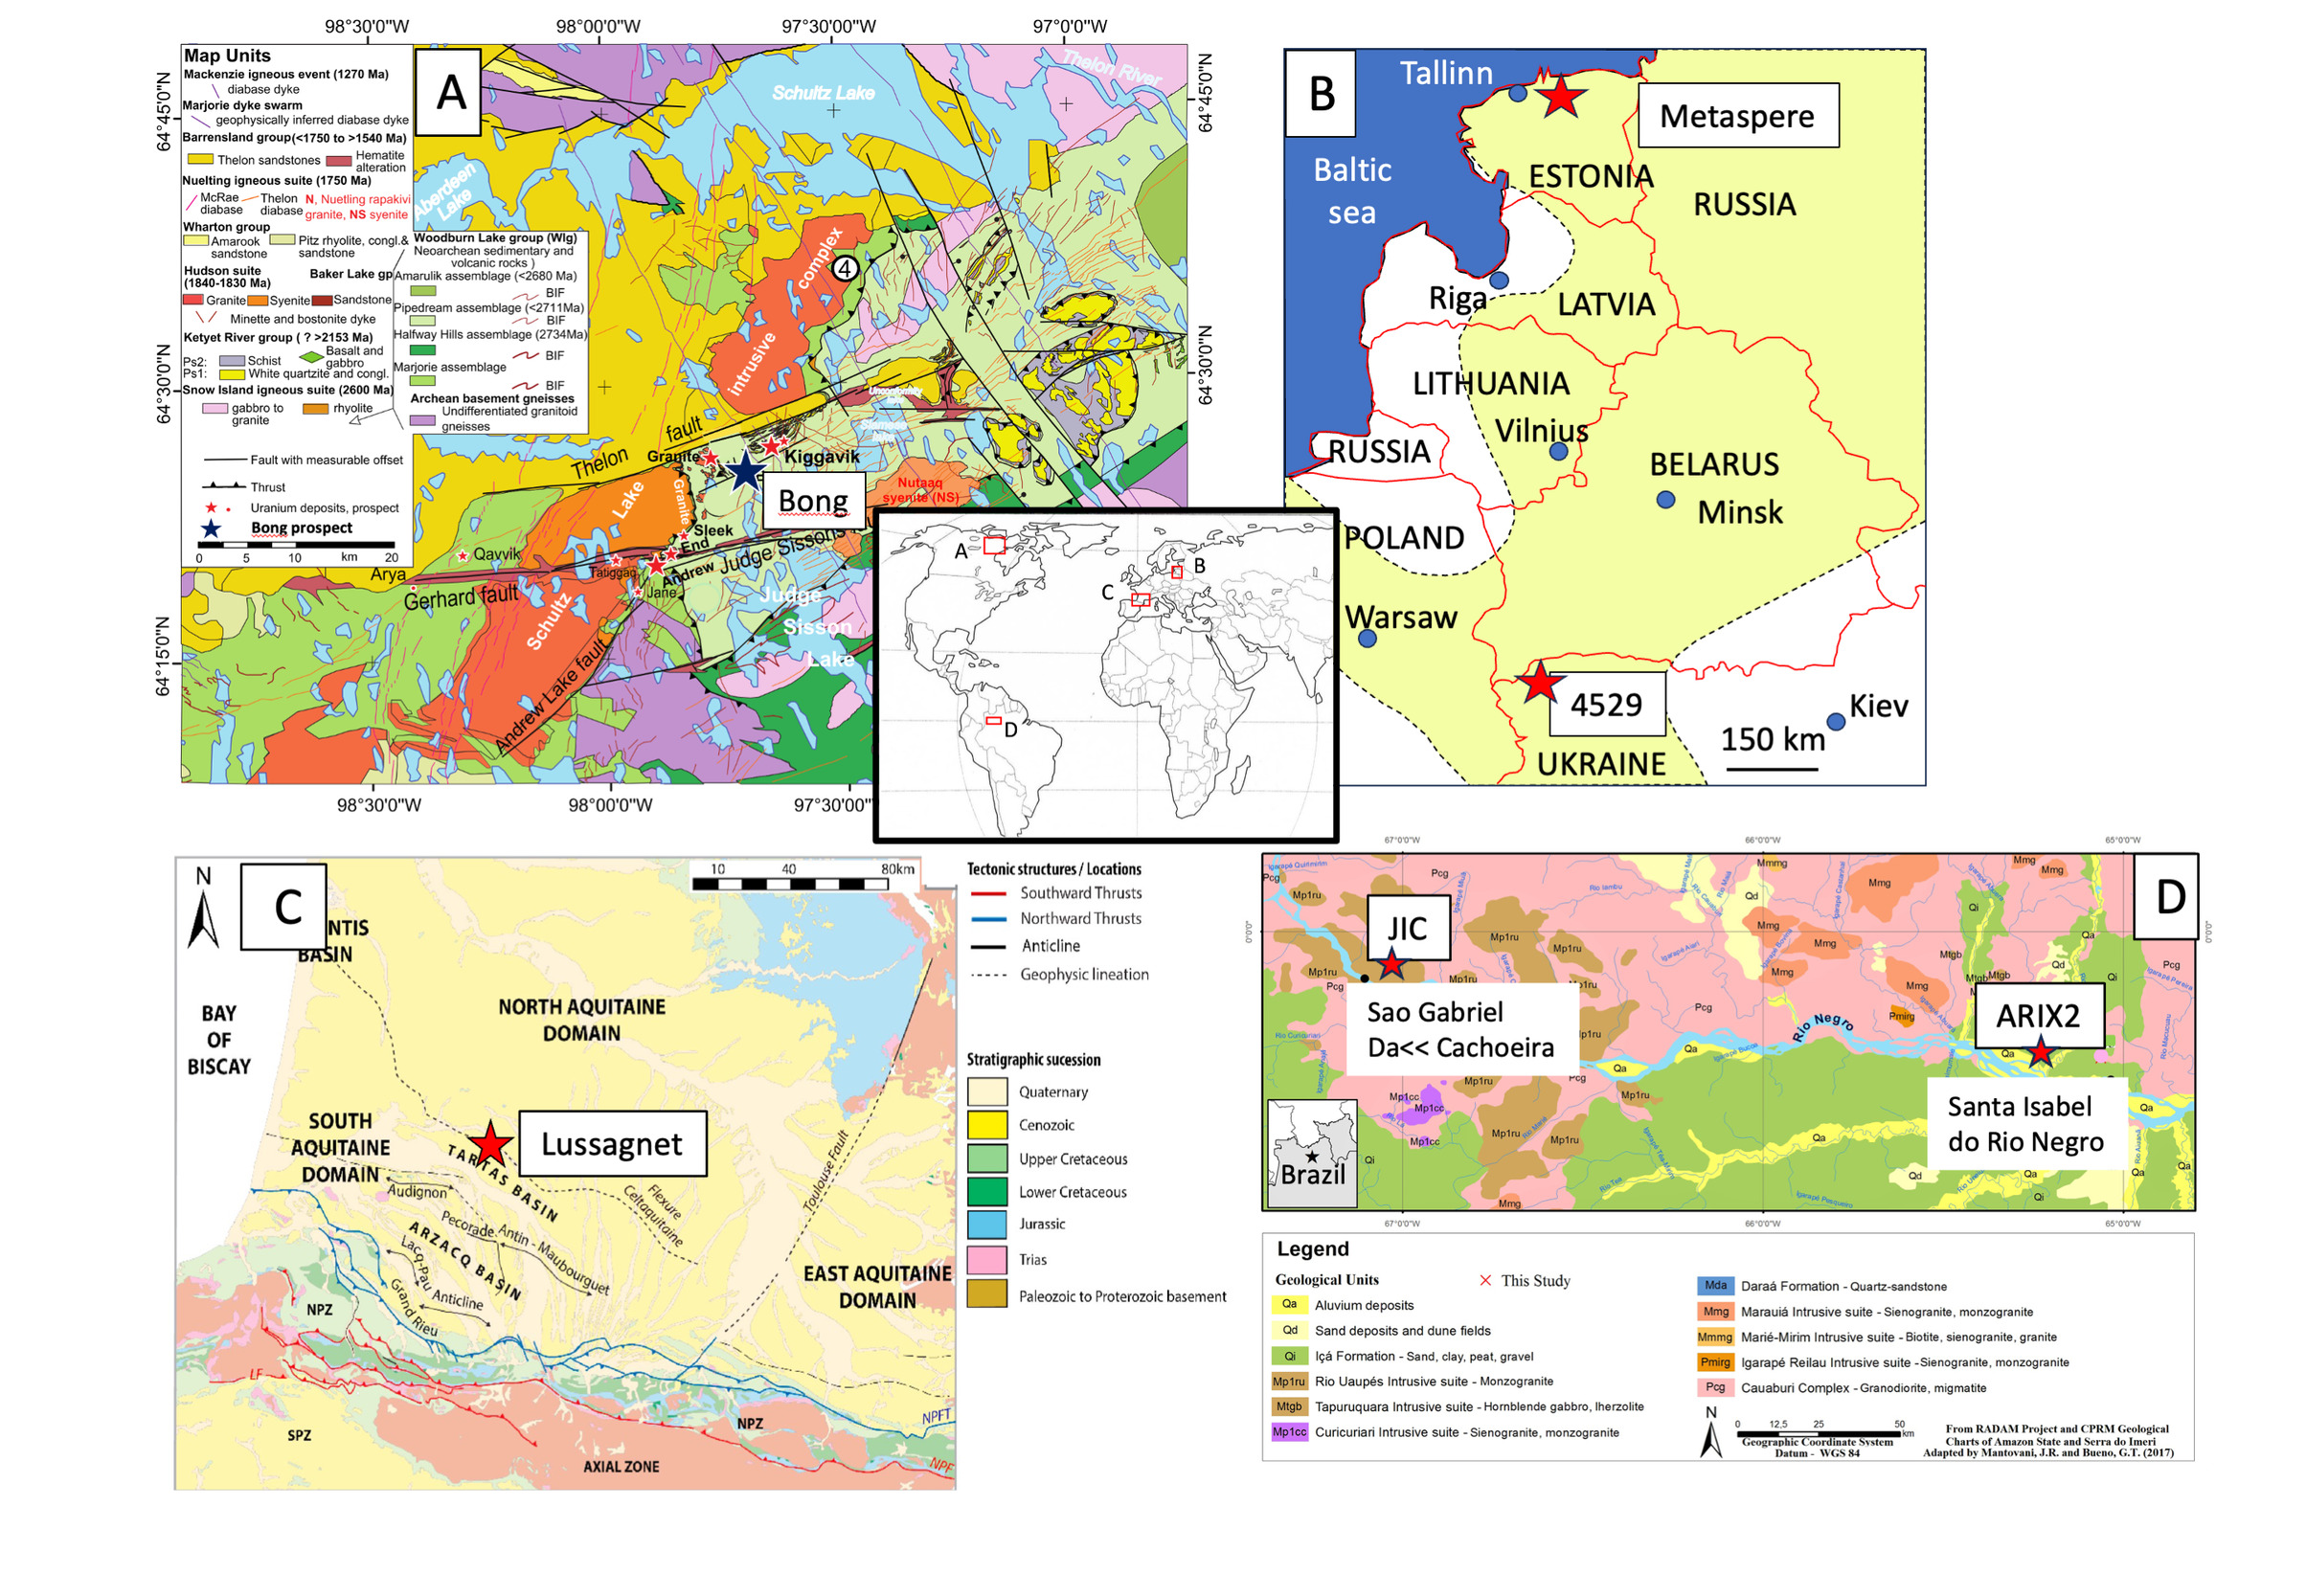
The studied site belongs to the Bong ore lense, one of the many ore-body recognized on the Kiggavik-Andrew lake uranium mineralization trend lying on the edge of the Proterozoic Thelon Basin in Nunavut, Canada (Riegler et al., 2014; Sharpe et al., 2015). The corresponding alteration zones are associated with significant uranium mineralization hosted in the Archean Woodburn lake Group volcano-sedimentary sequence (fig. 1A). The district is located approximatively at 80 km to the West of the Inuit hamlet of Baker Lake, Nunavut. The age of alteration related to the ore formations is within 1.2–1.4 Ga according to illite 40K/40Ar and 39Ar/40Ar geochronological data (Fuchs et al., 1986; Miller et al., 1989; Riegler, 2013). In situ secondary ion mass spectrometry (SIMS) U/Pb geochronology on petrographically constrained uraninite generation from Bong identified two main mineralization ages, of ca. 1500 Ma, and circa 1100 Ma with a subsequent remobilization associated to redox fronts around 1000 Ma (Sharpe et al., 2015). The studied sample, namely sample 43031 (Riegler, Allard, et al., 2016), was collected from a same decametric massive and homogeneous illitization level in a drill core at 358.7 m depth in the Bong area (Kiggavik). It is an illite-rich sample that dominantly corresponds to a 1Mt polytype (XFe <0.1/010(0H)2) and is representative of those described in the Kiggavik area (Riegler et al., 2014). A photograph of the sampled core can be found in fig. 2 of the article by Riegler et al. (2014). In order to purify the 43031 illite, the rock sample was gently crushed and dispersed in water by ultrasonic waves for 2 minutes. The fraction < 4 µm was separated by sedimentation and selected, as reminded in table 1 (Riegler et al., 2014).
The thermal history of the sample may be critical for the accumulation of RIDs in clay minerals. The thermal stability of illite was studied by Riegler, Allard et al. (2016) on the same 43031 sample. The half-lives extrapolated at room temperature were 1.9–29 x109 yrs using constraints for the frequency factor s0, according to Marfunin (1979). However, as for our recent study on kaolinite (Ataytür et al., 2024) we herein present a new result using the experimental data of Riegler, Allard, et al. (2016) and considering no constraint on s0 because it is a free parameter of the fit. The corresponding half-life extrapolated at room temperature is then 9 x10⁹ yrs. For example, the half-life of RIDs extrapolated at 200 °C would be around one century, and at 100 °C it would be 230 ka, which is negligible when compared to the one at room temperature. In the Thelon Basin, illite formed during early discrete diagenetic episodes including one at 1.27 Ga (200 °C–300 °C) at ca 5 km depth. Then temperature decreased down to 100 °C over an episode that lasted circa 400 Ma (Grare et al., 2021; Hiatt et al., 2010). At the depth of the specimen sampling, the temperature is currently around room temperature according to the model by Perry et al. (2010). Thus, the illite sample only experienced early thermal episodes during which RIDs could not accumulate. However, the temperature evolution in the Thelon Basin is not accurately known, so that the period of the Ai center thermal annealing can only be estimated.
_bong_drilling_site__thelon_basin__kiggavik_area__canada_.png)

2.2. Kaolinites from Proterozoic paleosols of the East European craton (Estonia, Ukraine)
In the East European Craton (fig. 1B), numerous kaolinitic paleosols developed on the Paleoproterozoic crystalline basement or on the Ediacaran flood basalts of Volyn Large Igneous Province are preserved under Proterozoic sediments. They were only affected by low-temperature (circa 100–120 oC) Paleozoic diagenesis (Liivamägi et al., 2018, 2021). Two kaolinite-rich paleosol samples Meta-1 and 4529-4 were selected for this study. Full-range EPR spectra were measured on several size fractions. These fractions were previously purified by Dithionite Citrate Bicarbonate treatment (DCB; Mehra & Jackson, 1958) to remove the iron oxides interfering on the RID EPR signal, and were separated by centrifugation. Samples exhibiting the highest signals of RID were selected for dating (SI-1) in order to minimize the EPR baseline interference.
The Meta-1 sample originates from the Metaspere borehole in Estonia (fig. 1B), which penetrated a paleosol developed on ca. 1500 Ma old granite, and covered by Kotlin sedimentary rocks (circa 550 Ma; Liivamägi et al., 2021). Note however that the weathering profile could result from several cycles of erosion/weathering and could therefore be significantly younger than the parent rock exhumation. Lateritic weathering of Ediacaran age (635 to 550 Ma) is well documented in the East European Craton (Liivamägi et al., 2018). The size fraction selected for Meta-1 is < 2µm (table 1) for which the RID signal amplitude was higher. The porosity of sample Meta-1 (bulk rock) determined by water saturation (Topór et al., 2016) is 20.5% (3 measurements, with a standard deviation of 0.2%). Mineral composition of the bulk rock established by a quantitative XRD method is 56% quartz, 34% kaolinite, 7% hematite and traces of micas, orthoclase and goethite (Liivamägi et al., 2021). The Meta-1 sample comes from the F261 core in the upper part of a 7m strongly weathered profile (at 345.2 m) overlaid by the same weathered gneiss with a faint gneissic texture still visible (Liivamägi et al., 2021). From this lithologic similarity we consider herein that the sample originates from a homogeneous surrounding.
The 4529-4 sample originates from a paleosol of the Volyn flood basalt province in Ukraine (fig. 1B). The age of this paleosol is estimated as ca. 550 Ma (Liivamägi et al., 2018; Środoń et al., 2023). The sample 4529-4 consists of almost pure kaolinite with traces of kaolinite-smectite mixed-layer mineral, anatase, and a small amount of hematite (Liivamägi et al., 2018). The fraction < 0.2 µm was selected for dating because it contained the most intense spectra of RIDs (table 1).
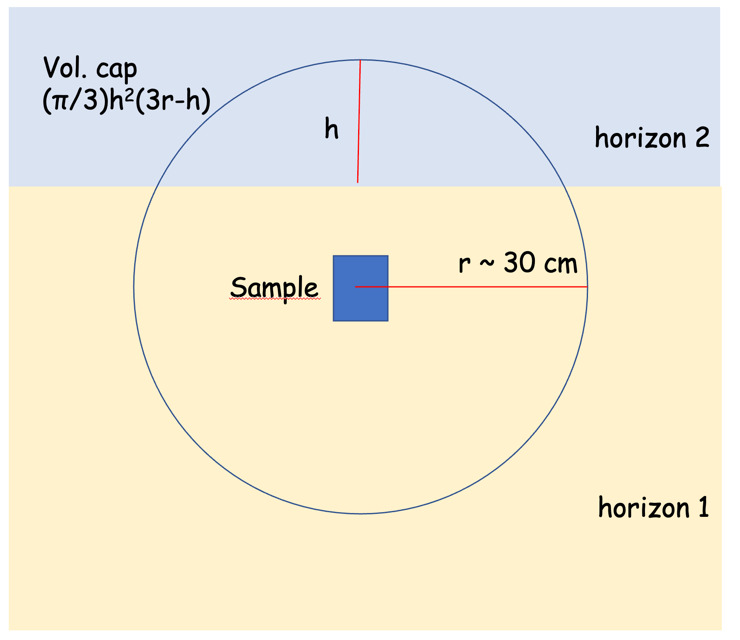
The 4529-4 sample comes from a 4 m thick homogeneous level, but is located approximately 15 cm below the overlying sandstone for which we have no chemical data because it was not sampled. Therefore, only a small part of the sphere of gamma irradiation (16 %) may potentially be different, according to the model in Appendix 1. We thus assume no dominant contribution arising from the distant material.
2.3. Kaolinite from the early Cenozoic sedimentation sequence in Aquitaine basin (France)
The Lussagnet sample is a core from a borehole (LUG60) drilled in the deep aquifer of Lussagnet, a gas storage site located in the Aquitaine basin of south-western France, around 100 km north of the Pyrenees (fig. 1C). The reservoir rocks are composed of poorly consolidated sandstones, called “infra-mollassic sand”, with some interlayered claystones (Cavelier et al., 1997) deposited during the lower Eocene epoch. The thickness of the reservoir is 40m and its structure is an anticline which the highest point of the top is located at a depth of about 550 m below ground level. Reservoir rocks belong to a prograde sedimentary sequence deposited in shallow marine/deltaic environment during the Ypresian stage (48–56 Ma) of the lower Eocene. The mineralogy of the Lussagnet sample which total porosity is 23% consists essentially in quartz and clay minerals with minor content of calcite and traces of iron oxides and iron sulfides.
Most of the clay fraction of the Lussagnet sample is made of kaolinite and there are petrographic evidences for incipient diagenesis subsequently to sediments deposition, with a maximum burial depth of 670 m (Beaufort et al., 1998). Kaolinite occurs as a very fine-grained clay matrix made of platy pseudohexagonal crystals and disseminated coarser authigenic vermicular booklets that supports an early diagenetic origin. Note that authigenesis of minerals (i.e., crystals formed by recrystallization during or after the sedimentation as opposed to detrital minerals) is required to date sedimentary kaolinite because the dose rate experienced by detrital particles of kaolinites prior to deposition cannot be evaluated. In addition, benchmarking with stratigraphic ages assumes that diagenesis occurred soon after deposition.
For the Lussagnet kaolinite, the sandstone was fragmented by freezing, gently crushed, and dispersed in water to collect the fraction < 2µm (table 1) by sedimentation (Beaufort et al., 1998).
2.4. Kaolinites from lateritic duricrusts in central Amazonia (Brazil)
Two samples of kaolinites trapped in Fe duricrusts from central Amazonia that were previously dated with EPR (Allard et al., 2018) were also considered here (fig. 1D). Photographs of the two duricrusts can be seen in the Supplementary Information from Allard et al. (2018). The two duricrust samples were gently ground, deferrated by the DCB treatment, and suspended in water to recover the fraction < 2µm by sedimentation (table 1).
The ARIX2 sample is from a laterite developed on the Neogene sediments of Içá Formation, in the Santa Isabel do Rio Negro region at the Arixana river bank. Its EPR age ranged between 1.7 – 4.0 Ma depending on the assumptions made on the disequilibrium of the U-Th decay chains, whilst the (U-Th)/He age of embedding goethite measured on several aliquots was 1.6 – 2.7 Ma. ARIX2 is an outcropping duricrust for which the underlying horizons could not be collected.
The JIC sample originates from the São Gabriel da Cachoeira region and was collected at 210 cm from a pisolitic duricrust of a lateritic profile near the Jeriqueiro locality. This laterite was developed on the Precambrian crystalline basement (monzogranites of Rio Uaupés intrusive suite) of the Guiana Shield. Its EPR age ranged between 7.2 – 16.7 Ma still considering open or closed systems for the U-Th decay chains. Several aliquots of the duricrust pisoliths, showing heterogeneous concentric structures, yielded (U-Th)/He goethite ages ranging from 0.9 to 12.7 Ma.
In both profiles, and within the uncertainty range, the kaolinites can be older than the embedding iron oxyhydroxides, which is consistent with a scenario in which the duricrust trapped and protected these clay minerals from further weathering. Herein, we refine the EPR ages of the two samples on the basis of new γ-spectrometry data allowing to take into account the degree of disequilibrium of the U chain in the dose rate assessment.
3. Methods
In our methodology, the raw samples of soil or sediment are most often pluri-centimetric and can reach a weight of 8–10 g. Subsequently, a unique purified (after deferration) fraction of clay minerals (generally < 2µm) is extracted to have enough material for irradiation (typically 210 mg to build a dosimetry curve) or other analyses.
3.1. Electron paramagnetic resonance spectroscopy
EPR spectroscopy is a sensitive method that allows the detection of paramagnetic species, i.e., containing unpaired electrons. In the present case, they consist of radiation-induced defects. EPR spectra were recorded at ambient temperature on powder samples at X-band (≈ 9.8 GHz) with a Bruker EMXplusTM spectrometer. The measurement parameters were set as 100 kHz for modulation frequency, 0.5–0.3 mT for modulation amplitude for total and RID spectra, respectively, and 40 mW for microwave power. This power ensures a high amplitude for the A-centers signal, which slightly departs from linearity with the square root of microwave power (SI-2). However, it allows for comparison of data within a dosimetry curve for the same sample, as the measurement is performed on the same defect, in the same structure, and at the same temperature. The spectrum was recorded with one scan in 5 min and 3 min for total (0–600 mT) and RID (335–365 mT) magnetic field ranges, respectively. The EPR spectra were normalized for the sample mass, recording gain and a constant resonant cavity filling-factor. They were defined by their effective spectroscopic factor g values derived from the resonance condition:
hv=g ß H0
where h is the Planck constant; v is the resonance frequency; g is the Landé factor, ß is the Bohr magneton, and Ho is the external magnetic field. Note that for a paramagnetic defect g is a tensor with the eigenvalues: gxx, gyy, gzz. The g values were checked by comparison with a kaolinite from Saint Austell, Great Britain, used as a standard for RIDs (GB1 sample, Allard et al., 1994).
The amount used for EPR measurement is circa 40–50 mg for each purified aliquot and a little bit less than 30 mg for artificially irradiated aliquots due to the size of sample plate holders used for irradiations (one aliquot per dose, see the appendix 1). The concentrations of radiation-induced defects in all aliquots were estimated from a measurement of the maximum amplitude of the EPR spectra in the 330–370 mT range (i.e., at g⊥ component), and expressed in arbitrary units (a.u.) that are proportional to the number of spins per unit of sample mass. RID spectra generally exhibit the contribution of a broad signal responsible for the baseline and due to associated (and sometimes nanometric) Fe oxides in the broad sense (Muller & Calas, 1993) and possibly including clusters in the clay structure. This interference on the RID spectrum is corrected using a simplified procedure illustrated in SI-3 for the JIC sample which has a relatively strong baseline offset in the studied sample series: a straight line is defined between two points on each side of the RID signal, which is close to the expected signal of iron oxides in the region of interest. The offset occurring in the zone between the two maxima of the g⊥ component is then removed from the total amplitude. For some samples the signal of the VO2+ (vanadyl) complex, a classical impurity in kaolinite (Muller & Calas, 1993), interferes with the RID signal (SI-4). A correction of the amplitude of the perpendicular component of the RID signal was performed using a reference kaolin group mineral (Nowa Ruda) containing an intense VO2+ signal and no visible RID contribution (Allard et al., 2020; Premović et al., 2012). The reference VO2+ signal was normalized using an isolated peak and the amplitude of its main central component was subtracted to the perpendicular component of the RID signal.
The uncertainty on the RID EPR concentration is ± 10 % (2 σ). This uncertainty was determined over a population of 20 aliquots prepared from a same sample centered in the cavity but with different weights, height in the tube, angular orientation of the tube. It is thus the dispersion of amplitudes (normalized to weight, height in the tube and gain) around the average value. It includes the stability of the spectrometer that can vary with time. Experimental tests by varying the rotation of the tube in the cavity over 180° for a same sample, all things being equal, allowed the measurement of less than 3% of standard deviation related to the average intensity. The repeatability of a sample in the same tube and over 3 years is within 6.3%, which also integrates angular variation. It compares with the highest values observed in quartz grains by Duval et al. (2024). Repeatability is encompassed by our total error on amplitude measurement (10%, 2σ) which also integrates the error on weight and height in the tube. Different values were also reported for some RIDs in quartz grains measured at 90 K (Duval et al., 2024) or tooth enamel (Duval et al., 2013).
The number of clay crystallites in the cavity, if they are assumed as 1 µm3 volume units (and they can be less) and knowing that the density of kaolinite is 2.63, is counted in several billions for a 50 mg aliquot. When some strong variations occur subsequently to the rotation of the tube, it suggests that the number of crystallites in the cavity is too low to have a real powder spectrum or that some preferred orientation resulted from packing the sample in the tube.
3.2. Paleodose determination: He+ ion-beam artificial irradiations
He+ irradiations are performed to simulate ionizing radiation effects and the resulting dosimetry curves are used to calibrate the concentration of RIDs as a function of dose. Dosimetry curves are built according to a Multiple Aliquot Additive Dose method (MAAD). As in previous kaolinite studies (see e.g., Allard et al., 1994), the samples were deposited on stainless steel plates for irradiation with 1.5 MeV He+ ions in the ARAMIS linear accelerator (IJCLab, Orsay, France), which provides both high doses (usually up to several MGy) and high energy consistent with natural alpha irradiation (average of 5 MeV for U decay chains). The dose rate is relatively high with respect to natural conditions, but the concentration of defects (for He+, electron or gamma radiation) does not vary significantly over 5 orders of magnitudes (Allard et al., 2012). Accordingly, one aim of the calibration exercise presented in this study is to validate the whole protocol of dating, including the laboratory dose rate of ionizing radiation (appendix 1). The standard error on the artificial dose provided by the accelerator ARAMIS is at most 10% (C. Bachelet, personal communication, 2020, December 8th). The thickness of the deposit was 4 µm, which corresponds to the penetration depth of He+ ions in kaolinite, as calculated with the SRIM code (Stopping and Range of Ions in Matter), which calculates the interaction of radiation with matter using a Monte Carlo method (Ziegler et al., 2010). The Proterozoic kaolinite samples from the Eastern European craton were irradiated between 1012 and 7x10¹³ ions/cm2 corresponding to 234–16394 kGy. For the other kaolinite samples, the fluence range currently used for the study of Cenozoic clay minerals was 3x10¹¹–1013 ions/cm2 corresponding to 70–2342 kGy. After irradiation, the unstable defects were annealed at 250 °C for 2h to reveal the stable A-centers (Allard et al., 1994; Ataytür et al., 2024). Indeed, in kaolinite, the RID signal of most natural samples and of irradiated ones (after annealing) is dominantly due to A-centers as they are by far the most stable ones (Allard et al., 1994; Clozel et al., 1994).
For illite, irradiations in the 1012–1014 ions/cm2 fluence range, corresponding to doses within 249–24949 kGy, were used, which is consistent with the expected age of the sample. In this sample the artificial radiation-induced defects with low stability were annealed at 300 °C for 2 hours according to the procedure of Riegler, Allard, et al. (2016) so that the stable RID is due to the Ai-center. Using data of Riegler, Allard, et al. (2016) on illite annealing experiments and no constraint on the frequency factor s0, the half-life of Ai centers extrapolated at 300 °C it is 327 days. Therefore the 2 h heating at 300 °C does not affect the concentration of these RIDs and only anneals unstable defects.
Experimental data arising from He+ irradiations are fitted by two functions: a usual exponential function (e.g., Allard et al., 1994; Grün, 1991) and an exponential function with a linear component (Duval, 2012) according to the following equations:
[C]=[Cs](1−exp(−λ(D+P)))
[C]=[Cs](1−exp(−λ(D+P)))+LF (D+P)
where [C] is the present concentration of RIDs, [Cs] is their modeled saturation value, λ the radiation sensitivity, D the artificial dose, LF is a linear factor and P the paleodose. When the residues were close between the functions (2) and (3) with a better residue from equation (3), a statistical Fisher Snedecor test was applied herein to select the best formalism for the modeled paleodose.
The Fisher Snedecor used is:
Ftest=DFExpLin(Chi2Exp−Chi2ExpLinDFExp−DFExpLin)Chi2ExpLin
With DF: degree of freedom (number of points minus number of parameters) and Chi2: sum of square of differences between experimental amplitude and calculated model (note that residue is not this value of Chi2).
Fitting of dosimetry curves was performed with inhouse Matlab codes of least square minimization of the residue (Dubacq et al., 2012; SI-5) without data weighing. Concerning errors on Paleodose, a Matlab Monte Carlo code was used, which varies randomly the RID amplitude within its 2σ error over 1000 iterations and calculates corresponding dosimetry parameters. The dosimetry parameters are reported in table 2 for Exponential and Exponential + Linear function, with the results of the Fisher Snedecor tests, when required.
3.3. Dose rate evaluation
The whole up-to-date general protocol for EPR dating of clay minerals is reported in Appendix 1. It includes the procedures for paleodose and dose rate determinations. In particular, the dose rate is calculated from the U, Th and K concentrations in the bulk samples and tabulated elementary dose rates (e.g., Aitken, 1985; Guérin et al., 2011) and from various corrections that concern alpha radiation (distribution of U and Th at microscopic scale, role of minerals devoid of U, Th), gamma radiation (macroscopic heterogeneities), all radiations (degree of disequilibrium of radioactive chains, water content). The parameters of the methodology that are related to this study are detailed below.
3.3.1. Bulk chemical analyses
The concentrations of U, Th and K were measured on raw samples ground below 80 µm, including Amazonian duricrusts (Allard et al., 2018), Lussagnet kaolinite-rich sample and 43031 illite. All these samples were then analyzed by ICP-AES and ICP-MS techniques, at the SARM (CRPG, Nancy, France). Analytical details and errors on measurements are described in Carignan et al. (2001) for trace elements and on request at the SARM for major elements. They are reported for each sample in SI-6.
The samples from the East European Craton (META-1 and 4529-4) were analyzed by Laser Ablation ICP-MS (LA-ICP-MS) with the following protocol. The studied samples were ground in an agate mill and analyzed in Perth, Australia at the Bureau Veritas Mineral Laboratories (ACME) using a combo package, which requires a single lithium borate fusion. This allowed the measurement of the analysis of major elements from X-Ray Fluorescence (XRF) and trace elements from LA-ICP-MS on the same fused disc. The protocol included an oxidation using 66:34 flux containing 10% LiNO3 prior to analysis, in order to convert sulfides into sulfates. Ponderal concentrations were measured by reference to the oven dry (105 °C) weight. Loss on Ignition (LOI) was determined from a separate 1g split using a Thermo Gravimetric Analysis (TGA) system with furnaces set to 110 and 1000 °C.
3.3.2. Uranium mapping by induced fission tracks
Thin sections (30 µm thickness) were irradiated by thermal neutrons to produce induced fission-tracks, enabling a U mapping at the microscopic scale (see e.g., Price & Walker, 1963, for the related methodology). The objective is to determine the proportion of U disseminated in the matrix or concentrated in coarse (>> 20 µm) U-bearing minerals. This experiment was performed on the FRMII reactor, Munich, Germany (samples 43031, Lussagnet, ARIX2, JIC), and at IPEN, Sao Paulo, Brazil (sample META-1). A procedure of sample preparation and tracks revealing common to all these samples irradiated in the two neutron reactors was applied, as follows. According to the procedure by Sélo (1983), a Kapton film was placed on the thin section before irradiation. A cumulative flux of 6.9 x 10¹⁵ neutrons/cm2 was used during the irradiation. The fission tracks formed in the Kapton foils were revealed through the reaction with a hypochlorite solution (14% NaClO and 12% NaCl) at 100 °C for 8 min. Then, the tracks were counted using an optical microscope with a x 1000 or x 500 magnification. For the experiments on the FRMII reactor, homogeneity of the neutron flux was verified using a glass standard containing 50 ppm of uranium provided by the National Institute of Standards and Technology. For the IPEN reactor, homogeneity was insured at the scale of the thin section by the previously-characterized experimental setting. When the density of tracks exceeds 105 per mm2 (i.e., when they are accumulated in a small area related to a U-bearing mineral grain), the counting is limited by the overlap of the tracks (M. Selo personal communication). Due to this information loss, the dose rate could be underestimated (and the EPR age overestimated) when a significant proportion of U is hosted in U-rich minerals.
3.3.3. Thorium mapping by X-ray micro-fluorescence
The Th mapping at a microscopic scale was performed by scanning synchrotron X-ray fluorescence imaging at the NANOSCOPIUM beamline, SOLEIL, Saint-Aubin, France (Somogyi et al., 2015). A 5x5 mm thin section (30 µm thickness) of epoxy resin-embedded raw sample on a suprasil grade plate of glass was analyzed for the Thelon illite, Meta-1 and Lussagnet kaolinites.
The experiments have been performed at 20 keV excitation energy above both the L3 edge of Th and the K edge of Zr. After scanning areas of few hundred microns with moderate spatial resolution (~1 µm), scans performed with a 150 nm spatial resolution provided 50 x 50 µm fluorescence maps. These maps were recorded in few hours to obtain a good Th-Lα XRF signal/noise. This measurement strategy permitted to detect trace amounts of Th, knowing that its concentration in the bulk samples measured by ICP-MS was in the 2-25 ppm range (table 1).
3.3.4. Gamma-ray spectrometry
Lasting disequilibrium of radioactive decay chains can significantly affect the dose rate (Olley et al., 1996). Accordingly, γ-ray spectrometry was used to measure the activities of some isotopes from the U and Th decay chains and subsequently to estimate the possible Rn loss or gain (Yokoyama & Nguyen, 1980). The analysis was performed at the Institut de Paléontologie Humaine (MNHN, Paris, France) by high resolution low background γ-ray spectrometry using a germanium detector at low temperature. 238U content is measured using the rays of 234Th (238U daughter) at 63.3 and 92.3 + 92.8 keV. The 232Th is measured by the peaks of 228Ra (228Ac at 911.1 keV) and of 228Th (208Tl at 583.2 keV representing 35% of disintegration of 212Bi). In order to estimate the possible Rn loss or excess and the resulting correction of the dose rate, the 226Ra concentration is measured using the peak at 186.1 keV by subtracting 235U, and radon (222Rn) is determined using the peaks of 214Bi at 609 keV and of 214Pb at 352 keV (Yokoyama & Nguyen, 1980). 222Rn loss or excess is estimated by dividing its activity by that of 238U.
3.4. Age calculation
The age was subsequently determined by dividing the paleodose by the corrected dose rate according to a classical procedure (Hennig & Grün, 1983). The errors on the ages were calculated using the error on paleodose (determined using the Monte Carlo code, SI-5) and the errors on concentrations of U, Th, K (SI-6). This was performed by calculating the age from maximum (and minimum) values of all the parameters (paleodose and dose rate) inferred from their individual errors.
3.5. 40Ar/39Ar dating of illite
The sample preparation for Ar heating was performed without any chemical treatment. About 1 to 2 mg of mechanically compacted sample was encapsulated in pure silica tubes. Prior to sample loading, each quartz tube of about 0.1 cm3 was heated and evacuated under vacuum to remove air contamination on the quartz surface at 10−8 bar (Dong et al., 1995; Smith et al., 1993). After loading and before sealing, the tube was pumped during 12 h with a turbo-pump and the pressure was controlled with a gauge between the pump and the tube. The sample was then irradiated for 40h in the core of the Triga MarkII nuclear reactor of Pavia (Italy) with several aliquots of the Taylor Creek sanidine standard (28.61 ± 0.03 Ma) as flux monitor. Argon isotopic interferences on K and Ca were determined by irradiation of KF and CaF2 pure salts (see corrections in McDougall & Harrison, 1999; Steiger & Jäger, 1977). Argon analyses were performed at Géosciences Montpellier (France). After irradiation, and before heating in the sample chamber, the quartz tubes were opened with a UV laser and the amount of 39Ar lost through recoil during fast neutron interaction was evaluated on the mass spectrometer. This amount of 39Ar is then added to the amount of 39Ar released during the subsequent step-heating of the sample in order to calculate the total gas age of the sample.
4. Results
4.1. 40Ar/39Ar age of the 43031 illite sample
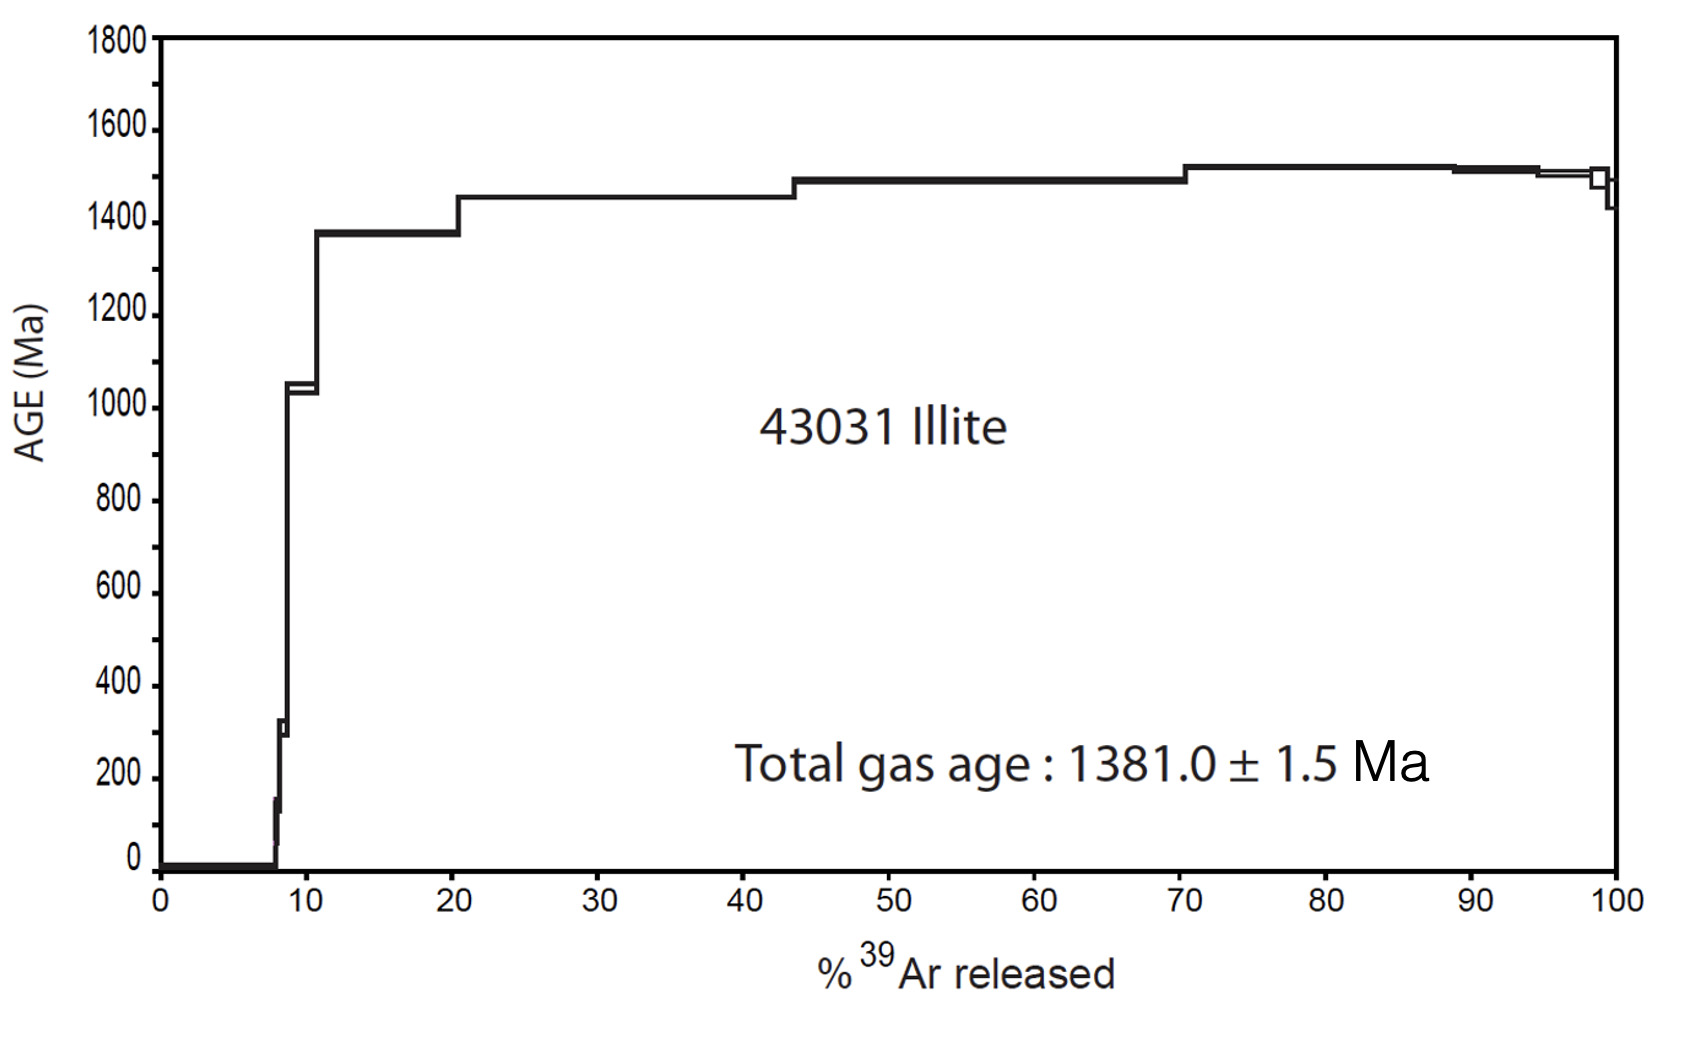
The 43031 illite from the Thelon Basin has been cross-dated combining 40Ar/39Ar dating and EPR dating. The 40Ar/39Ar experiment on the 43031 illite sample gave a total gas age of 1381 ± 1.5 Ma that takes into account a recoil of 39Ar of about 8% (fig. 2). The shape of the age spectrum suggests that argon was released from a single illite generation.
This result is consistent with the age of alteration related to the ore genesis in the Mesoproterozoic Thelon formation, and measured by previous K-Ar dating of illite which yielded a range of 1.2–1.4 Ga (Miller et al., 1989; Riegler, 2013).
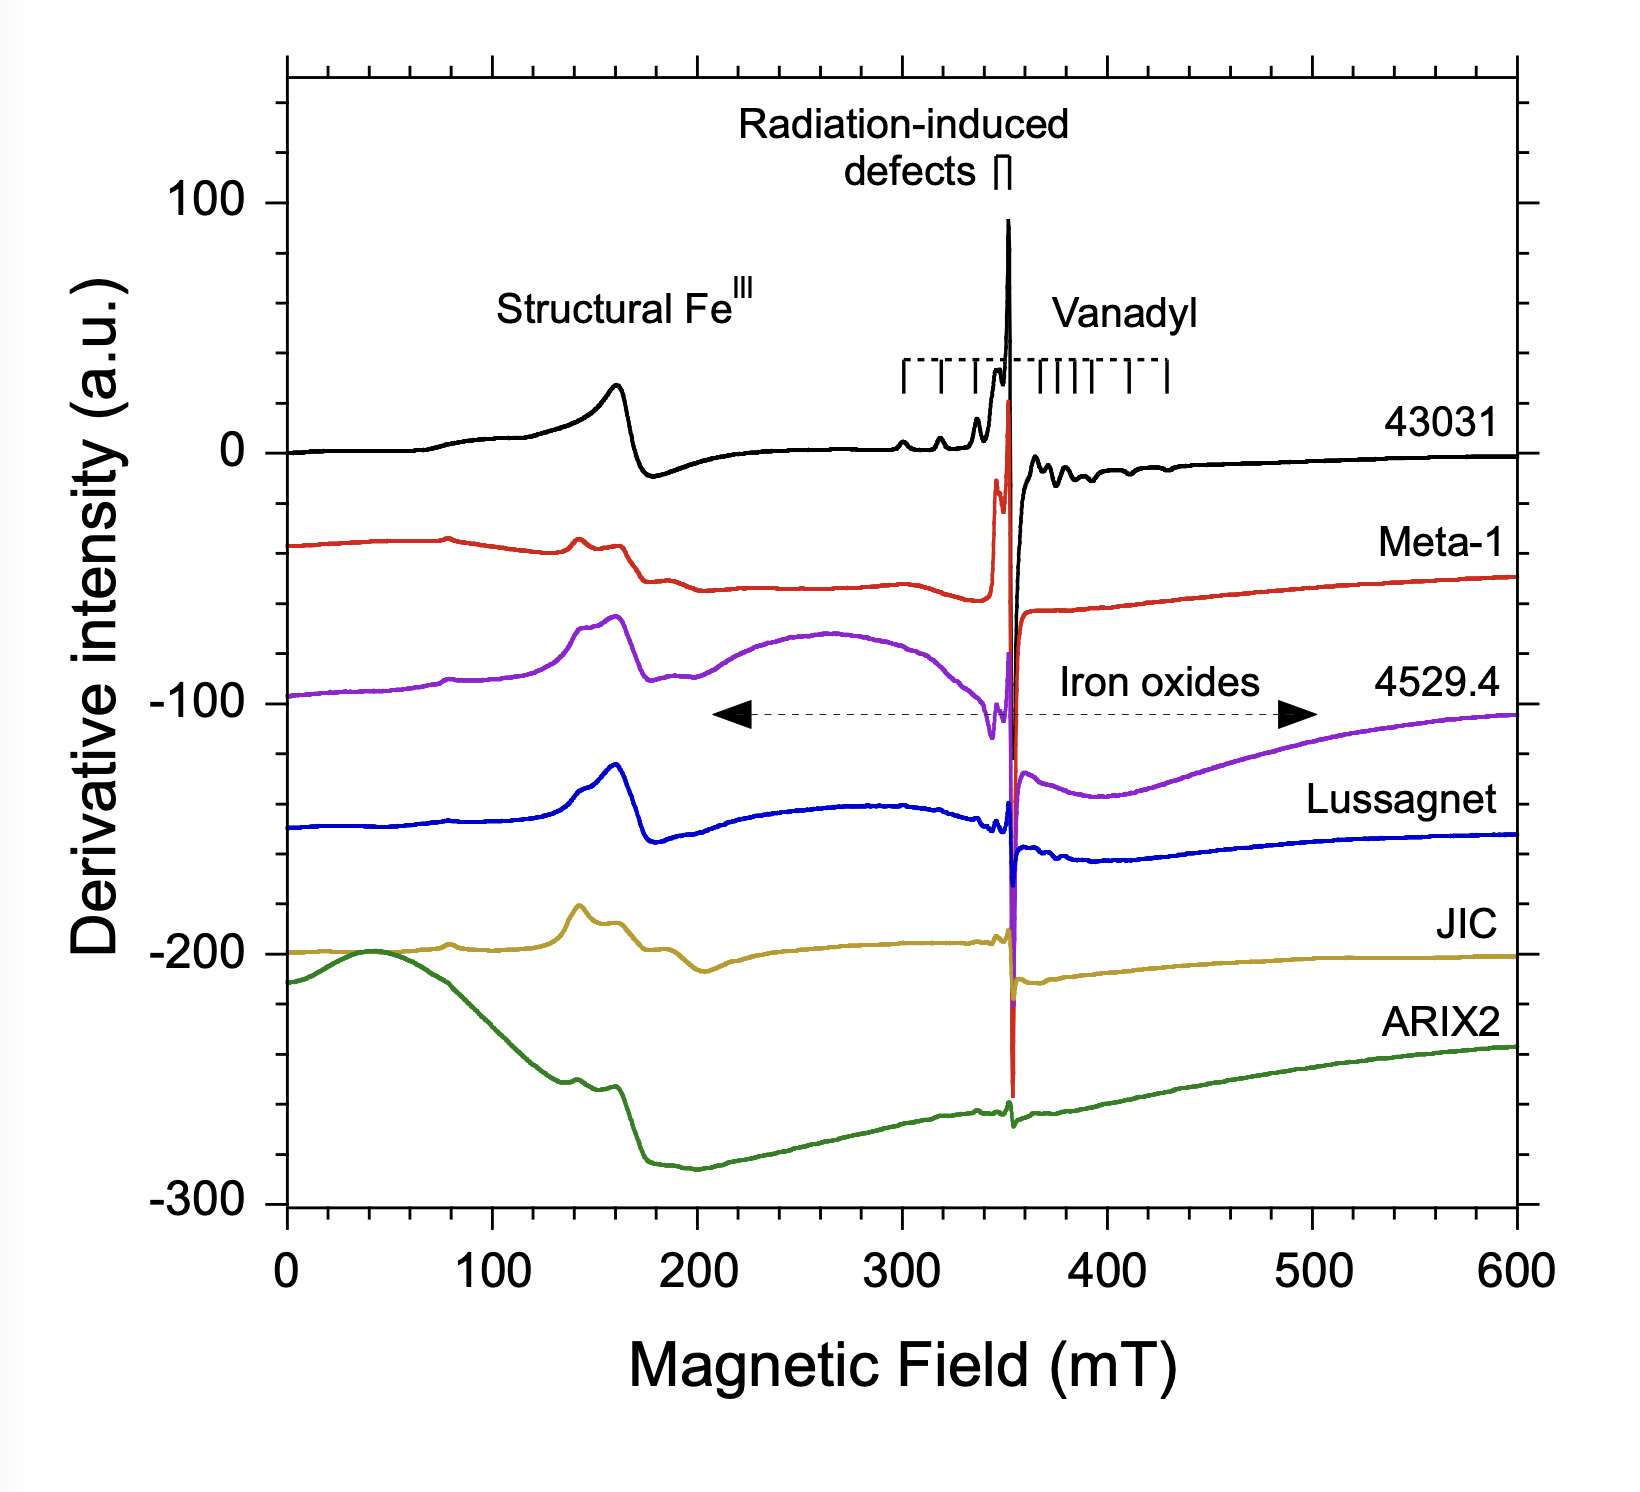
4.2. EPR analyses and paleodoses of clay samples
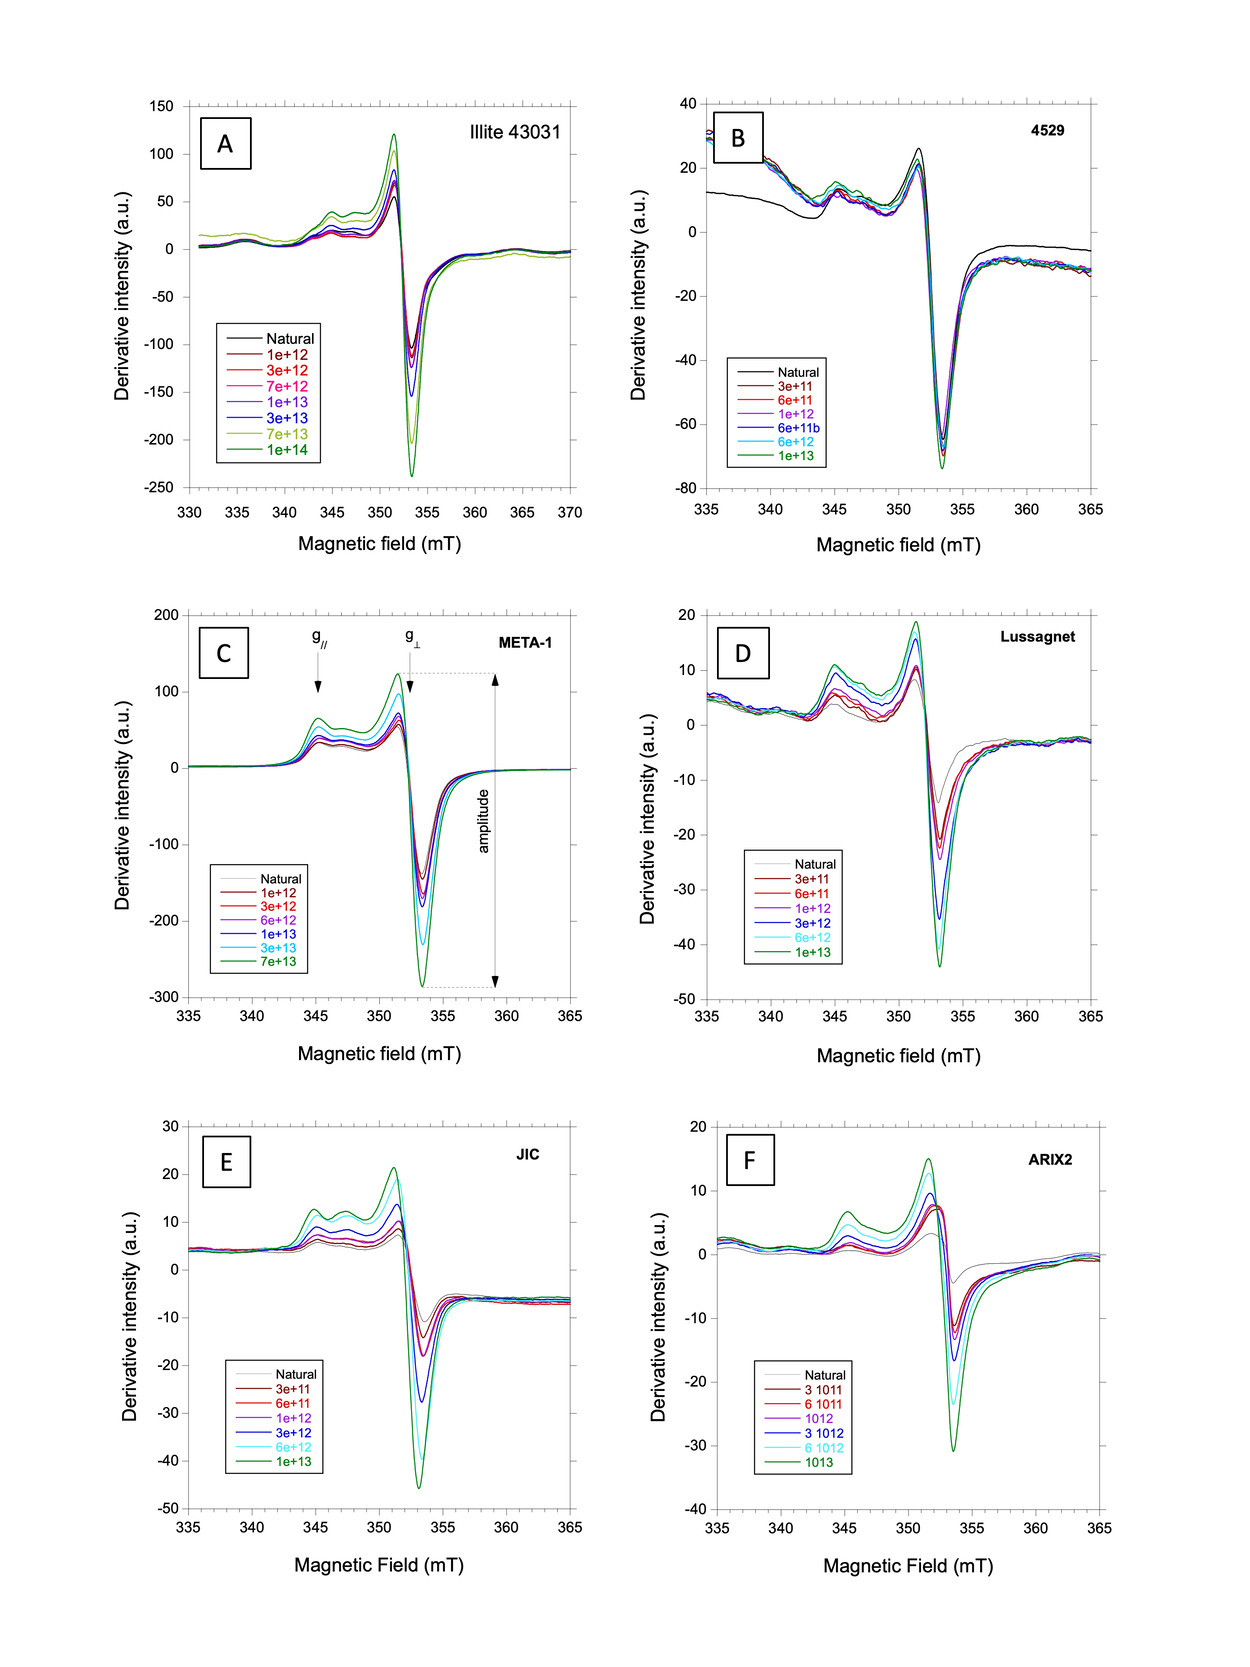
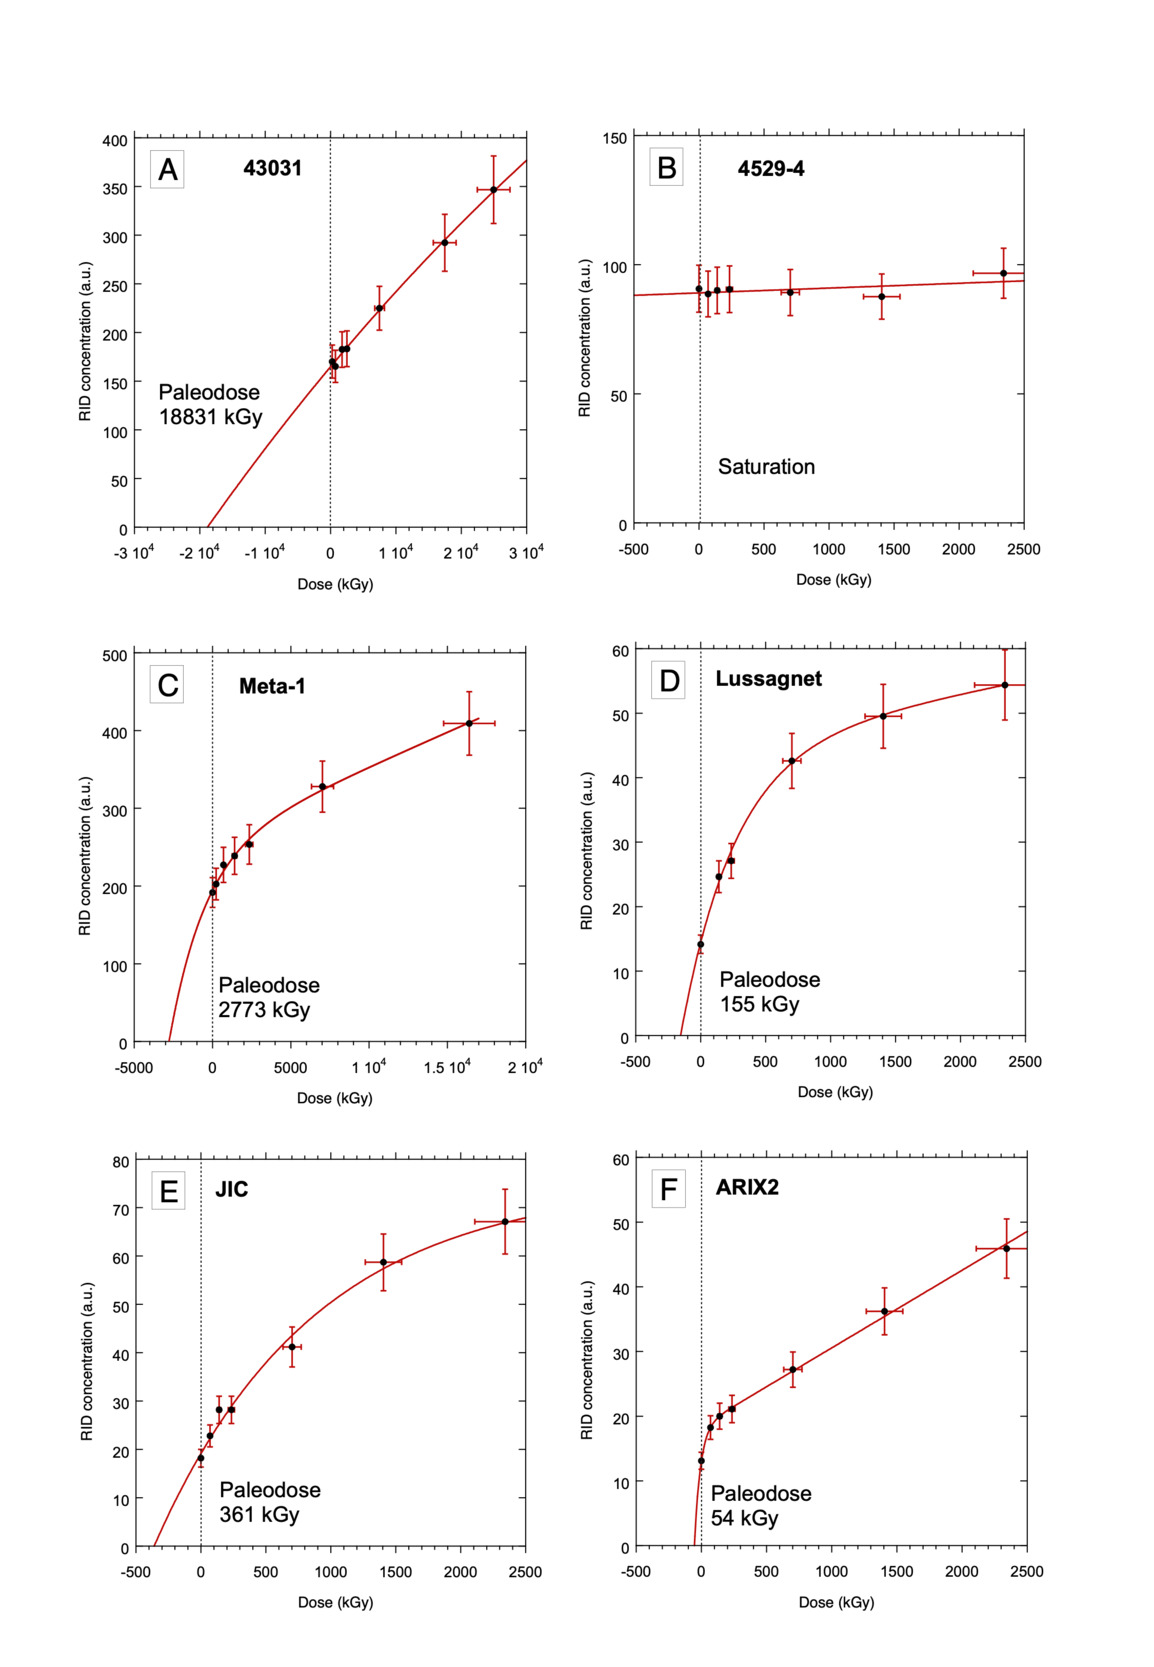
The full ranges of EPR spectra of the samples are presented in figure 3. The paleodoses are determined from the fit of dose response curves using the functions (2) or (3) (see table 2 for the dosimetry parameters) and the paleodoses are in table 2. Former studies demonstrated on a limited number of points that the saturation and the efficiency of RIDs production are sample dependent and in the best cases could be related to the initial degree of crystalline disorder of the kaolinite (Allard et al., 1994; Allard & Muller, 1998): the higher the initial disorder, the higher the saturation and the lower the efficiency. However, our experience on many samples led us to realize that the situation can be more complex, especially when there is a linear component. Therefore, it is recommended to irradiate each sample in a site. Using the dosimetry parameters of a few samples in a profile to model dose response curves of other non-irradiated samples with same crystalline disorder is not preferred, as it would only provide age estimates. The high increase of RID concentration as a function of dose (fig. 4) could potentially induce a bias on amplitude due to a modification of spin relaxation time. However, in these conditions, we would expect an increase of the signal width, which is not observed in for any dose, even for the highest amplitudes. Therefore, in the present study, the measured RID signal amplitudes for irradiated samples are reliable in the whole dose range.


4.2.1. Illite 43031 from Thelon:
The full-range EPR spectrum of the 43031 sample is typical of illite (see e.g., Morichon et al., 2008) (fig. 3). The spectrum of structural FeIII consists of a step at 90 mT and a rhombic signal around 160 mT. It is consistent with the previously reported EPR spectra of illite. Around 350 mT, an intense doublet is characteristic of the RID signal of illite, with g// = 2.049 and g⊥ = 2.002 components attesting of an axial symmetry (Allard et al., 2012 and reference therein).
The RID signal amplitude is higher than in the other clay samples, suggesting that the illite sample is older or that the dose rate was higher in this sample. The vanadyl (VO2+) spectrum displaying hyperfine transitions and an axial symmetry overlaps with the RID spectrum. Vanadyl is a common paramagnetic impurity in clay minerals, such as kaolinite (Muller & Calas, 1993) but to our knowledge EPR of illite is by far less explored.
Artificial He+ irradiation increases the concentration of RIDs, as attested by the growth of the corresponding signal amplitude (fig. 4A). In comparison, the vanadyl spectrum does not vary in amplitude or shape with the radiation dose (not shown). Consequently, its spectrum can be isolated and subtracted using a linear combination of spectra obtained at different radiation doses. The resulting spectra are plotted in figure 4A.
The dosimetry curve is apparently linear (fig. 5A), showing no saturation trend in the selected dose range. This linear dose response can correspond to the beginning of an exponential growth with distant saturation. As recommended by Grün (1996), we used a classical single saturating exponential (SSE) function to determine the Paleodose. A value of 18831 kGy (table 2), is obtained, which is the highest value ever determined for clay minerals, even considering clay-bearing U-deposits where high paleodoses can be expected (Allard et al., 2007; Allard & Muller, 1998). Considering no vanadyl correction leads to a value of 24 655 kGy, which is about 30 % higher than with correction.

4.2.2. Kaolinites from Proterozoic paleosols:
The full range EPR spectra of 4529-4 and Meta-1 samples are typical of kaolinites (fig. 3) with a medium degree of local crystalline disorder, as attested by the spectrum of structural FeIII, a probe of kaolinite order (Balan et al., 2007; Gaite et al., 1997). The characteristic RID spectrum of kaolinite is recognized from its g// and g⊥ components (fig. 4B, C). It is more intense for the Meta-1 sample. However, the two samples do not behave the same as a function of dose. While the Meta-1 signal exhibits an increasing amplitude with the radiation dose, the spectrum of the 4529-4 sample does not vary significantly. This indicates a saturation of the concentration of defects in the 4529-4 sample, which could not be predicted a priori from other physicochemical parameters (fig. 5B). For this reason, this sample was not studied further, as the geochronological information, i.e., the paleodose, cannot be evaluated when saturation of [RID] occurs. In addition, this sample exhibits a clear modification of baseline which may be due to beam damage of associated iron oxyhydroxides, but this was not further explored.
The growth curve for Meta-1 is a combination of exponential and linear functions, leading to a paleodose of 2773 kGy. For comparison, it is within the range of the paleodoses of kaolinites from U-deposits (Allard et al., 2007; Allard & Muller, 1998).
4.2.3. Sedimentary kaolinite from Lussagnet
The full range spectrum of the Lussagnet sample (fig. 3) is also typical of kaolinite. The Lussagnet kaolinite contains vanadyl (SI-4), so its contribution to the RID signal had to be removed, which decreased significantly the amplitude of the RID perpendicular component. The maximum amplitude of the most irradiated aliquot varies from 63 to 54 a.u. after VO2+ correction. The RID spectrum significantly grows with radiation dose and the dosimetry curve could be satisfactorily fitted with a combination of exponential and linear functions, yielding a paleodose value of 155 ± 29 kGy (table 2). For comparison, using RID spectra not corrected for vanadyl interference yields a paleodose of 215 ± 45 kGy using also an exponential + linear function, which is significantly higher than with correction. The corrected paleodose of Lussagnet (155 kGy) is by far lower than for those obtained for the 43031 and Meta-1 samples. In addition, the dosimetry curve exhibits a relatively high slope (or efficiency) at the origin.
4.2.4. Kaolinites from laterite Fe duricrusts
The two kaolinite samples from the Amazonian Fe duricrust have been previously dated, albeit without correction for the U, Th-series disequilibrium (Allard et al., 2018) or baseline corrections. Their full range EPR spectra (fig. 3) show a broad superparamagnetic signal related to residual iron-rich phases in the DCB-treated samples, such as nanometric phases trapped in particles (Muller & Calas, 1993), pseudomorphoses of kaolinite by iron oxides (Mathian et al., 2019) or clusters of structural iron ions in the kaolinite structure. The JIC kaolinite has a higher degree of crystalline order than the ARIX2 kaolinite, as revealed by the structural FeIII signal (Balan et al., 2007) but exhibits a strong iron oxide baseline with respect to the RID signal. Therefore, the amplitude of the perpendicular component of the RID signal was corrected according to the procedure reported in SI-3. The resulting paleodose of JIC after correction was 334 kGy instead of 361 kGy without correction (table 2). Even in this extreme case the correction is not strong and was significant only for this sample in the studied series. The ARIX2 signal (SI-4) was corrected for vanadyl interference which was strong only for the first doses (fig.4), yielding a paleodose of 47 kGy instead of 54 kGy without correction (table 2).
4.3. Assessment of dose rates and EPR ages of clay samples
In all the samples, the dose rates were assessed from U, Th, K concentrations and the elementary dose rates emitted by 1 ppm of U, Th and 1 % of K (Guérin et al., 2011). The full protocol for dose rate correction and age determination is summarized in Appendix 1. For samples originating from deep cores of several hundreds of meters (43031 illite, Meta-1, 4529-4 and Lussagnet kaolinite), the influence of cosmic rays was not considered in the dose rate calculation because they are absorbed in several meters (Prescott & Hutton, 1994). The results were subsequently submitted to the four corrections listed in the method summary (Appendix 1 ), and are detailed in the following paragraphs. In addition, the potential gamma dose rate correction arising from a close and contrasting heterogeneity in the circa 30 cm radius sphere of influence was examined and discussed for each sample.
4.3.1. Illite from Thelon
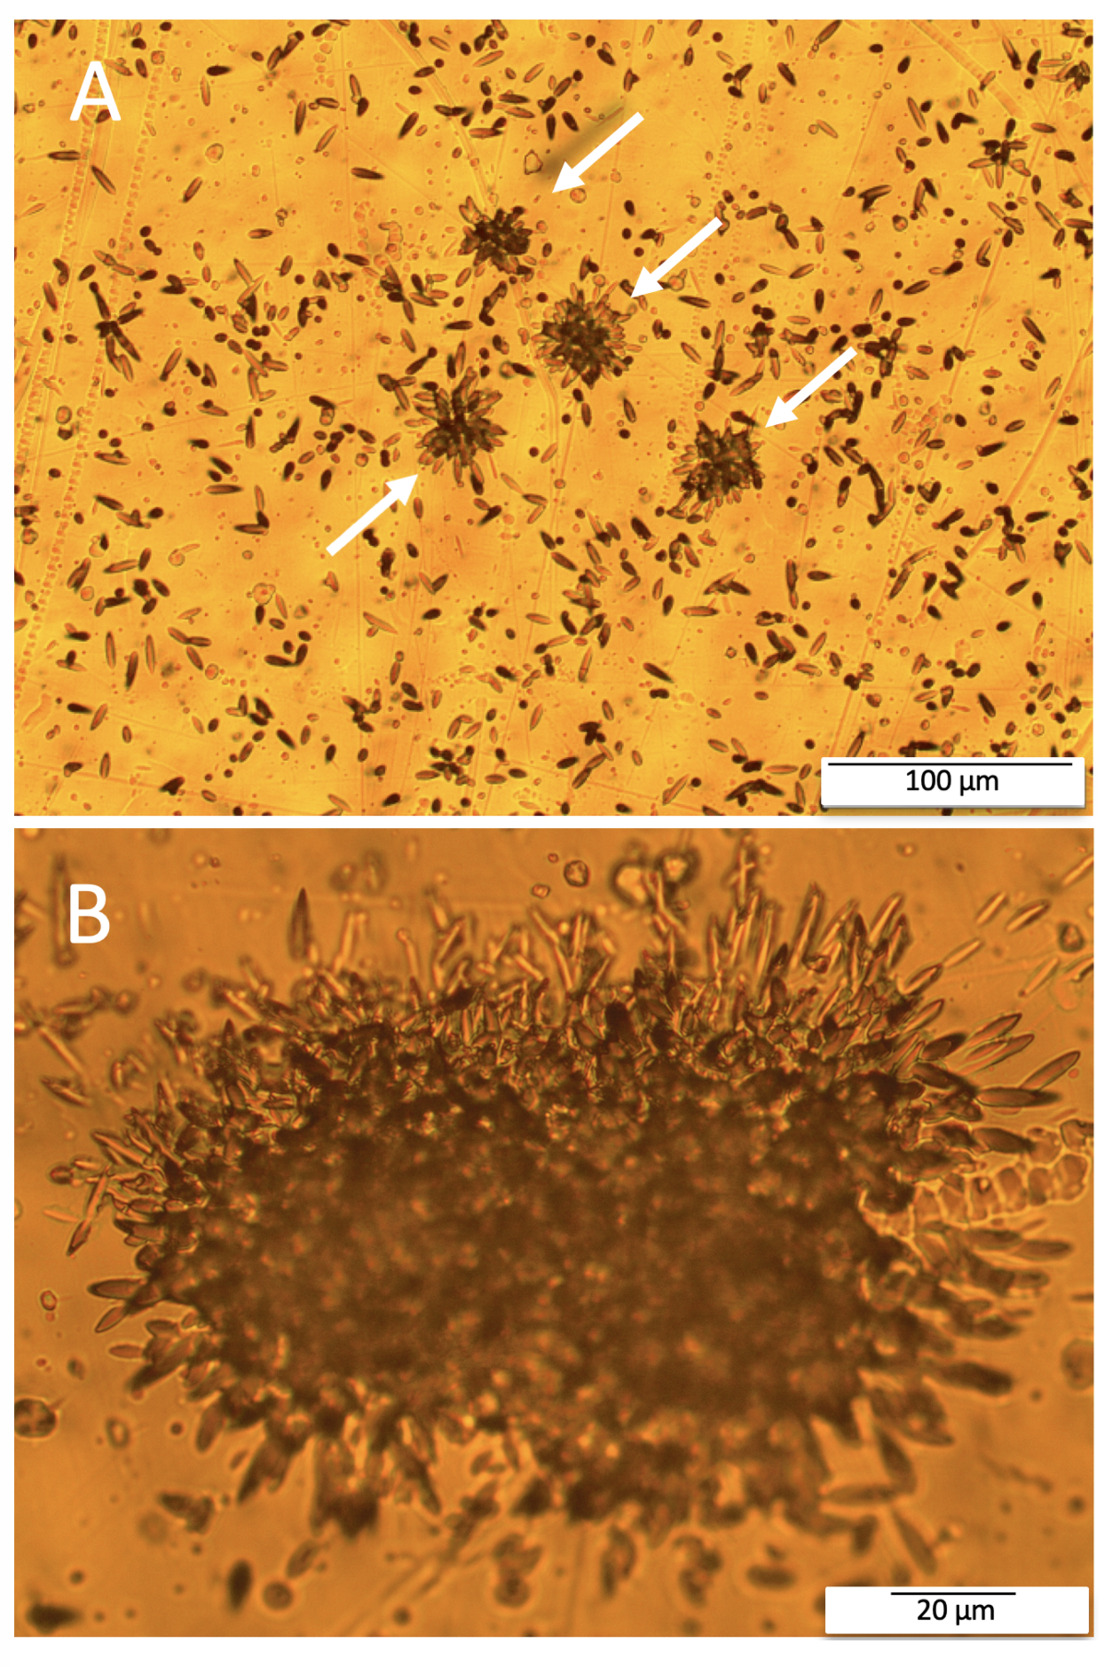
The U distribution was derived from induced fission-tracks counting (fig. 6) in the 43031 sample. Counting tracks in the Kapton film shows that 57% of the uranium is concentrated in U-bearing minerals and 43 % disseminated in the clayey matrix. However, the “urchin”-like patterns indicated that the U-bearing minerals have size well below 20 µm. Accordingly, all the alpha particles irradiate the kaolinite, so the whole, uncorrected alpha dose rate arising from U was included in the total dose rate calculation.
_and_meta-1_samples_(b)._.png)

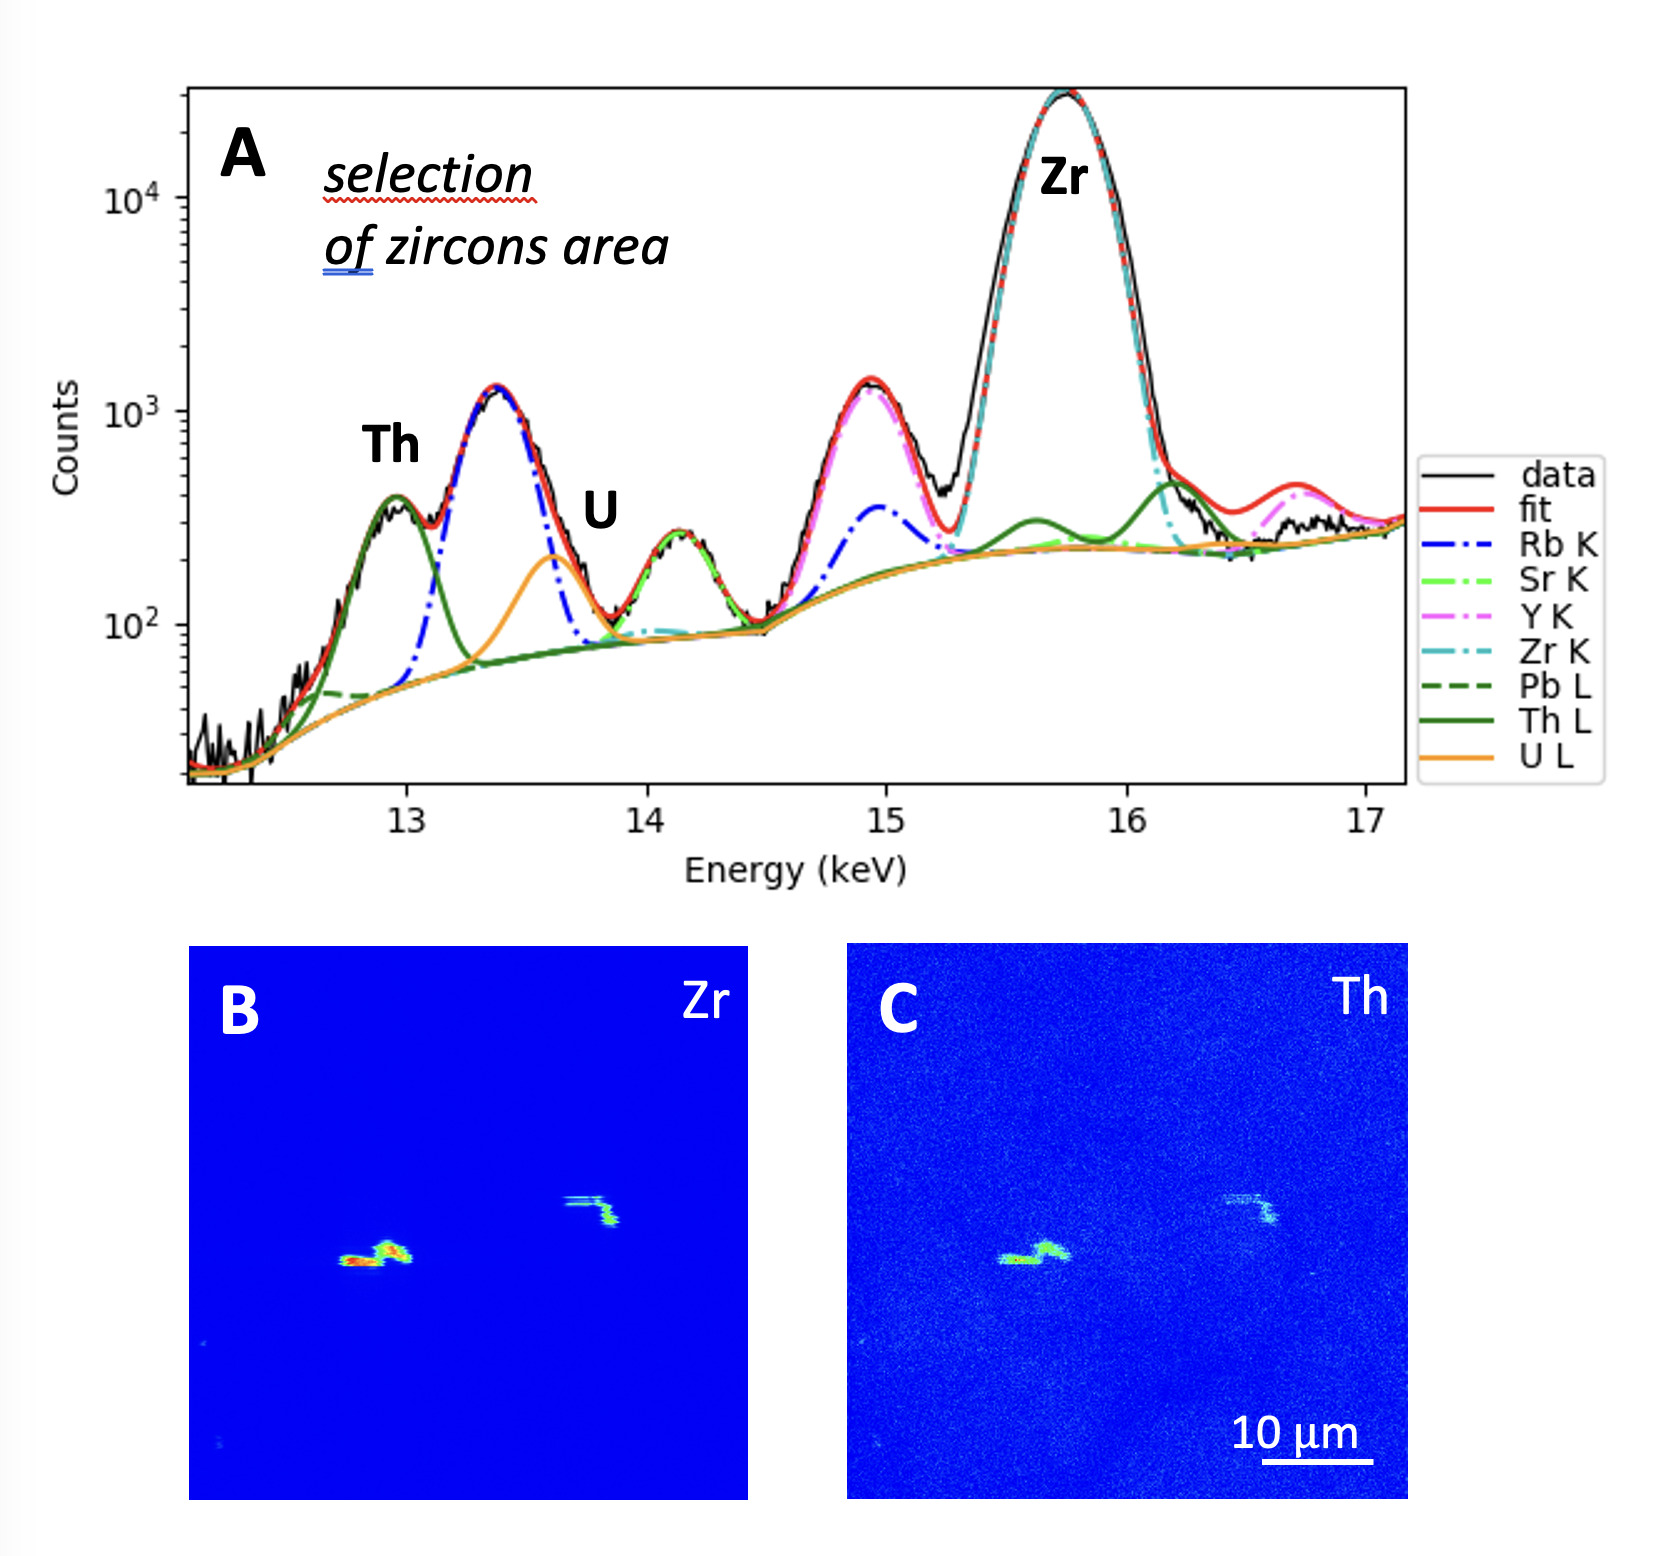
Despite the low Th bulk concentration (6.8 ppm), the Zr and Th X-ray fluorescence (XRF) maps indicate that zircon is the main host of Th (fig. 7). In the corresponding XRF sum-spectrum, the presence of Th is evidenced by its Lα XRF peak (13 keV) providing a clearly detectable peak despite the Rb-Kα XRF peak on its high energy side (13.4 keV). The intensity of the Zr-Kα XRF line (15.8 keV) is about 2 orders of magnitude higher than the Th-Lα line, as expected for Th-bearing zircon.
No Th signal could be recorded in the clay matrix, indicating a low Th content outside the zircon grains. The fact that Th is in discrete minerals and not dispersed in the clayey matrix is consistent with the low solubility of monazite, thorianite and thorite that hinders its mobility at low temperature (Bollaert et al., 2023; Gascoyne, 1992; Langmuir & Herman, 1980). The sizes of Th-bearing grains that could be detected were however small compared to the propagation range of alpha particles (fig. 7) indicating that a dominant part of alpha energy could be deposited in the surrounding illite. As for uranium, no correction of the alpha dose related to the spatial distribution of thorium was therefore required. This provided a maximum value of dose rate because the existence of coarser grains of zircon in the sample cannot not be fully excluded on the basis of the imaging of selected zones.
Concerning the disequilibrium of decay chains, the activity of various isotopes was analyzed by gamma spectrometry (SI-7). The 226Ra and 222Rn activities are about 10 times that of 238U, which indicates that the system is significantly out of equilibrium at present. Two extreme scenarii related to the disequilibrium were considered in the dating exercise. These two scenarii consist in (i) a recent perturbation of the system leading to Ra and Rn excess or (ii) an ancient and protracted flux of Ra. Concerning the other corrections, the average quartz grain radius was 10.6 µm, and the corresponding quartz content was circa 8%, as estimated by normative calculation using the chemical composition of the bulk sample and the structural formulas of minerals. The water content in the natural medium was estimated by assuming that the porosity of the altered, illite-rich material was saturated with water. According to the density of the same altered material given by Riegler, Quirt, et al. (2016), i.e., d = 1.7, the water content is 18 %.
According to the massive illitization level of the 43031 sample originates from, we will consider herein that the gamma contribution in a 30 cm radius sphere around the sample is homogeneous (see results and Appendix 1).
The final dose rate obtained from these corrections is 27798 mGy/ka. It is comparable to those determined in other systems such as lateritic profiles (see e.g., Balan et al., 2005). For the illite sample, the dose rate related to the 40K decay is ca 104 mGy/ka, which is similar to the total dose rate arising from U (1.7 104 mGy/ka) and higher than the one for Th (5.6 103 mGy/ka).
The elevated paleodose and the limited dose rate are consistent with an unusually old age, as the concentration of the radiosources is rather low, i.e., a few ppm for U and Th (see table 1).
Considering in the first above-mentioned scenario where secular equilibrium prevailed and the Ra and Rn excess occurred recently gives an EPR age for the Thelon illite at 677 ± 122 Ma, which is significantly lower than the 40Ar-39Ar age (table 3). Alternatively, the second scenario of a Ra and Rn excess that would be maintained during the whole life of the clay would give an EPR age of 183 ± 35 Ma.
4.3.2. Meta-1 kaolinite from Proterozoic paleosol
The mapping of U at the microscopic scale in the Meta-1 kaolinite showed “coarse” (> 20 µm, fig. 6B) U-bearing minerals representing a proportion of 43% of total U. The other 57 % proportion corresponds to small (with size well below 20 µm) U-bearing mineral grains disseminated in the clay matrix and is included in the assessment of the alpha dose rate.
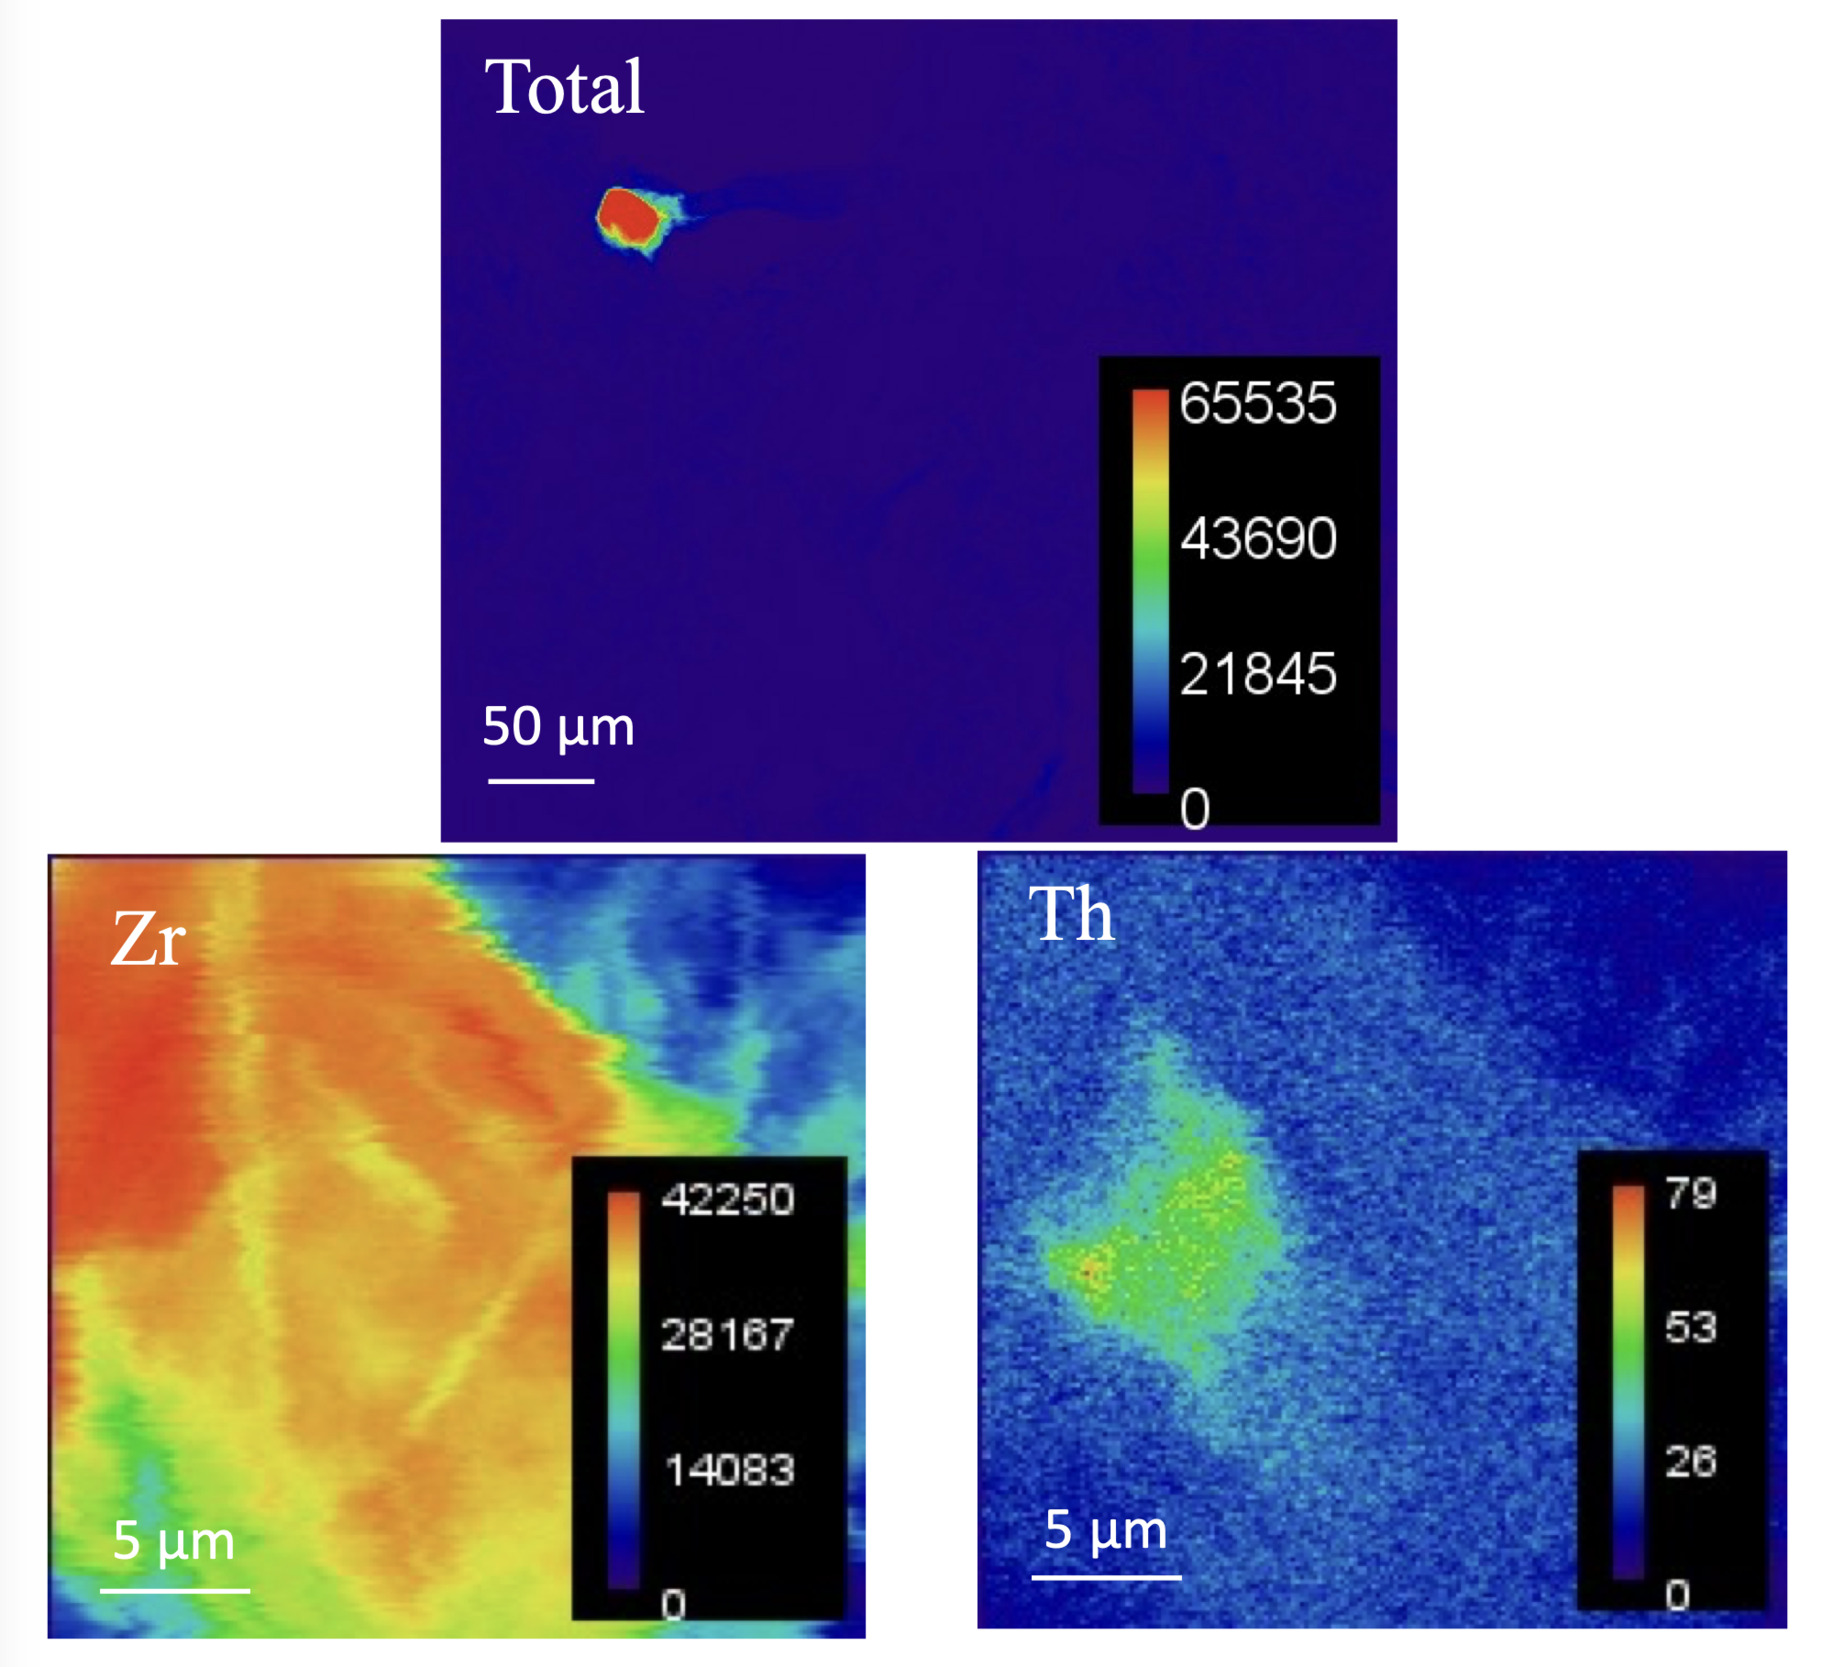
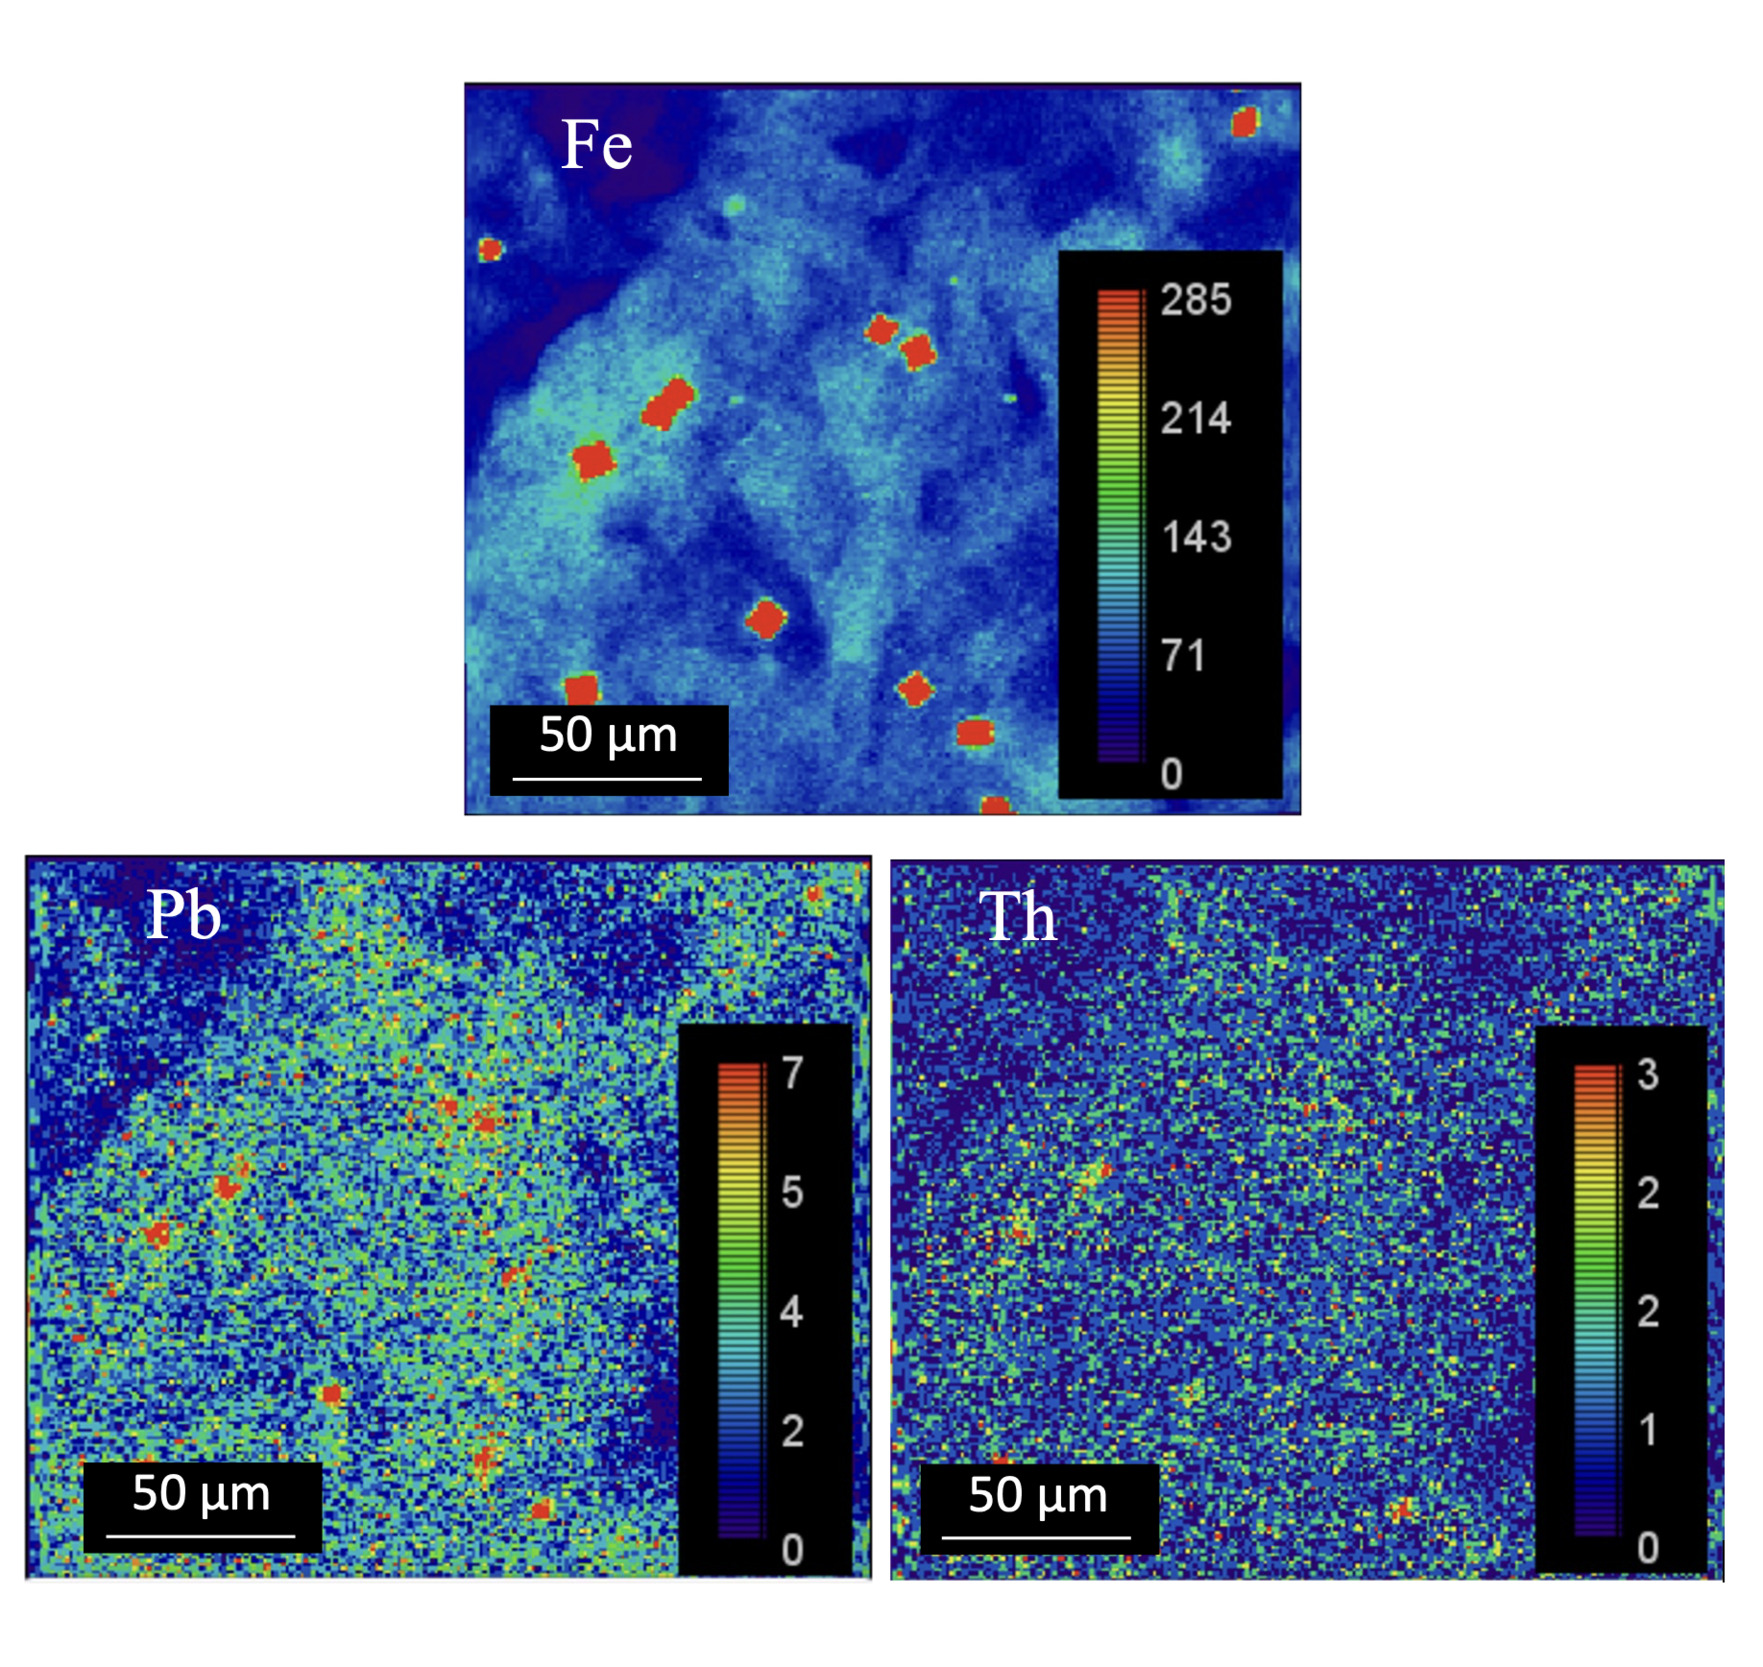
The Th mapping shows that this element is mostly hosted in the core of isolated grains such as > 20 µm zircons (fig. 8). This mapping is not significantly influenced by interference with Pb fluorescence (SI-8). Considering the low Th concentration in the Meta-1 sample, this element is likely distributed in a few grains (nugget effect) as illustrated in figure 8. Consequently, the alpha contribution arising from the Th decay chain is not integrated in the calculation of the dose rate.
The results of gamma spectrometry (SI-7) allow us to picture the disequilibrium of the radioactive system corresponding to the raw Meta-1 sample. The Rn/U activity ratio is 1.22 and indicates a slight accumulation of Rn in the present sample.
The quartz grains have a mean radius of 85 µm, with a quartz concentration of 56%. The estimation of water content was performed considering the weathering origin and the kaolinite content of the material, which suggests that the paleosol was a laterite. An average water content of 20% can be considered according to Belk et al. (2007) and Bruno et al. (2006) . However, after a certain time of burial, the profile may have suffered significant compaction. At present, the porosity is 20.5 %, which corresponds to a 13.4 % water content at saturation (for a total density of 1.5), which is considered a minimum value. These two scenarii of water content will be considered in the dose rate and age calculations.
From the previous data, it is inferred that the dose rate is 6404–6879 mGy/ka for the Meta-1 sample, with all Th hosted in “coarse” (>> 20 µm) minerals and with two extreme water contents (20% and 13.4 %). As the concentration of radiosources in this sample is low (2.37 ppm for U, 2.05 ppm for Th and 0.28 % for K2O), the high paleodose is indicative of a rather old age. The EPR age of Meta-1 determined with a 20 % water content is 433 ± 166 Ma, indicating a formation at the Cambrian or Ediacaran period. If early compaction occurred and corresponds to the present 13.4 % water content, the age decreases to 403 ± 155 Ma (table 3), which is just below the Ediacaran period within the error range. If we consider that secular equilibrium prevailed during the lifetime of kaolinite and the excess of Rn was recent, the ages are 515 ± 196 Ma and 480 ± 182 Ma for 20% and 13.4% of water content, respectively, assuming the same relative errors with the scenario of constant radioactive disequilibrium. Such values are closer to the Ediacaran period.

4.3.3. Sedimentary kaolinite from Lussagnet
The induced-fission tracks mapping shows that 91% of U in the Lussagnet sample is in small-sized (less than a few microns) U-bearing minerals. Accordingly, the whole alpha particle dose-rate is counted in the dose-rate assessment. The Th map only shows low intensity and the XRF spectrum reveals that the Th-Lα peak is minor and located between the much stronger Pb-Lβ/Lγ and Rb-Kα peaks (SI-8), resulting in poor analytical sensitivity for Th in this sample (fig. 9). As X-ray fluorescence did not conclusively detect Th neither in bearing minerals nor in the matrix, the thorium dose rate was calculated by considering two limit cases, either with Th spread in the matrix or with Th hosted in coarse Th-bearing minerals. The bulk Th concentration is low (4.7 ppm) and it is not excluded that few minerals host the majority of this element and were missed by the analyzed area (220 x 196 µm) due to a nugget effect.
Gamma-ray spectrometry indicates a slight excess of Rn, with a Rn/U activity ratio of 1.23. Thus, a small excess of Rn was considered in the dose rate correction.
The presence of quartz has a significant effect on the alpha dose of U, multiplying it by two. Concerning the correction related to water, the porosity is within 23–43 % corresponding to water contents at saturation between 17 and 32 %. This only induces a moderate variation of the dose rate. The corrected dose rate is 9601 ± 789 mGy/ka when Th is disseminated in the matrix. This yields to an average EPR age of 16.1 ± 4.3 Ma (table 3). Assuming secular equilibrium (and thus late excess in Rn) gives an age of 16.8 ± 4.5 Ma.
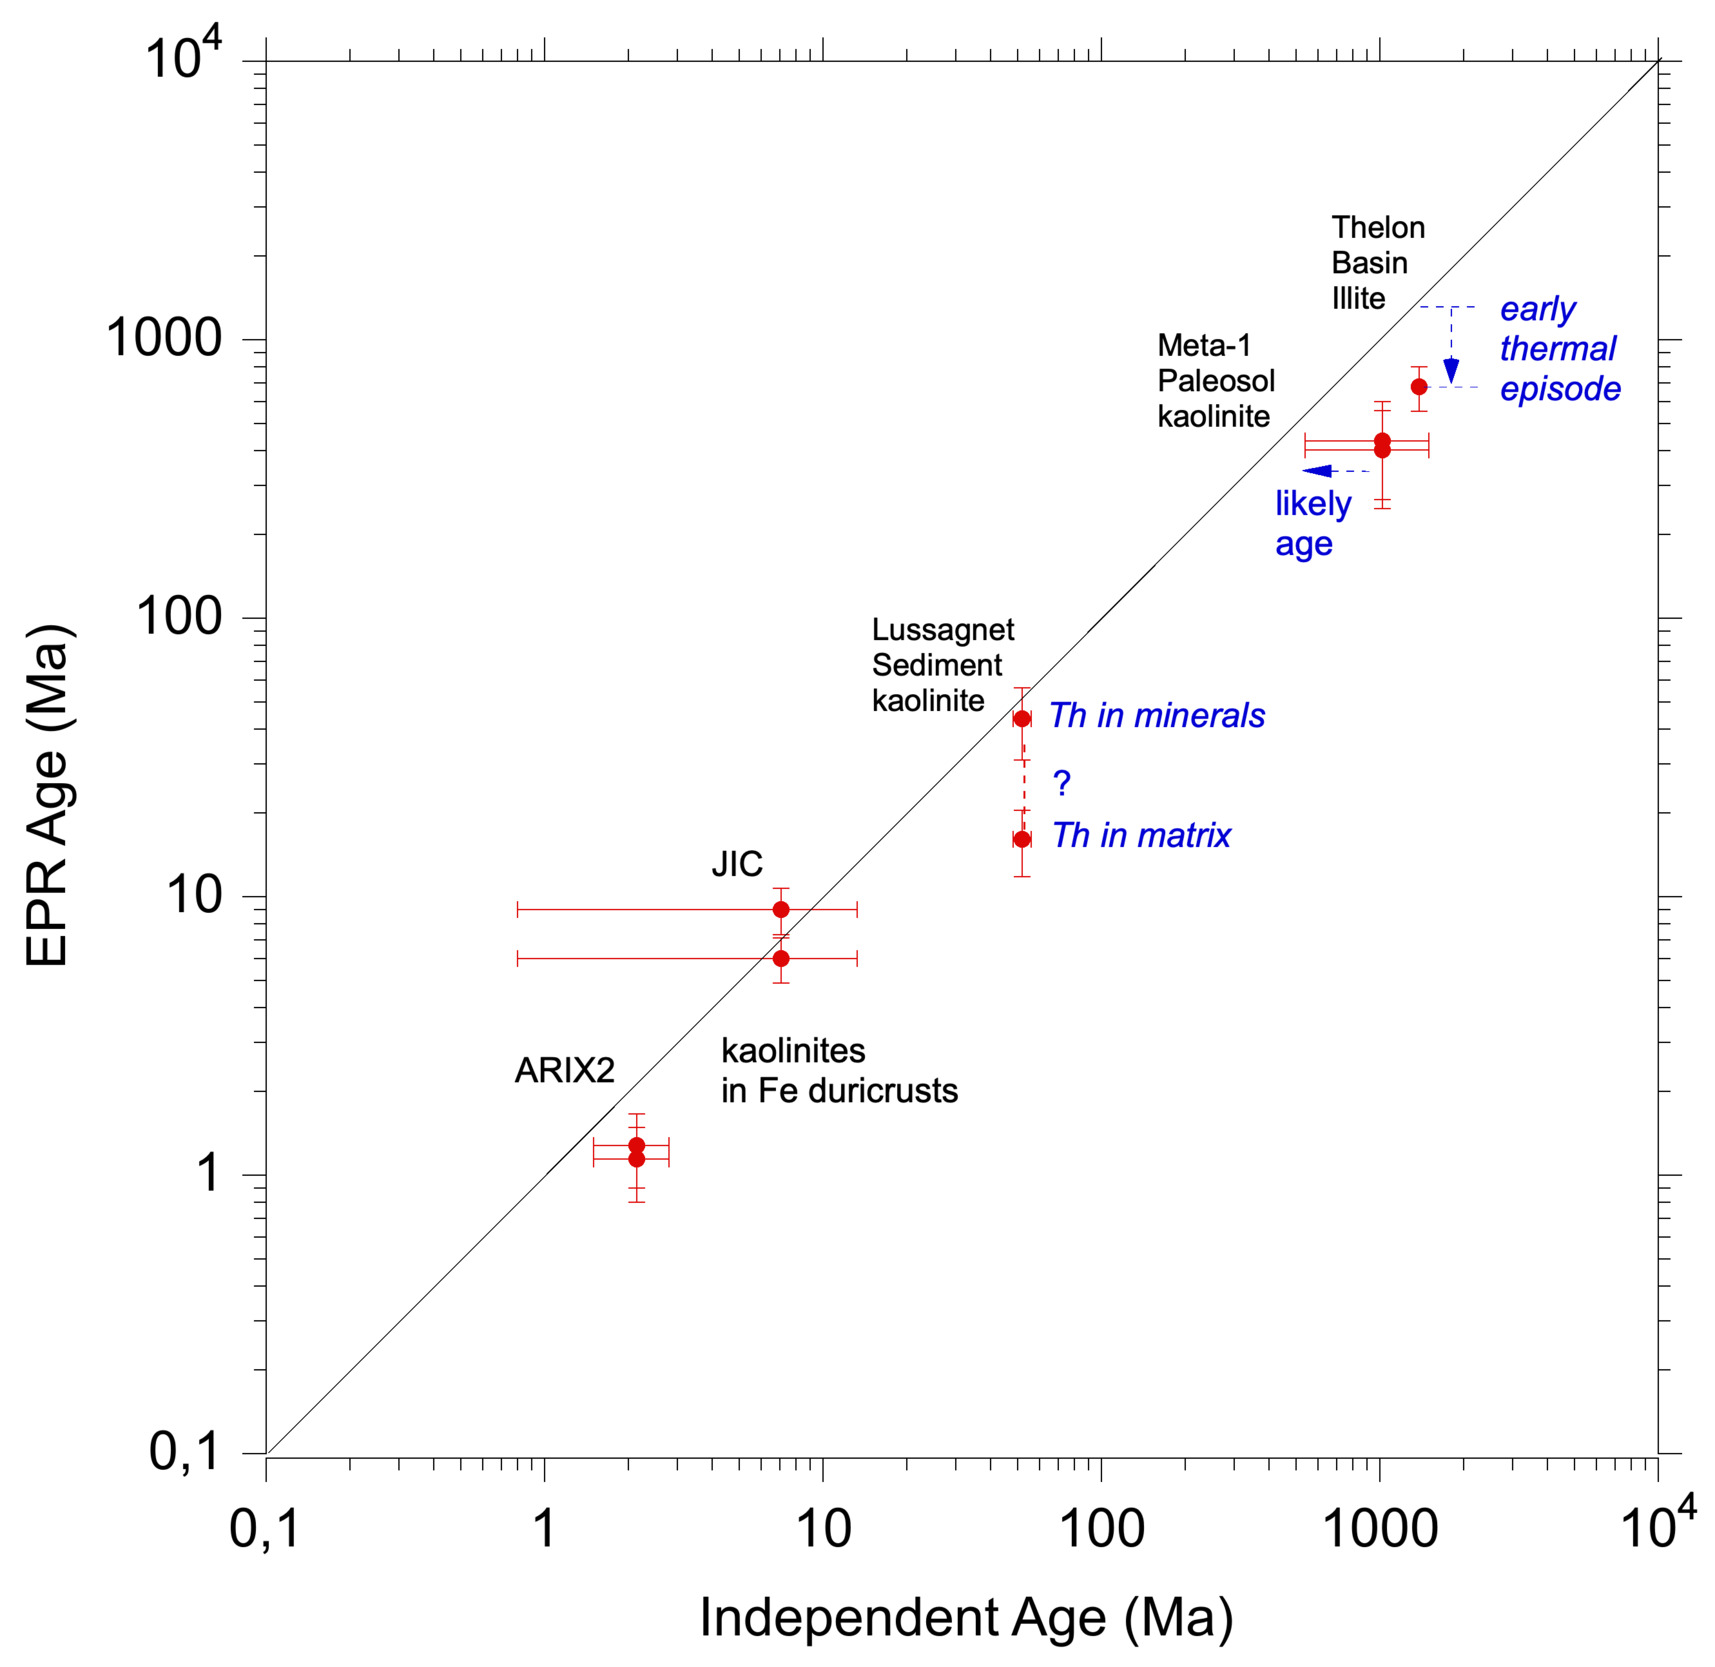
If Th is assumed to be concentrated in the coarse Th-bearing minerals, the alpha contribution is neglected and the corrected dose rate is in the range 3553 ± 353 mGy/ka, which is thus significantly lower than in the former scenario. The corresponding EPR age is 43.6 ± 12.6 Ma, which is very close to the 1/1 line (table 3, fig. 10). Assuming secular equilibrium gives 48.9 ± 14.2 Ma.
In addition, X-ray fluorescence maps reveal the presence of cubic grains a few microns in size that were interpreted as pyrites owing to their high Fe signal, their shape and their current occurrence in sedimentary basins (Chang et al., 2022). This suggests that the sedimentary sample could have experienced diagenesis (fig. 9A).
_of_lussagnet_sample_showing_small_(a_few_micro.png)

4.3.4. Kaolinite from laterite Fe duricrusts
In the Amazonian duricrusts, uranium is mostly contained in the pisoliths embedding the kaolinite and almost absent in the interstitial Fe oxide cement (Allard et al., 2018). Proportion of U hosted in U-bearing minerals is negligible (0.2 % and 0.8% for ARIX2 and JIC, respectively). The new gamma spectrometry data indicate that the Rn/U ratio is 1.2 for ARIX2 and 1.0 for JIC, corresponding to a slight Rn enrichment and equilibrium, respectively. It was also assumed that the water content was negligible as a result of the compact structure of the pisoliths or cement. On these Fe-duricrust samples for which the iron concentration is very high, the Th fluorescence cannot be recorded by XRF because iron induces a dominant pile-up signal which is strongly interfering with the one of Th. Thus, as for the Lussagnet sample, no Th spatial distribution was available and two extreme scenarii were considered, i.e., with all Th contained in coarse (>> 20 µm) bearing minerals or disseminated in the iron oxide matrix. Concerning the cosmic ray contributions, the samples from the duricrusts ARIX2 and JIC, were collected in the field at or near the surface. The average dose rate of cosmic rays is around 300 mGy/ka at the surface and decreases strongly to reach about 150 mGy/ka at 1 m depth (Prescott & Hutton, 1988). The calculated dose rates of the two duricrust samples considering the new data of gamma spectrometry are 41–37 x103 and 37–56 x103 mGy/ka for ARIX2 and JIC samples, respectively, considering two extreme scenarii of Th distribution. Because U and Th concentrations are relatively high (circa 11 ppm for U and 5–25 ppm for Th), the dose rates of cosmic rays appear comparatively negligible, i.e., 0.7 and 0.8 % of the U, Th, K total dose rate at surface (ARIX2) and even smaller at 2.1 m depth for JIC. Such values are comprised within the dose rate error and have then been neglected.
Depending on the two Th distribution scenarii, the ages of ARIX2 kaolinite are 1.14 ± 0.34 – 1.28 ± 0.38 Ma (table 3, fig. 10). This small difference is due to the relatively low concentration of Th, which is half as low as that of U.
Some geometrical considerations of the dose rates must be reported here owing to the potential contrasting contribution to the dose from the sample surrounding. The distant contribution of gamma rays can be estimated from the simplified procedure described in Appendix 1. The ARIX2 duricrust has a thickness of at least several tens of cm and even if the surrounding Iça sediments contributed a little to the gamma dose rate of the sample it would not be very contrasting. Indeed, a possible contribution from the Iça sediments outcropping elsewhere can be estimated: the average gamma dose rate of Iça sediment samples studied by Allard et al. (2020) is 1119 mG/ka and for the studied ARIX2 kaolinite it is in the same order of magnitude i.e., 1880 mGy/ka. In addition, considering now that the ARIX2 duricrust was outcropping since its formation would imply that half of the gamma ray dose did not apply to the sample. The estimated age calculated with half the gamma contribution is only higher of circa 0.04 Ma, which is well within the total error.
In the JIC profile, the potential influence of the next overlying BC horizon at 175 cm depth on the gamma dose rate can also be estimated. The concentrations of U and Th in this horizon are 4.7 ppm and 32.6 ppm, respectively, giving a gamma dose rate of 2230 mGy/ka, which remains close to the one for the studied JIC sample (2642 mGy/ka) and does not induce substantially different value of the age. Thus, for JIC the ages are 6.0 ± 1.1 and 9.0 ± 1.7 Ma (table 3, fig. 10).
5. Discussion
5.1. Significance of the EPR ages of clay minerals
The EPR age corresponds to the duration of accumulation of RIDs in the structure of the clay. In the Earth’s surface conditions for which the thermal annealing of A and Ai -centers can be considered as negligible, the age traces back to the beginning of crystallization of the clay mineral, because the defects are not inherited from solution but are formed and progressively accumulate in the structure of the mineral (Ikeya, 1993).
5.1.1. The Thelon illite
The Thelon illite is dated by EPR with an age at 677 ± 122 Ma in a first scenario of a recent 226Ra and 222Rn excess, which gives rise to several points of discussion. The 39Ar/40Ar age provided in our study (1.381 Ga) is in agreement with the ages on illite from 40K/40Ar and 39Ar/40Ar geochronological data for the Thelon Basin, i.e., 1.2–1.4 Ga (Fuchs et al., 1986; Miller et al., 1989; Riegler, 2013) and in situ U/Pb on uraninite (Sharpe et al., 2015). In addition, the 226Ra excess in water can originate from alpha recoil of 230Th parent (Osmond & Cowart, 1982; Sun & Semkow, 1998) or desorption from reactive mineral sites (Vinson et al., 2018). Ra in water is thus derived from local water-rock interaction. It could be accumulated in excess in water from some distant U mineralized zones, transported and adsorbed onto illite to induce a local excess with respect to formerly present U. Sorption of Ra2+ on reactive sites of solids such as clays (including illite) or, in oxidizing environment, Fe or Mn oxides, is a significant process of retardation (Fernandes et al., 2023; Hidaka et al., 2007; Levinson et al., 1982). Subsequently, Rn would rapidly equilibrate with Ra if no strong isotopic exchanges occur, explaining why the activities of these two isotopes are similar (SI-7). The two extreme scenarii of Ra mobility that are proposed herein result in contrasting EPR ages of the Thelon illite, i.e., 677 and 183 Ma. Whatever the scenario, the EPR age is significantly younger than the 40Ar/39Ar age of 1.3 billion years.
In the first scenario where Ra excess occurred recently, the average half-life of illite defects at 290 K is to be 9 Ga as estimated in the present study using the data of Riegler, Allard, et al. (2016), so the EPR age discrepancy between 677 ± 122 Ma and the Ar/Ar age (1380 Ma) suggests that strong annealing of the defects occurred at high temperature. The illite experienced a thermal episode around 200 °C–100 °C during at least 400 Ma according to Hiatt et al. (2010) and Grare et al. (2021). Even at a temperature of 100 °C (373 K), the extrapolated half-life of RIDs would be 230 ka, which is negligible compared to 1.3 billion years. Therefore it is inferred that RIDs acumulation occurred only after the thermal episode, i.e., after 800–900 Ma ago, which is consistent with the EPR age (fig. 10) and is also in agreement with the known geological evolution of the Thelon Basin. In this case, the Thelon illite would be the oldest clay mineral ever dated by EPR and this age extends the time range that is potentially covered by this method to Proterozoic. Nevertheless, this first scenario is subservient to an evolution of dose rate due to “recent” 226Ra and 222Rn mobility. A contamination of the sample from isotopically-enriched waters of initially disconnected aquifers due to local drilling could also explain the above-mentioned results. Indeed, contamination by Ra-enriched fluids has been often documented in drilling equipment associated with various fields such as oil-field production or geothermalism (Ceccarello et al., 2004; Eggeling et al., 2013; Thakur et al., 2021).
Alternatively, it may be hypothetized that some snowmelt water input into the basin mixed with Ra-rich zones from distant U ore, produced a recent radioisotope anomaly since the end of the last glaciation (circa 11 000 yrs ago). This type of Basin aquifer recharge in the Pleistocene-Holocene could be evidenced down to 50–1000 m in various regions at the Earth’s surface including North America (McIntosh et al., 2012). In addition, in his study of paleomagnetism and associated fluid flow in the Thelon Basin, Dobrokoczki (1998) reported a late low temperature secondary magnetization (and thus fluid flow) consistent with the present-day magnetic field (< 10 ka). All these published data related to present Ra contamination or Holocene Ra migration support a recent Ra excess, and consequently also support the first scenario leading to an illite EPR age of 677 ± 122 Ma.
If the 226Ra, 222Rn excess was maintained during the whole existence of the Thelon illite (second scenario), a Trias age of 183 ± 35 Ma is calculated as a minimum endmember. This could not be related to any alteration episode in the known geology of the Thelon Basin. This scenario would imply a continuous supply of Ra to the sample since the formation of the illite. Indeed, if this episode was punctual and unsupported by parent U, the activities of short-lived 226Ra (half-life ~1600 yrs), 222Rn (half-life 3.8 days) and daughter isotopes should have returned rapidly equal to the activity of U, which is not the case. This second scenario would require a better knowledge of fluids pathways and distribution of upstream ore deposits in the basin to be confirmed. Evidence of such a protracted flux of Ra would not support the calibration, but this scenario is not preferred because it is not consistent with the history of the Thelon Basin, as no alteration episode can be related to the Trias period (Grare et al., 2021; Hiatt et al., 2010). Consequently, it is not reported in figure 10.
It is noteworthy that the approximately linear dose response curve for the Thelon illite is so far unique, showing no saturation in a large investigated dose range, and suggests that even much older ages than 677 Ma could be reached, provided that no annealing occurred during thermal episodes of the geosystem.
5.1.2. The Meta-1 kaolinite
For the Meta-1 sample, the EPR ages range from 403 ± 155 to 433 ± 166 Ma, which is consistent with the overlying sediments provided that the maximum error on the age is considered. The independent age of the profile is ill-defined (fig. 10) because it spans between the age of exhumation of the granite (1500 Ma) and that of overlying sediments (late Ediacaran age around 550 Ma). It is unlikely to find an age of the tropical paleosol close to that of the parent material because weathering profiles developed on granites (Mathian et al., 2020) or on sedimentary rocks (Allard et al., 2020; Balan et al., 2005) may result from several cycles of weathering and erosion. The Meta-1 sample is much younger than the period corresponding to the granite exhumation, and an independent age older that Ediacaran period is not likely. This is supported by the paleoclimatic evolution in the Neoproterozoic period. Indeed, at least two events of glaciation have been recognized, the most recent one corresponding to the Marinoan (Early Vendian) ice age around 590-610 Ma (see e.g., Barfod et al., 2002; Chumakov, 2003; Narbonne & Gehling, 2003). Some authors also depict Neoproterozoic glaciations as snowball Earth episodes followed by a significant rise of atmospheric CO2 of volcanic origin (see e.g., P. F. Hoffman et al., 1998). In such conditions of ice age at the Early Vendian, one can expect a break in weathering and also mechanical processes that would have at least partially eroded continental surfaces. The paleosol may thus have developed in the following Ediacaran period after this erosion episode, which would be an intense weathering period consistent with observed CO2 rise in the atmosphere. The intense Ediacaran kaolinitic weathering is well documented in the area (Liivamägi et al., 2018, 2021). It is likely that the Metaspere paleosol profile has been rapidly covered and protected by sediments from the same period, explaining its exceptionally good preservation (Liivamägi et al., 2021). Therefore, both 433 ± 166 and 403 ± 155 Ma EPR age of Meta-1 sample are consistent with this geological model of an Ediacaran age of 540-630 Ma, taking into account the errors on our results. A higher water content occurring when the paleosol was buried would significantly decrease the dose rate and thus increase the age. However, the compaction period could potentially decrease the age if this episode lasted enough. It is also not excluded that a moderate thermal episode (lower than 100–120 °C) may also have lowered the concentration of RIDs and thus the age, which could explain the difference in obtained results by comparison to an Ediacaran age.
The other sample of Ediacaran paleosol could not be dated because it exhibited a saturation of defect concentration. This behavior was so far encountered only once in a specimen of kaolinite intimately associated with U-bearing minerals occurring in the Cenozoic hydrothermal U-deposit in Nopal, Mexico (Allard, 1994; Allard & Muller, 1998). It may require a relatively high natural dose arising for a high dose rate, an old age or a peculiar sensitivity to RID production which cannot yet be predicted without artificial irradiation.
5.1.3. The Lussagnet kaolinite
The uncertainty related to the Th distribution at the microscopic scale in the Lussagnet Ypresian kaolinite leads to a large range of possible EPR ages, the actual age being in the calculated interval 16.1 ± 4.3 – 43.6 ± 12.6 Ma). The older age is in agreement with the stratigraphic period (Ypresian) of sediment deposition. In contrast, the lower age is younger, even considering the inherent error of EPR dating, suggesting a post-depositional growth of kaolinite long after deposition. This is consistent with the petrographic observation that the Lussagnet kaolinite displays two crystal habits (Beaufort et al., 1998): (1) aggregates of very small pseudo-hexagonal particles (less than 1 µm) embedding all the coarser clastic components of the sandstone and considered as detrital in origin; (2) much coarser euhedral kaolinites with vermicular habit considered as authigenic kaolin minerals formed at shallow burial condition as a response to incipient diagenesis. Accordingly, the EPR ages may correspond to the age of a diagenetic process that promoted the crystallization of kaolinite or to a mixing of detrital and diagenetic kaolinite. More generally, the EPR ages of sedimentary clays have a stratigraphic significance when the formation of the clay minerals is approximately syn-sedimentary or, if detrital, the sedimentation occurred soon after its formation and erosion, limiting the contribution of this early formation period on the RID content. The presence of cubic micrometric pyrite grains indicates past diagenetic processes or existence of an active Redox front that could reduce Fe3+ in presence of sulfur and bacteria. This could occur in the water column or in the sediment interface early after deposition but does not demonstrate late rejuvenation of kaolinites in the sedimentary basin due to fluid migrations, although this process is possible. Diagenesis was shown to rejuvenate illites in the North Sea, giving K-Ar ages younger than the stratigraphic units (Meunier, 2005). Results on Lussagnet underline the importance of determining the spatial distribution of Th in addition to that of U, especially when Th concentration is much higher (4.7 ± 0.5 ppm) than that of U (0.5 ± 0.1 ppm). In this case, the resulting ages from different scenarii of Th distribution can differ within an order of magnitude.
5.1.4. The duricrust-embedded kaolinites
The EPR ages obtained for the two samples (JIC and ARIX2) where kaolinite is embedded in Fe-duricrust range from 6.5 ± 1.2 – 9.7 ± 1.8 Ma and 1.3 ± 0.4 – 1.5 ± 0.4 Ma respectively (table 3). For these samples, extreme scenarii of Th distribution are proposed (fig. 10). Some EPR ages are located below the 1/1 line in the case of ARIX2, i.e., they are younger than the embedding oxides and oxyhydroxides, which is unlikely because kaolinites were trapped in Fe pisoliths. It is thus expected that they formed prior to iron oxides and were subsequently protected from further weathering. In the case of JIC, the ages are close to the 1/1 line despite the large uncertainty of the iron oxides ages (fig. 10).
5.2. Specificities of EPR dating
It is reminded that what is dated by EPR is the beginning of RIDs accumulation, which corresponds to the age of formation of the clay except if it experienced a thermal episode responsible for RID partial annealing. U, Th, owing to their valence and ionic radius, are not expected to be hosted in the structure of clays such as those from the kaolinite group. They can rather be hosted in ancillary minerals or adsorbed onto surfaces of clay particles or Fe oxides for which the large affinity of U is well known (Langmuir, 1978; Manceau et al., 1992). No internal or external dose rates (as classically considered in literature) are distinguished as an infinite medium characterizes the studied systems. The dose rate is the same at the scale of the raw sample (some centimeters) and around it, resulting from the deposition of energies of all radiation α, β, γ.
One main uncertainty arises from the potential evolution of the dose rate with time. The dose rate can vary if U or Th experienced mobility, or if the disequilibrium inside their decay chains varied with time. Therefore, the U and Th mapping at the microscopic scale, the potential loss or accumulation of Rn are key steps of the dating protocol because they can lead to significant corrections of dose rate and related EPR ages. In particular, the Th distribution deserves investigations because this element is often more abundant than U. It is not expected to be transported over distances exceeding the local space (except in case of particle translocation), because its carriers (zircon, monazite, or Th oxides) are very insoluble. The mobility of U, Th may require proposing possible models such as early or linear evolution (Appendix 1), provided that the parent rock can be analyzed. This condition is not always fulfilled such as, e.g., for tropical weathering profiles where the contact with the parent rock can be very deep (sometimes deeper than 100 m) and often out of reach.
The error on the EPR age, i.e., 20–30%, is larger than that of other dating methods of secondary minerals such as 40K-40Ar, 40Ar-39Ar or (U-Th)/He mainly because of the uncertainties on the paleodose. For instance, as the RID concentration has an error of ± 10% (2σ), the paleodose resulting from the dosimetry curve is most often characterized by a 10–20% error (1σ), as assessed by the Monte Carlo calculation of the dosimetry parameters.
Except for illite that can be dated by 40K derived methods, this study also underlines the difficulty of finding clay minerals with ages determined using other independent methods. The embedding by Fe duricrusts is a possible way if they are well constrained by (U-Th)/He dating such as for homogeneous structures. For duricrust with unconnected porosity or pisolitic systems, the age of the indurated Fe material then represents a minimum age for kaolinite formation. Sediments may be well defined through stratigraphic correlation, provided that diagenesis-driven maturation, if any, occurred soon after deposition or, in case of detrital particles, a dominant part of the paleodose was experienced in the sediment.
In the case of a weathering profile in which sequential stages of clay crystallization occurred with full replacement of the previous ones, the age recorded is the one of the last episode of clay crystallization and not that of the profile. In addition, the original sample from which the clay mineral is purified for the dating exercise is macroscopic (typically up to around 10 g of raw sample), so it may contain several juxtaposed generations, owing to their finely divided nature. Several successive geochemical processes leading to partial dissolution and subsequent reprecipitation of kaolinites may occur, as seen for rejuvenation in lateritic profiles (Ansart et al., 2025; Balan et al., 2005; Mathian et al., 2020). In this case, the age measured by EPR represents the average age of crystallization of different kaolinite generations.
6. Conclusion
A major result of the present study is the benchmarking of the EPR-based method of dating clay minerals, which can be used to extensively bring time milestones in the evolution of geosystems between Quaternary period and Proterozoic era. The EPR age corresponds to the duration of radiation-induced defect accumulation in the clay structure. In environments that did not experience past thermal episodes, such as weathering profiles, this method directly yields the age of formation of the clay minerals. Otherwise, information on the thermal evolution of the geosystem is required to interpret the age.
The method presented herein thus relies on a multistep protocol that requires additional discussion of ages based upon constraints on the conditions of formation of the clay minerals. Several corrections of the dose rate are necessary to yield reliable ages. In an infinite medium situation, they include the spatial distributions of U and Th appear as major corrections, owing to the short range of alpha particles. Alpha particles correspond to 90 % of the total dose rate derived from U and Th decay chains in closed systems. They are thus critical to consider both in the correction of dose rate and in the calibration of dose by artificial irradiation. Particularly, in the case where Th concentration overpasses that of U in the Earth’s crust such as for some lateritic profiles (e.g., Ansart et al., 2025; Balan et al., 2005), the radiation of its daughters can be dominant in the dose budget and thus the assessment of its distribution at a microscopic scale appears as uppermost importance, despite some technical difficulties to determine it. When the medium is not infinite in term of dose rate because of a contrasting horizon or level occurring in the range of a 30–40 cm radius sphere around the macroscopic sample, this contribution to the gamma dose rate must be determined. Regardless, this correction may have a limited impact on the calculated age given the usual small weight of the gamma component in the total dose rate experienced by the clay minerals. It was also revealed herein as a negligible correction (Appendix 1).
Ages of clay minerals determined by methods independent from the EPR approach may be difficult to obtain with enough accuracy on a large time range as they often display strong uncertainties or kaolinite may have formed before/after their age, so that the benchmarking of the approach is not a straightforward task. The main physical limitation of the EPR approach identified so far, as exemplified for kaolinite, is the saturation of the RIDs concentration which prevents any dating possibility. This appears scarce but cannot be anticipated without artificial irradiation. So far, despite a relatively large error in age (20–30 %), the use of EPR spectroscopy is the only dating method available for the kaolin group minerals. Even considering this uncertainty, many systems exhibit ages that can be contrasting enough to reveal the timing of mineralogical processes related to diagenesis, hydrothermal alteration or weathering. It mostly concerns low-temperature systems in which the RIDs are stable but could potentially be used in other systems for which the thermal evolution in time can be assessed, as the A or Ai-centers half-life can be extrapolated at various temperatures from thermal annealing data that are already known.
More accurate benchmarking could be achieved through the analysis of kaolinites trapped inside homogeneous and massive Fe duricrusts associated to weathering profiles, or appropriate authigenic sediments that experienced diagenesis soon after deposition.
ACKNOWLEDGMENTS
This study was funded by the recurrent credits of IMPMC supplied by CNRS, Sorbonne Université, MNHN, IRD tutorship. In addition, JS acknowledges financial support from the Polish National Science Centre MAESTRO grant 2013/10/A/ST10/00050. Paweł Ziemiański is thanked for the Meta-1 porosity measurement. We are sincerely grateful for the valuable and constructive comments and suggestions from our reviewers and associate editor, which have significantly improved the quality of this manuscript. We thank the ARAMIS particle accelerator team at Orsay, France, for He+ irradiations of the clay minerals. We acknowledge assistance from the staff of the NANOSCOPIUM beamline at SOLEIL synchrotron facility (Saclay, France). We thank M. Parra for his help to access the IPEN reactor (Brazil). This work is dedicated to Jean-Pierre Muller (demised, August 25th, 2015) who, with Georges Calas and Philippe Ildefonse (demised, October 26th, 1999), initiated the use of paramagnetic RIDs in kaolinite to discuss the geochemistry of uranium.
AUTHOR CONTRIBUTIONS
Allard T.: principal investigator, conceptualization, analyses with EPR and synchrotron XRF (1 & 2 sessions), fission tracks counting on Meta-1, JIC and ARIX2, manuscript writing.
Ataytür Ö.: participation to XRF synchrotron session 2.
Balan E.: participation to XRF synchrotron sessions 1 & 2, and manuscript writing.
Bollaert Q.: participation to XRF synchrotron session 1 and to manuscript writing.
Boukhais I.: fission tracks counting on 43031 illite.
Bourbon E.: participation to XRF synchrotron session 2.
Chassé M.: participation to XRF synchrotron session 1 and to manuscript writing.
Dubacq B. : adaptation of Matlab codes used for dosimetry fitting and calculation of errors on Paleodose.
Falguères C.: gamma spectrometry.
Gautheron C.: published (U-Th)/He dating of duricrusts, participation to manuscript writing.
Genezini F.: neutron irradiation at IPEN (Brazil) and participation to manuscript writing.
Heller B.: participation to XRF synchrotron session 1 and to manuscript writing.
Le Pape P.: participation to XRF synchrotron sessions 1 and 2 and to manuscript writing.
Mathian M.: EPR study and fission tracks counting on Lussagnet sample and to the writing of the Matlab codes for dosimetry, participation to manuscript writing.
Messias R.: participation to XRF synchrotron session 2.
Monié P.: 40Ar/39Ar analysis of the Proterozoic illite, participation to manuscript writing.
Riegler T.: knowledge of the Thelon sample and participation to the writing about this sample.
Selo M.: advice for fission track experiments.
Somogyi A.: head of the NANOSCOPIUM beam line, SOLEIL synchrotron facility, France, participation to manuscript writing.
Środoń J.: supply of the Proterozoic kaolinites, participation to manuscript writing.
Beaufort D.: supply of the Thelon and Lussagnet samples, discussion of related geological implications, participation to manuscript writing.
DATA AND SUPPLEMENTARY INFORMATION
https://doi.org/10.17632/j7htyjdst4.1
SI-1: Total EPR spectra of Proterozoic kaolinites. (# samples used for dating) normalized according to gain, mass of sample and a constant filling factor of the cavity. The amplitude of the 4529-4 (> 2 µm) spectrum is multiplied by 0.5 to match with the plot size.
SI-2: Saturation curve of the A-center signal amplitude at room temperature as a function of square root of microwave power for two reference samples: GB1 hydrothermal kaolinite from St Austell, United Kingdom (Allard et al., 1994) and PDP3 sedimentary kaolinite from the Charentes Basin, France (Delineau et al., 1994). Amplitude is normalized to the maximum one. The dotted line is a graphical representation of the linear part of the curve.
SI-3: Simplified correction of the baseline in the RID region of the EPR spectrum. Example of the RID spectra of the JIC natural and irradiated samples for which the baseline offset is the strongest among the studied sample series. The baseline is taken as a straight line anchored on each side of the RID spectrum and the correction is made at the position of the perpendicular component of the RID signal.
SI-4: Central VO2+ (vanadyl) signal in Nowa Ruda kaolinite group clay (Premović et al., 2012). Its occurrence is revealed in the natural samples ARIX2 and Lussagnet.
SI-5: Matlab codes for (i) fitting growth curves and (ii) Monte Carlo calculation of the error on Paleodose (Dubacq et al., 2012; Mathian M.)
SI-6: Errors on concentrations of U, Th, K. All samples measured by ICP-MS from dissolved samples except META-1 and 4925-4 samples that were analyzed by LA-ICP-MS.
SI-7: Results of gamma spectrometry on raw samples. Activities are expressed in disintegrations per minute (dpm).
SI-8: X-ray fluorescence spectra in the Th region for Meta-1 and Lussagnet samples. Energy is in keV. In Meta-1 spectrum the Th contribution in zircon is isolated and can thus be reliably measured. In Lussagnet spectrum the Pb and Rb peaks strongly interfere with the minor Th peak, thus Th contribution could not be reliably determined from the selected Region of interest. The fit is in red and the experimental spectrum in blue (Meta-1) or black (Lussagnet).
Data availability statement: data are available on request to the corresponding author.
Editor: C. Page Chamberlain, Associate Editor: Kalin McDannell

