**_map_showing_the_main_litholog.tif)
_and_chemical_zoning_profile_(**d--g**)_in_garnets._the_position_and_.tiff)
**_*pt*_pseudosection_constructed_for_the_sem-measured_bulk_composition_of_the_sample.tiff)
**_*pt*_pseudosection_constructed_for_the_sem-measured_bulk_composition_of_the_sampl.tiff)
**_*pt*_pseudosection_constructed_for_the_calculated_composition_of_d241_accounting_.tiff)
**_*pt*_pseudosection_constructed_with_the_sem-measured_bulk_composition_of_the_samp.tiff)
**_*pt*_pseudosection_constructed_for_the_calculated_initial_composition_of_k263_est.tiff)
pb_geochronology_of_monazite._terra-wasserburg_plots_of_monazite_upb_data_for_**(.tif)
**_included_in_garnet__**(b)**_.tiff)
**_y269b__**(b)**_y261a__**(.tif)
1. INTRODUCTION
Understanding how metamorphic facies across an orogen, or part of it, relates to the past tectonic history is fundamental for the application of metamorphic petrology to the study of tectonic processes (Miyashiro, 1961). Metamorphic facies series, also called field metamorphic gradients, correlate with the temperature peaks experienced by rocks from a crustal section (Spear et al., 1984). Skrzypek et al. (2016) pointed out that field metamorphic gradients are composite and diachronous features. Consequently, approaches integrating structural studies and recent developments in petrochronology represent an opportunity to decipher the significance of metamorphic gradients in terms of tectonic processes.
Among the facies series observed in nature, the Barrovian mineral sequence is defined in metapelites by the successive appearance of chlorite, biotite, garnet, staurolite, kyanite, and sillimanite (Barrow, 1893). This sequence develops in crustal rocks undergoing metamorphism in the range 75–185 °C/kbar (Jamieson et al., 1998). Following the emergence of thermal-mechanical models of crustal thickening (e.g., England & Thompson, 1984; Vanderhaeghe, 2012), it was considered the metamorphic hallmark of thermal maturation during continent-continent collision. However, the Barrovian sequence results from dehydration reactions characterised by steep Clausius-Clapeyron slopes, consequently, its development is controlled by variations of temperature. In agreement, a review by Ryan and Dewey (2019) about tectonic settings accounting for the Barrovian metamorphism shows that the production, addition, and redistribution of heat in the middle- to lower-crust count among the main factors controlling the development of this type of metamorphism. Consequently, the Barrovian sequence is, in fact, not tied to a single tectonic environment and was indeed reported from tectonic settings as varied as convergent collisional (e.g., Himalayas: Kohn, 2014; Le Fort, 1975; Alps: Tagliaferri et al., 2023; Variscides: Burg et al., 1984; Štípská et al., 2015, 2020) and accretionary orogens (e.g., Superior Province: Pan & Fleet, 1999; Altai orogen: Aguilar et al., 2024; Jiang et al., 2019), or even domains undergoing extension (e.g., Štípská et al., 2023; Viete et al., 2010).
Barrovian metamorphism is widely reported in the Altai accretionary orogen (among many others: Jiang et al., 2015; Kozakov et al., 2011; Soejono et al., 2021; Sukhorukov et al., 2016; Wei et al., 2007), but the potential heat source(s) accounting for this metamorphism remain(s) largely overlooked. Yet it is an important question because the protolith of metasediments is dominated by immature greywacke (e.g., Buriánek et al., 2022), moderately depleted in K, Th and U compared to the average upper continental crust (Jiang et al., 2016), while numerical models require exceptional distribution and concentration of heat producing material for significant radiogenic heating to occur (Jamieson et al., 1998). Previous studies have focused on the relationships between magmatism and Buchan-type events (e.g., Burenjargal et al., 2014; Jiang et al., 2010). On the other hand, it is commonly accepted that the Barrovian metamorphism occurred during gaps in the magmatic record (Buriánek et al., 2022). In a petrological and geochronological study of the area of Tseel, Burenjargal et al. (2014) argued that Barrovian-type garnet-staurolite assemblages were overprinted by cordierite and sillimanite during the emplacement of granitoids. In this study, the Barrovian event is referred to as a “high-P and low-T metamorphism”. While this makes the comparison with the subsequent lower-pressure and higher-temperature event efficient, it effectively excludes any discussion about potential heat sources for the Barrovian event. Alternatively, a recent study reported the discovery of late-Ordovician (ca. 455–445 Ma) igneous rocks intruding the AAW (Hanžl et al., 2024) and proposed a correlation with a late Ordovician (ca. 455 Ma) Barrovian metamorphism reported previously (Burenjargal et al., 2014; Soejono et al., 2021), but this hypothesis remains to be proven.
Another important question to be addressed is the tectonic setting and age(s) of the Barrovian metamorphism. Indeed, while Barrovian events are comprehended as relatively cold events intervening higher-temperature ones, garnet-staurolite-kyanite assemblages are commonly geographically associated with migmatite domes (e.g., Jiang et al., 2015; Sukhbaatar et al., 2022; Sukhorukov et al., 2016; Wei et al., 2007). Because staurolite and kyanite occur in the migmatite as xenomorphic relics, they are considered a record of the late Ordovician to Silurian metamorphism, which precedes the dome formation by tens of Myrs (e.g., Jiang et al., 2019, 2022). However, structural studies show that staurolite- and kyanite-bearing foliations in the metamorphic envelopes of the domes progressively grade into the migmatitic foliations in the cores of the domes (Kong et al., 2022; Sukhbaatar et al., 2022) and thus cast doubts about the timing and tectonics of the Barrovian metamorphism. Moreover, in both studies, the migmatitic foliation is interpreted as a result of extensional tectonics. Finally, further complexity regards the age of the domes, dated as Devonian (Kong et al., 2022, 2023) or Permian (Sukhbaatar et al., 2022). Consequently, it is essential to link the structures with the metamorphic minerals and to date the Barrovian assemblages from the dome envelopes in-context, directly in thin sections, to determine whether they are older or genetically related to the formation of the domes.
To this end, we re-examined a metamorphic sequence in the Gobi Altai grading from Barrovian schist to migmatite. We paid specific attention to the relative timing of structures, magmatism, and metamorphism. To do so, we combined field and structural data with metamorphic petrology, thermodynamic modeling, monazite U-Pb geochronology of metamorphic rocks, and zircon U-Pb of magmatic ones. The results distinguish three metamorphic events dated to the late Devonian, early Carboniferous, and Permian. The data suggest that the Barrovian-type metamorphism was genetically related to a short-lived magmatic event affecting an extensional shear zone during the formation of a Permian migmatite dome.
2. GEOLOGICAL SETTING
2.1. Geology of the Central Asian Orogenic Belt
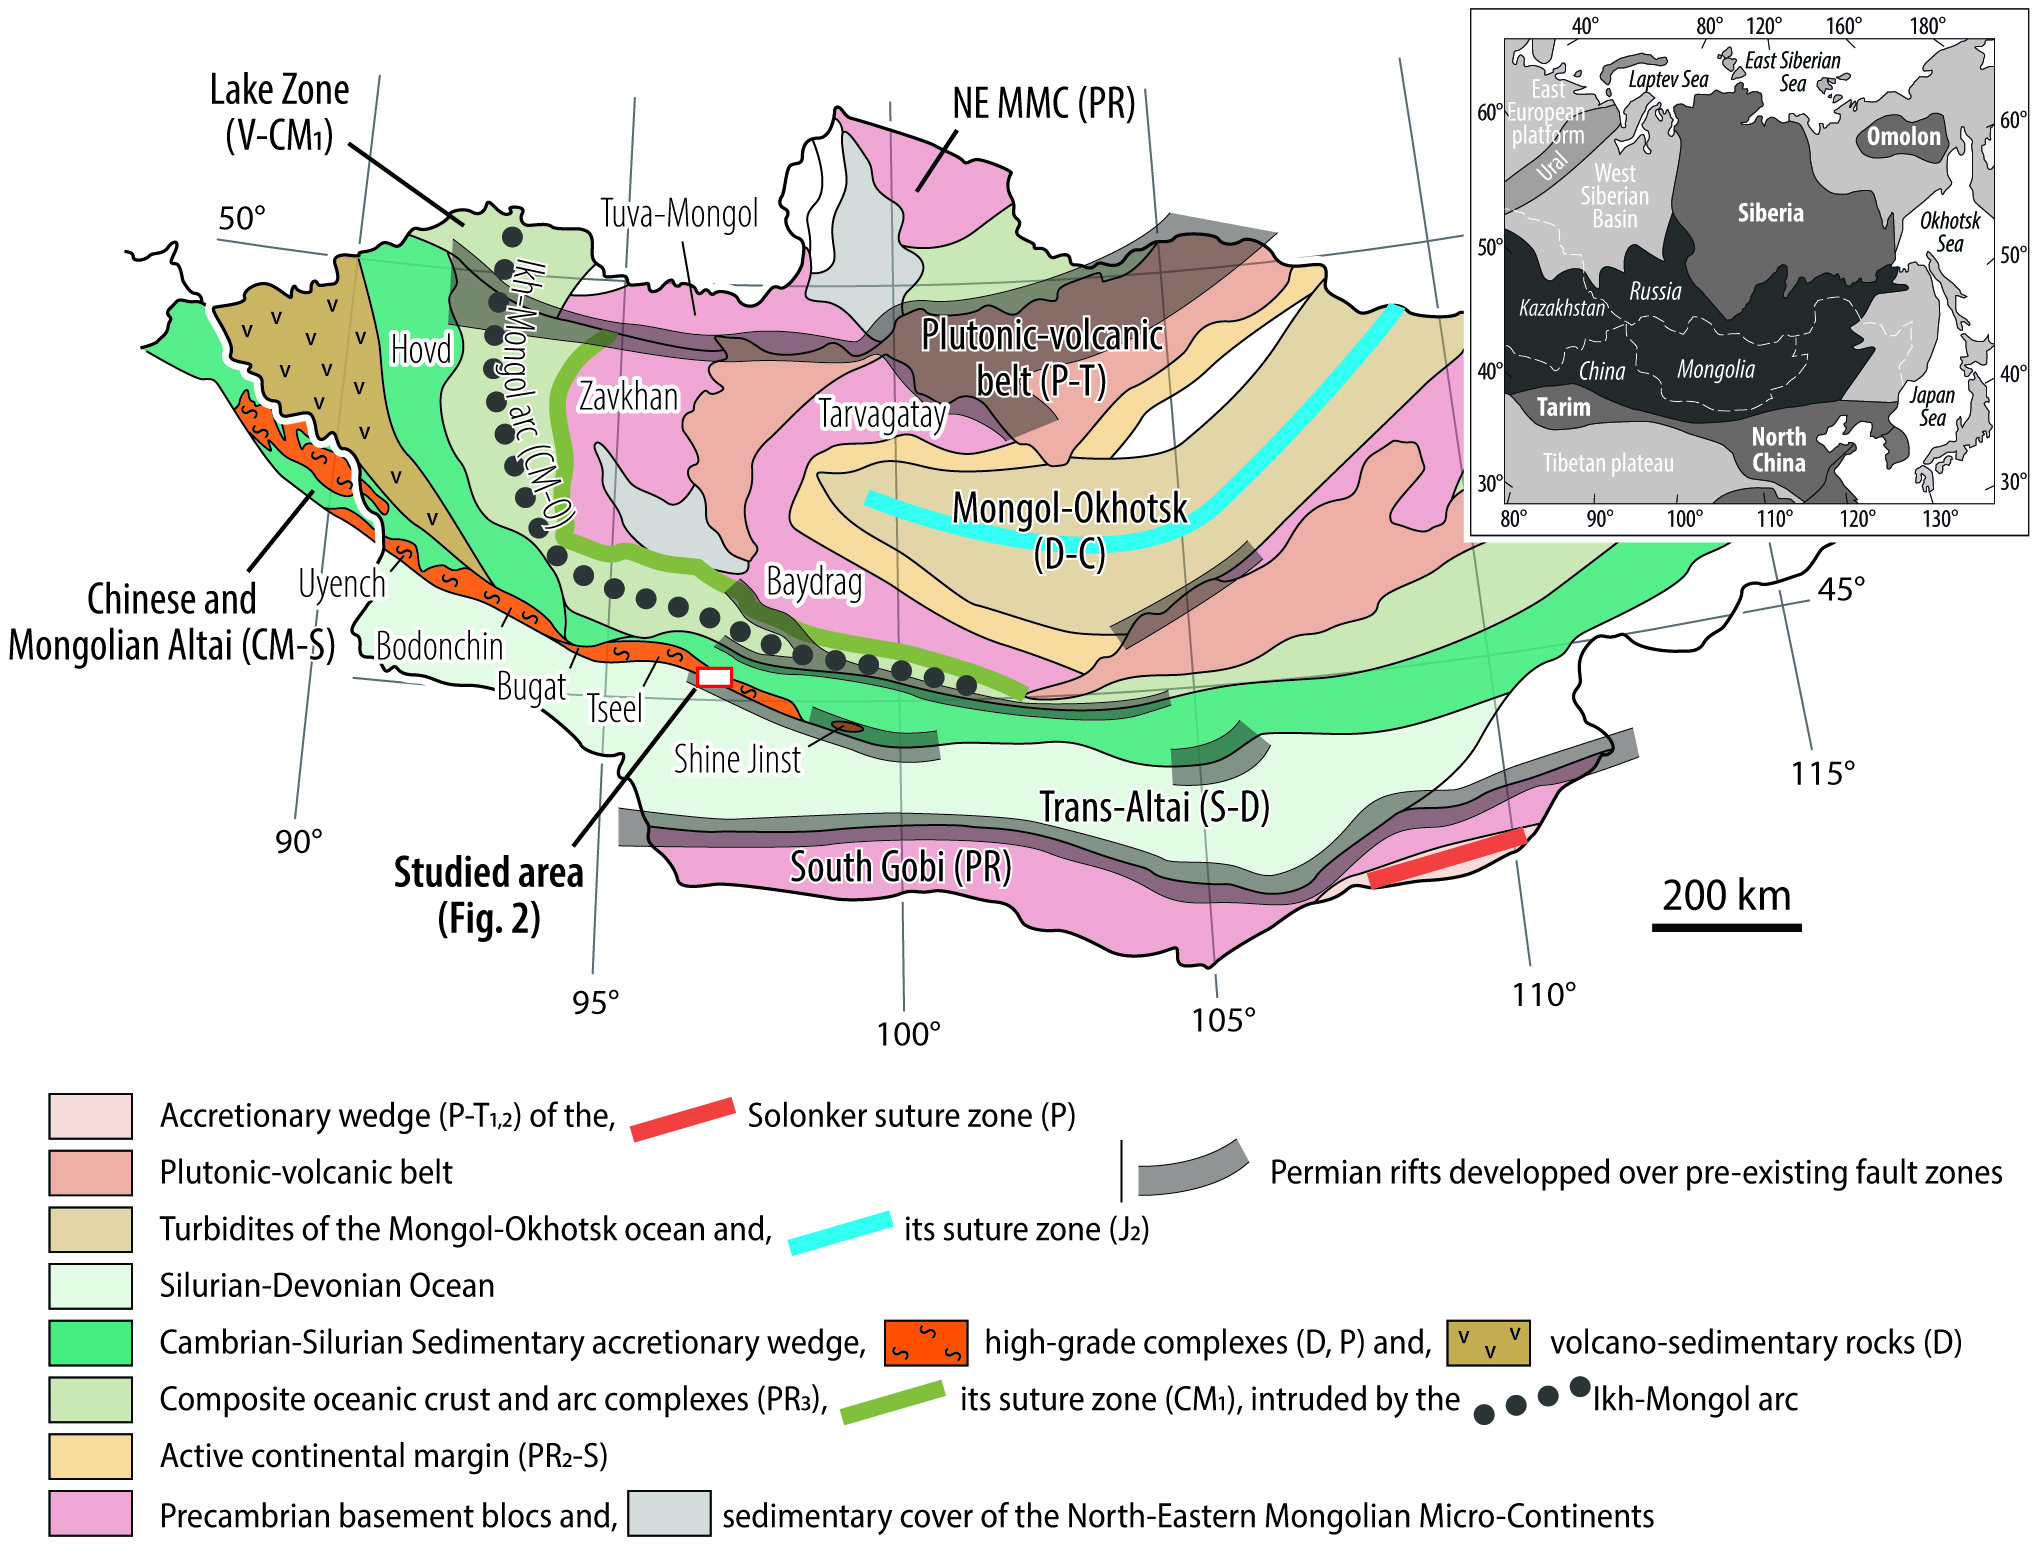
The Central Asian Orogenic Belt (CAOB) is a vast late Proterozoic to Mesozoic accretionary orogen developed between the Baltica, Siberia, Tarim, and Sino-Korean cratons (e.g., Wilhem et al., 2012; Windley et al., 2007). In the Mongolian portion of the CAOB, the Mongolian Altai intervenes the Lake and Trans-Altai zones (fig. 1). The Lake zone is a composite unit of Neoproterozoic oceanic crust and arc complexes (e.g., Jian et al., 2014; Kepezhinskas et al., 1991; Khukhuudei et al., 2020) imbricated with Precambrian basement blocks (e.g., Buriánek et al., 2017; Štípská et al., 2010). The Trans-Altai Zone is dominantly an oceanic succession (e.g., Badarch et al., 2002) including Silurian deep marine to Devonian and early Carboniferous shallow water volcanic and sedimentary sequences (Hanžl et al., 2023; Lamb & Badarch, 1997; Nguyen et al., 2018).
2.2. Geology of the Mongolian Altai
The Mongolian Altai exposes northern low- to medium-grade and southern high-grade metasedimentary units (Badarch et al., 2002). Similar U-Pb age patterns and Hf isotopic compositions of zircons from both units indicate a common origin of the sedimentary sequences (e.g., Jiang et al., 2011, 2017). The main constituent is a late Cambrian to late Ordovician – early Silurian immature sediment mixed with volcanogenic material (Buriánek et al., 2022). The whole package is interpreted as the erosion product of the Cambrian-Ordovician Ikh-Mongol Arc (sensu Janoušek et al., 2018) and its Precambrian basement, deposited in a fore-arc basin and referred to as the Altai Accretionary Wedge (AAW; Jiang et al., 2017; Soejono et al., 2017).
Metamorphism of the AAW grades from greenschist to amphibolite facies (Burenjargal et al., 2014; Jiang et al., 2012; Kozakov et al., 2009; Nakano et al., 2015) with local granulite (Kozakov, 2002). The dominant metamorphic field gradient involves chlorite, biotite, garnet, staurolite, kyanite, and sillimanite-migmatite zones and defines a Barrovian-type metamorphic sequence (Jiang et al., 2015; Kozakov et al., 2011, 2019). Minerals of the Buchan-type metamorphism, cordierite, andalusite, and sillimanite are also widespread in migmatite and paragneiss (Broussolle et al., 2015; Burenjargal et al., 2014; Jiang et al., 2015; Nakano et al., 2014). Overprint relationships are common, and the relative chronology is debated (e.g., Burenjargal et al., 2012; Sukhorukov et al., 2016). Yet, a review of available geochronological data from metamorphic rocks points to a polycyclic metamorphism ultimately controlled by the retreating and advancing mode of the subducting slab (Aguilar et al., 2024).
A first late Ordovician Barrovian metamorphism (Soejono et al., 2021) results from thickening of the sedimentary wedge (Buriánek et al., 2022). It coincides with the emplacement of minor late Ordovician granitoids in the Gobi Altai (ca. 445 Ma; Hanžl et al., 2024).
The main thermal event occurred in the Devonian, when sillimanite-migmatite (Jiang et al., 2012) and two-pyroxene granulites (e.g., Kozakov, 2002) are temporally associated with abundant mafic intrusions (Bibikova, 1992; Kozakov et al., 2019) and large granitic plutons (Burenjargal et al., 2012; Cai et al., 2015; Soejono et al., 2016). The sedimentary record varies laterally from marine proximal conglomerate and sandstone (Gibson et al., 2013) to distal marine flysch-type sediments associated with abundant mafic volcanism (Soejono et al., 2018). This event, favoured by lithospheric thinning, turned the accretionary wedge into a typical, vertically stratified continental crust (de Hoÿm de Marien et al., 2025; Hanžl et al., 2016; Jiang et al., 2016).
Late Devonian to early Carboniferous times are related to a slowdown of the magmatic activity (Buriánek et al., 2022). Petrological studies in the southern high-grade unit document isothermal pressure increase (Sukhorukov et al., 2016) and anticlockwise P–T paths (Nakano et al., 2015). In the northern unit, upright folding of the Devonian subhorizontal foliation points to the compressional nature of the Carboniferous event (Broussolle et al., 2015; Lehmann et al., 2017).
Permian times correspond to another major thermal event. It is documented by metamorphic ages from gneiss (Burenjargal et al., 2014; Nakano et al., 2014, 2015) and migmatite (Kröner et al., 2010). Supracrustal continental rifts (Buriánek et al., 2012; Hanžl & Aichler, 2007; Kröner et al., 2010) and migmatite domes in the high-grade domains (Lexa et al., 2025; Sukhbaatar et al., 2022) indicate an extensional setting. This extension was not limited to the Mongolian Altai as rift zones are superposed over most previous terrane boundaries in Mongolia (fig. 1; Kovalenko & Chernov, 2008). A summary of the data from magmatic rocks by Kozlovsky et al. (2015) further confirms the scale of the event, documented by widespread alkaline granite plutons and bimodal volcanics everywhere in the CAOB. Yet, the Permian tectonics is not well understood. On the one hand, the scale of the magmatism suggests a relation with the distant Tarim plume or to post-accretionary slab break-off (Kozlovsky et al., 2015). On the other hand, geochemical studies of magmatic rocks from the Trans-Altai zone identified magmatic affinities typical of supra-subduction settings, characteristic of accretionary orogens (Hanžl et al., 2023).
Finally, a late Permian to Triassic N-S compressional event produced km-scale WNW-ESE trending upright folds and cleavage fronts reworking all the previous structures (Broussolle et al., 2019; Jiang et al., 2015; Lehmann et al., 2010; Sukhbaatar et al., 2022).
2.3. Field geology and sampling strategy
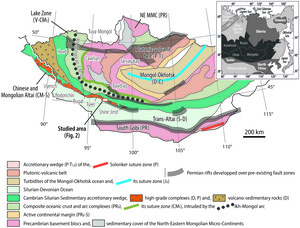
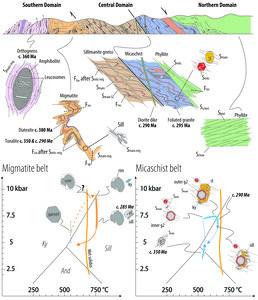
The studied section (fig. 1) follows the valley of the Gegetin-Gol River (fig. 2). Three domains distinguished by increasing metamorphic grade and abundance of magmatic rocks (fig. 2A) occur from north to south: the Northern Domain consists of low-grade metasediments (fig. 3A), the Central Domain of medium-grade metasediments intruded by abundant granitoid and minor diorite dikes (figs. 3C and 4A), and the Southern Domain of migmatites with abundant felsic and mafic metaigneous rocks (fig. 5A and E). The section is bounded to the south by the Trans-Altai shear zone.
**_map_showing_the_main_litholog.tif)
**_sedimentary_bedding_and_cle.jpeg)
**_outcrop_view_of_the_abundant_gran.jpeg)
**_folded_lithological_layering_marked_by_migma.jpeg)
The Northern Domain is dominantly composed of low-grade clastic sediments with beds of limestones, tuffs, and rhyolites. Zircon U-Pb data from a siltstone (460 Ma; Kröner et al., 2010) intruded by late Ordovician granitoids (ca. 455–445 Ma; Hanžl et al., 2024) constrain the sediment deposition to the Ordovician. The original sedimentary bedding is defined by a subhorizontal compositional layering (Sbed; fig. 3A). A spaced cleavage has a gentle and variable dip (Scleav). To the south, a penetrative schistosity (Sschist) appears. It is folded by asymmetric folds with horizontal axes and axial planes gently dipping to the north (Frec; fig. 3B). Further south, a sharp transition (~ 1 km) from phyllite to micaschist is marked by a grain-size increase.
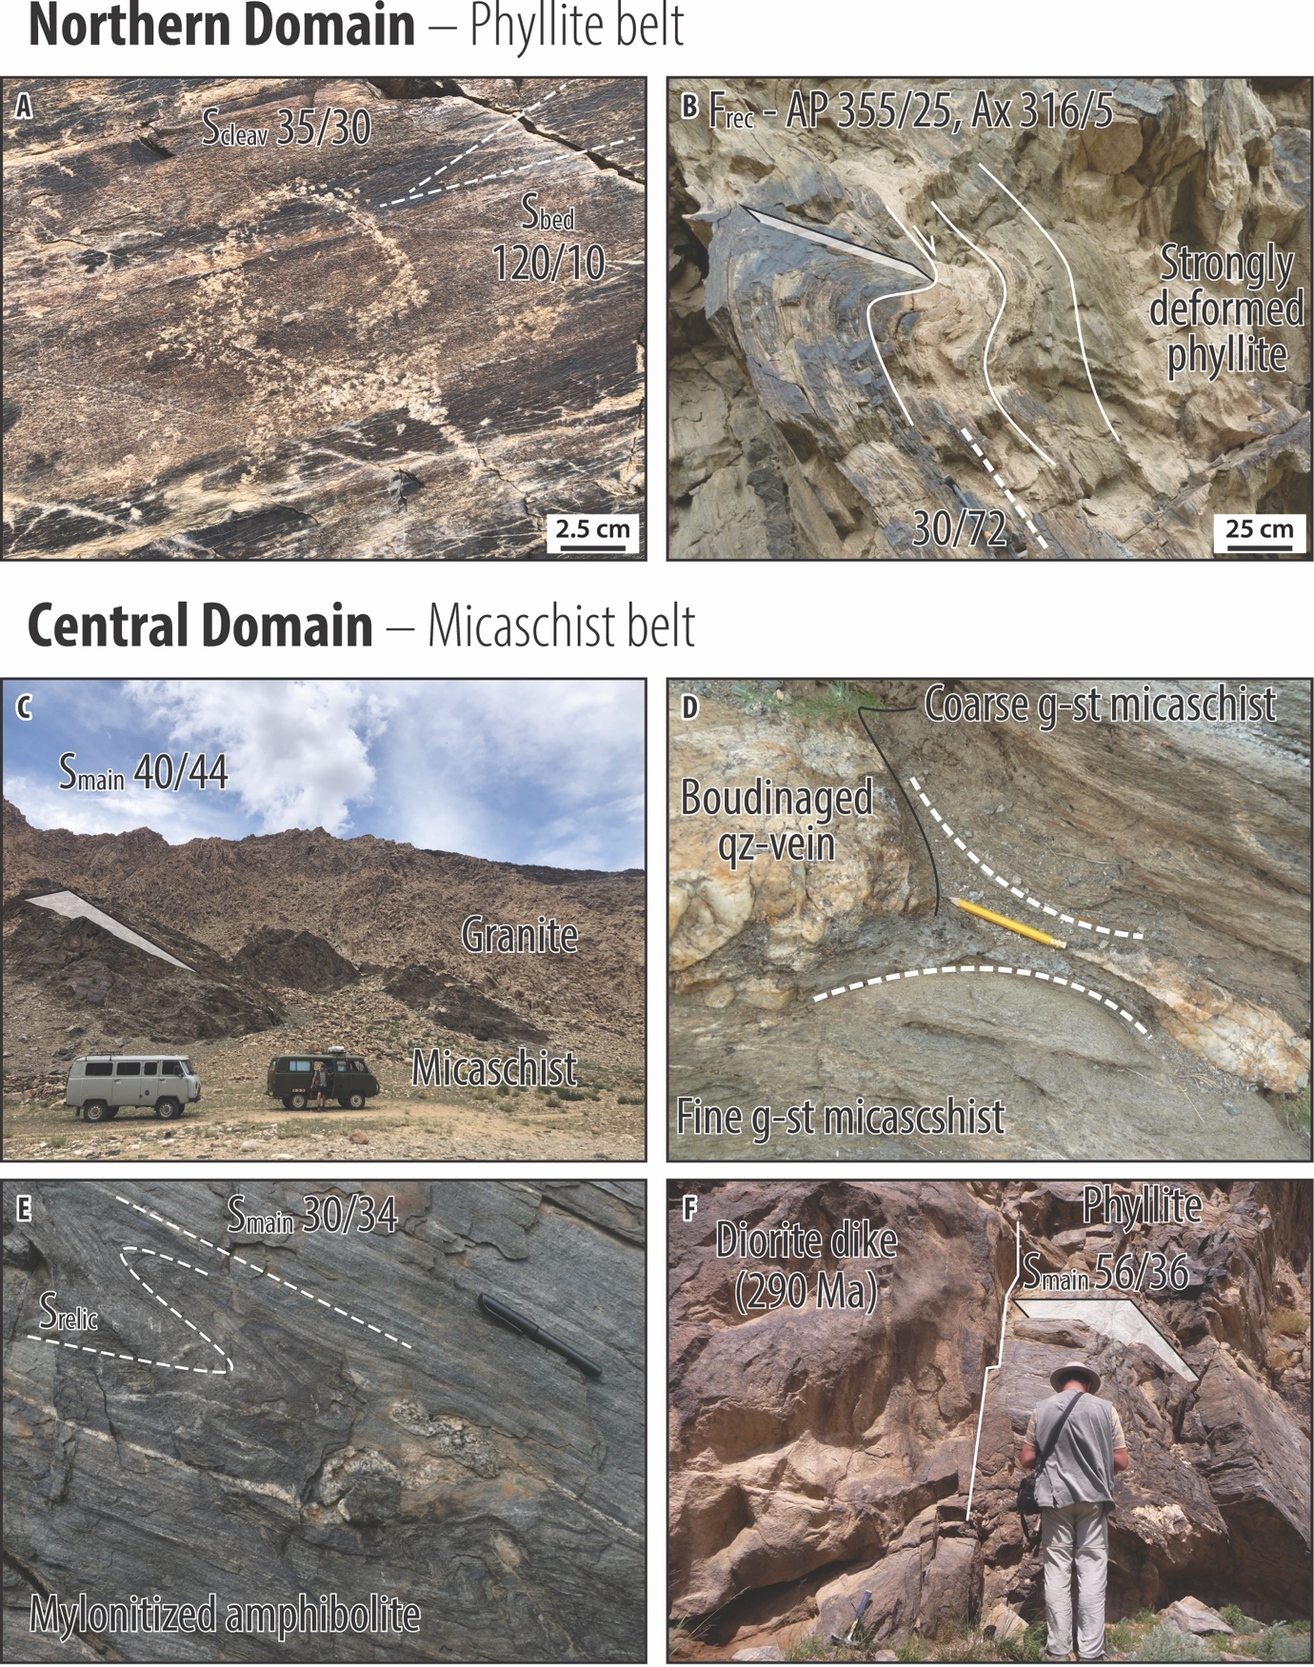
The Central Domain is composed of micaschist and gneiss with amphibolite boudins and variably deformed granitoid and diorite dikes. In detail, a belt of micaschist and another of sillimanite-gneiss occur in the north and south, respectively. The contacts between the micaschist and intrusive granitoid sills (fig. 3C) are moderately dipping to the NE, parallel with the macroscopic schistosity (Smain). Relics of an older foliation are not observed in the micaschist, but low-strain domains in competent amphibolite display isoclinal folds (Fiso; fig. 3E) of an earlier fabric (Srelic). A strong grain-size reduction in the amphibolite (Smain-SZ) results in total transposition of the older foliation into a new mylonitic foliation (fig. 3E). Zircon U–Pb data from a foliated granite indicate that the deformation is younger than ca. 295 Ma (Kröner et al., 2010). The main foliation is locally crosscut by undeformed diorite dikes (fig. 3F).
In the micaschist, three metamorphic stages were distinguished (Sukhorukov et al., 2016). An initial LP-HT stage at ca. 550–575 °C, 3–4 kbar, was followed by a MP-MT event at ca. 540–575 °C, 6–8 kbar and a nearly isobaric increase of temperature to ca. 575–615 °C, 6–7.5 kbar. Based on microstructures, the same study concluded that staurolite related to the isobaric heating was post-tectonic. Our observations show that garnet and staurolite are typically mm-sized, and coarser cm-sized crystals occur in neck zones of boudinaged quartz-veins (fig. 3D), suggesting rather syn-tectonic growth with SMain.
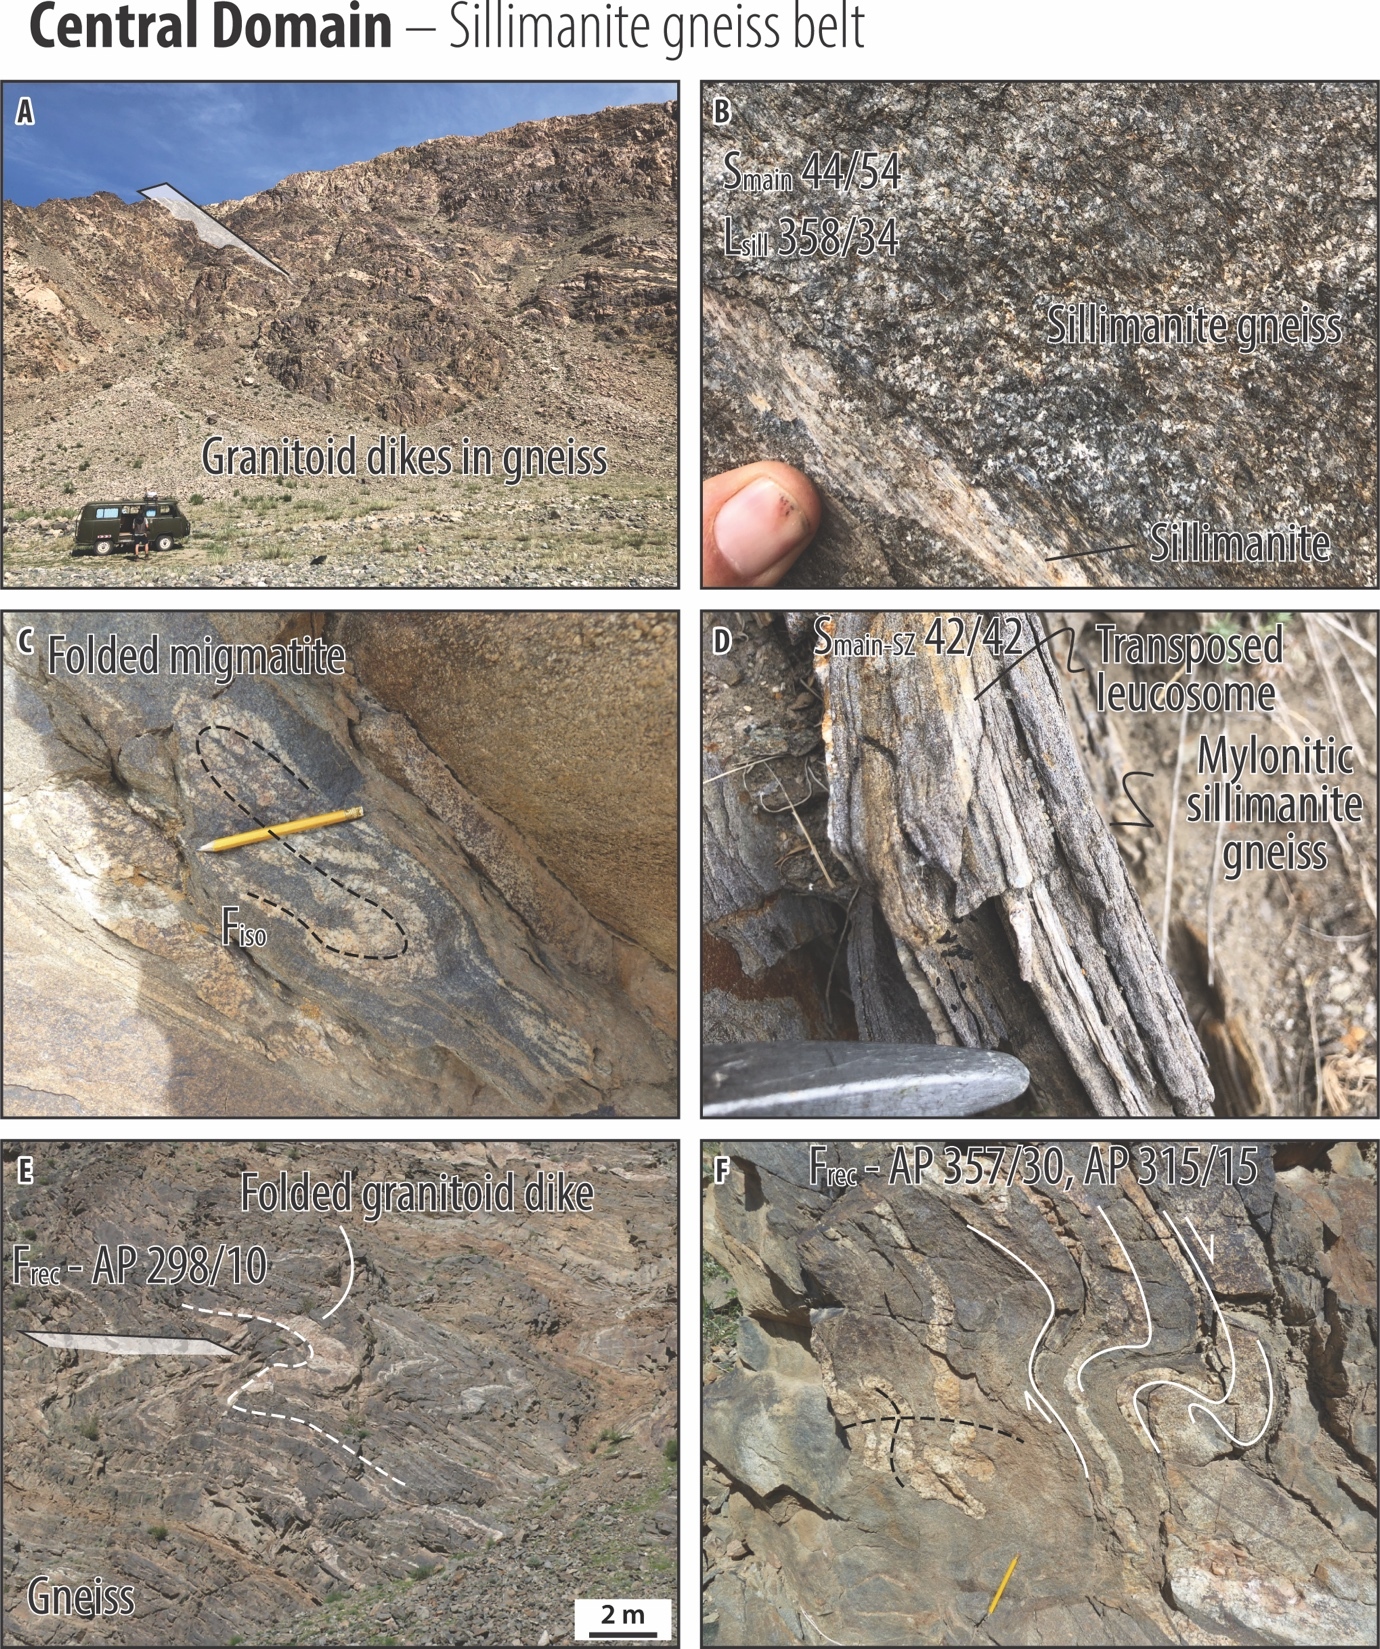
Further south occurs a sillimanite-gneiss (fig. 4B) containing folded leucosomes (Srelic-mig; fig. 4A) and layer-parallel granite sills (fig. 4C). Fine-grained sillimanite gneiss displays a rhythmic alternation of felsic and biotite-rich layers (Smain-SZ; fig. 4D). Abundant granitoid dikes are mostly parallel with the foliation (Smain) and locally crosscut the foliation. In some places the dikes are affected by recumbent folds (Frec) within the foliation. The folds are strongly asymmetric and display subhorizontal hinges associated with subhorizontal to NE dipping axial planes (fig. 4E and F).
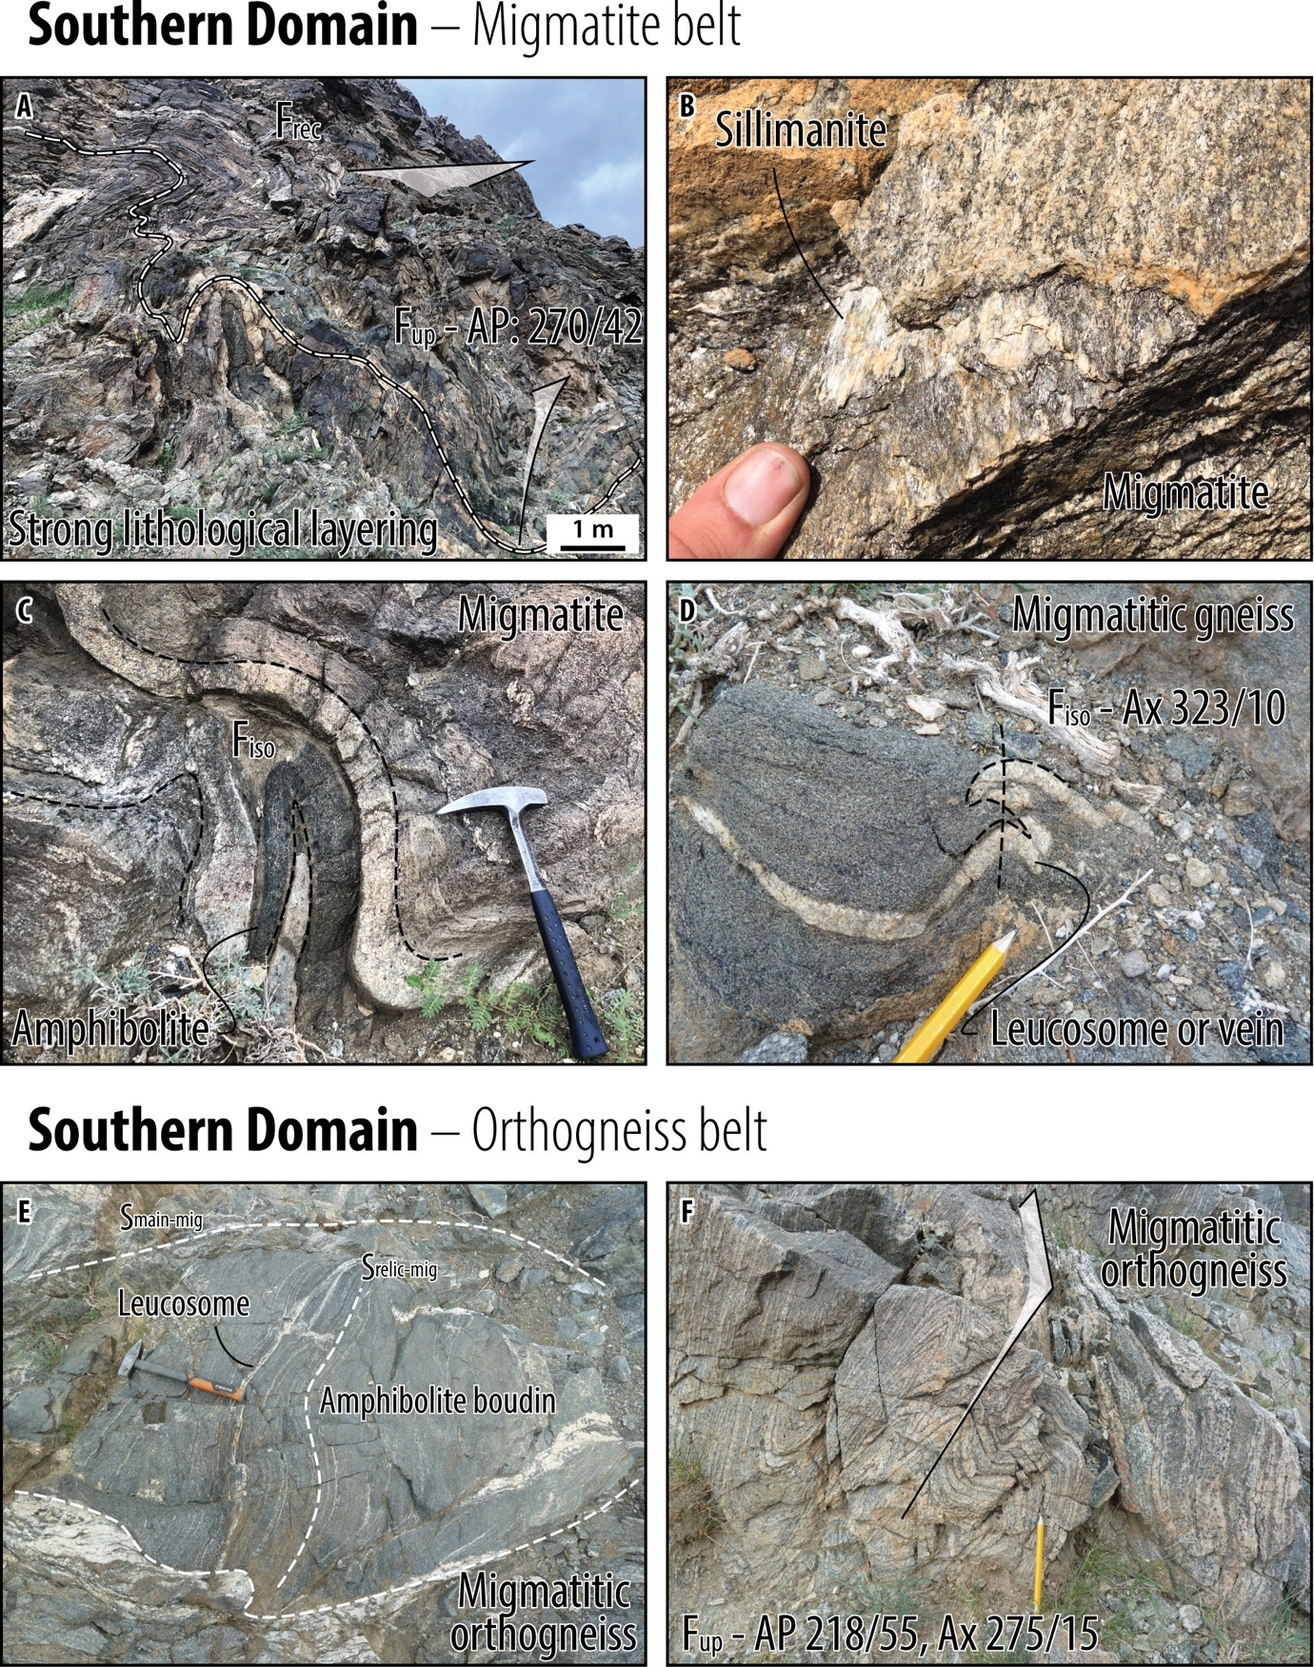
The Southern Domain is dominated by biotite-rich stromatic and nebulitic migmatites in the north (migmatite belt) and migmatitic orthogneiss (orthogneiss belt) in the south (fig. 2). Alternation of stromatic migmatite, nebulitic migmatite, amphibolite, orthogneiss and granitoid sills define a prominent lithological layering (fig. 5A). Sillimanite and garnet are common in stromatic migmatite (fig. 5B). The migmatitic foliation defined by an alternation of leucosome and mesosome (Smain-mig) is parallel with the lithological layering. The migmatitic fabric contains intrafolial isoclinal folds (Fiso-mig; fig. 5C and D) and is affected by two sets of later folds (Fup and Frec; fig. 5A).
The orthogneiss belt is composed of mesocratic meta-granitoid associated with abundant amphibolite boudins. A migmatitic foliation (Srelic-mig; fig. 5E) is preserved in the amphibolite boudins. Srelic-mig is oriented at high angle with the main foliation of the host migmatitic orthogneiss (Smain-mig; fig. 5E). The main fabric is folded by upright folds with steeply inclined axial planes and subhorizontal axes (Fup; fig. 5F). Zircon from a partially molten tonalite gneiss (ca. 385 Ma, U–Pb LA-ICP-MS; Kozakov et al., 2023) and from a granitic orthogneiss (ca. 360 Ma, Pb-Pb evaporation; Helo et al., 2006) document a Devonian thermal event. Another Permian thermal event is indicated by ca. 290 Ma zircon ages from a granodiorite (Pb-Pb evaporation; Helo et al., 2006) and a foliated diorite (SHRIMP U-Pb; Kröner et al., 2010).
We gathered metamorphic and magmatic samples from the micaschist belt of the Central Domain and the migmatite belt of the Southern Domain (fig. 2). In the Central Domain, a garnet-staurolite and a garnet-staurolite-kyanite micaschists L267B and D241C were sampled to constrain the metamorphic P–T–t evolution. An undeformed diorite dike (Y269B) cutting across all the structures was taken to approximate the upper age limit of SMain. In the Southern Domain, two garnet-kyanite-sillimanite migmatite samples, K263 and Y261B, a nebulitic migmatite (Y261A), and a tonalite sill (Y259) defining the main lithological layering were sampled for U-Pb monazite and zircon dating to document the age(s) of thermal events in the migmatite belt. The garnet-kyanite-sillimanite migmatite (K263) was selected for further petrological investigation to determine the P–T evolution of this domain.
3. METHODS
3.1. Mineral chemistry
Mineral analyses and compositional maps of garnet were performed with a Jeol JXA-8530F field emission gun Electron Probe MicroAnalyzer (EPMA) at the Institute of Petrology and Structural Geology of Charles University in Prague (Czech Republic). Quantitative analyses were performed with 15 kV accelerating voltage and 20 nA beam current, with 1 µm beam, except for feldspars and micas, which were analyzed with a beam defocused to 5 µm. Kα lines of the characteristic X-rays were used for the detection of all the elements except for Ba and Y, which were detected on Lα lines. A ZAF correction method was used for the correction of the matrix effects. Chemical maps of garnet were made at 15 kV, 70 nA, and 40 ms per pixel. Al2SiO5 polymorphs were discriminated at Charles University using the Electron Back Scattered Diffraction (EBSD) mode of a Scanning Electron Microscope (SEM) TESCAN Vega equipped with a detector NordlysNano, Oxford Instruments. Calculated mineral endmembers (expressed in mole %) and compositional variables are: almandine, Alm = Fe/(Fe+Mg+Ca+Mn); pyrope, Prp = Mg/(Fe+Mg+Ca+Mn); grossular, Grs = Ca/(Fe+Mg+Ca+Mn); spessartine, Sps = Mn/(Fe+Mg+Ca+Mn); anorthite, An = Ca/(Ca+Na+K); XFe = Fe/(Fe+Mg), XNa = Na/(Ca+Na+K); and apfu: atom per formula unit. Chemical zoning is expressed from core to rim by the symbol: XCore→XRim. Representative mineral analyses are available as supplementary material (table S1).
3.2. Pseudosection modeling
Bulk chemical compositions were estimated at Charles University by scanning areas of thin sections using the Energy Dispersive Spectroscopy (EDS) mode of the SEM equipped with a detector X-Max 50 from Oxford Instruments. Scanned zones (~90 to ~200 mm2) evaluated to be representative of the composition of the equilibrium volume during the prograde metamorphism encompass the complete rock assemblages and the modelled garnet crystals (i.e., using compositional isopleths) in the pseudosections. Bulk compositions are indicated in mol% as insets in pseudosections. All the samples contain ilmenite and lack magnetite, suggesting a low amount of Fe3+ (Connolly & Cesare, 1993); an arbitrary low amount of Fe3+ (1 mol%) was set accordingly, effectively preventing magnetite in the models.
Pseudosections were calculated with THERMOCALC (Powell & Holland, 1988) version 3.5 (December 2020 upgrade), using the x-eos set for metapelites (White, Powell, Holland, et al., 2014, January 2022 update), in the system MnNCKFMASHTO. THERMOCALC was run through the pypsbuilder interface (Lexa, 2017). The dataset includes the models for chlorite (chl), chloritoid (ctd), cordierite (cd), garnet (g), ilmenite (ilm), melt, orthopyroxene (opx), sapphirine (spr), staurolite (st) from White, Powell, Holland et al. (2014); biotite (bi; White, Powell, & Johnson, 2014); epidote (ep; Holland & Powell, 2011); plagioclase (pl) and K-feldspar (ksp; Holland et al., 2022); magnetite (mt; White et al., 2000) and spinel (spl; White et al., 2002). Effective bulk compositions were estimated using the print bulk info script of THERMOCALC, removing a single garnet composition estimated from the model. Melt loss in migmatite was accounted for using the print bulk info script by reincorporating a single melt batch at peak P–T conditions, i.e., coinciding with the maximum melt content along the inferred P–T path. Melt was reincorporated after the procedure described in Štípská et al. (2008), modified to fit the observed assemblage of the studied sample. Enough melt was reincorporated to reach water saturation at the solidus on a probable prograde P–T path, and further H2O was subsequently added to model the subsolidus evolution assuming water-saturated conditions.
3.3. Monazite U-Pb and trace element analyses
Before isotopic and trace element analyses, the monazite grains were identified in thin section using the Back Scattered Electron (BSE) mode of the SEM at Charles University. High-contrast BSE images of monazite grains with suitable size (> 20 µm) were acquired, and representative grains were then mapped for Y, Th, La, and U using the EPMA hosted at Charles University.
Monazite U-Pb isotopes and trace-elements analyses were performed in situ on a single spot and directly in thin section by Laser-Ablation Split stream inductively coupled plasma-mass Spectrometry (LASS) at the Department of Earth Science of the University of California in Santa Barbara (USA). The analyses were carried out using an 8 µm beam size with a 3 Hz repetition rate and ~1 J/cm2 fluence. The data were corrected for U-Pb and Th-Pb fractionation and mass bias by standard bracketing with repeated measurements of the 44069 monazite (Aleinikoff et al., 2006) as U-Pb primary reference material and Trebilcock (Tomascak et al., 1996) as trace-element primary reference material. Details on the analytical procedure and data processing can be found in Kylander-Clark et al. (2013). Reference material data table, calculated ages, and the original data table can be found in table S2. Errors in the data tables are reported as 2SE. Secondary reference materials yield long-term reproducibility of ~2%, and as such, ages of monazite reported herein should be compared with those of other methods using a 2% uncertainty. To this end, age uncertainties reported in the text are presented by the 2SE internal uncertainty, followed by that propagated with the long-term 2SD (i.e., 2%) in brackets.
3.4. Zircon U-Pb dating
U-Pb isotopes of the mounted zircon crystals were measured using a Nu Plasma HR MC-ICP-MS, coupled with an ArF excimer 193 nm laser ablation system (Resolution M-50) at the Department of Earth Sciences, the University of Hong Kong (China), following the analytical procedure of Xia et al. (2011). The raw data were corrected for U-Pb and Th-Pb fractionation and mass bias by standard bracketing with repeated measurements of the GJ1 zircon (Jackson et al., 2004) as primary reference material. Raw data as well as the calculated data for both reference material and the dated samples can be found in table S3. Long-term reproducibility of secondary reference material also yields a long-term reproducibility of 2%. Accordingly, zircon dates reported in the text are also presented by the 2SE internal uncertainty, followed by that propagated with the long-term 2SD (i.e., 2%) in brackets.
3.5. Plot of the U-Pb data
U-Pb dates and diagrams were generated with IsoplotR (Vermeesch, 2018). External uncertainties related to the decay constants were propagated to the calculated dates. Zircon U-Pb data are mostly concordant; they were consequently plotted in Wetherill plots, and multi-grain concordia dates were calculated from the data points. Monazite U-Pb data are moderately discordant for two samples (L267 and D241), but discordance is correlated with 204 cps (count per second), and the data yield a single tie line between an isotopic Pb composition and a lower intercept in Tera-Wasserburg diagrams, indicating that the discordance is due to small amounts of common Pb. Lower intercept dates were calculated accordingly. When possible, discordia lines calculated in Tera Wasserburg plots were not anchored to a fixed 207Pb/206Pb value, and the isotopic 206Pb/207Pb composition indicated by the upper intercept was compared to the terrestrial Pb isotopes model of Stacey and Kramers (1975). Weighted Mean Average (WMA) dates were calculated using the dates corrected for the incorporation of common Pb when necessary (i.e., for positively discordant analyses); these are corrected assuming an upper intercept 207Pb/206Pb of Stacey and Kramers. The calculated Mean Square Weighted Deviates (MSWD) in U-Pb diagrams is given as MSWDC+E, taking both concordance and equivalence into account (see Ludwig, 1998); or corresponds to the isochron fit and age homogeneity for lower intercept and WMA dates, respectively.
4. RESULTS
4.1. Petrography and mineral chemistry
4.1.1. L267 garnet-staurolite-sillimanite and D241 garnet-staurolite-kyanite-sillimanite micaschists
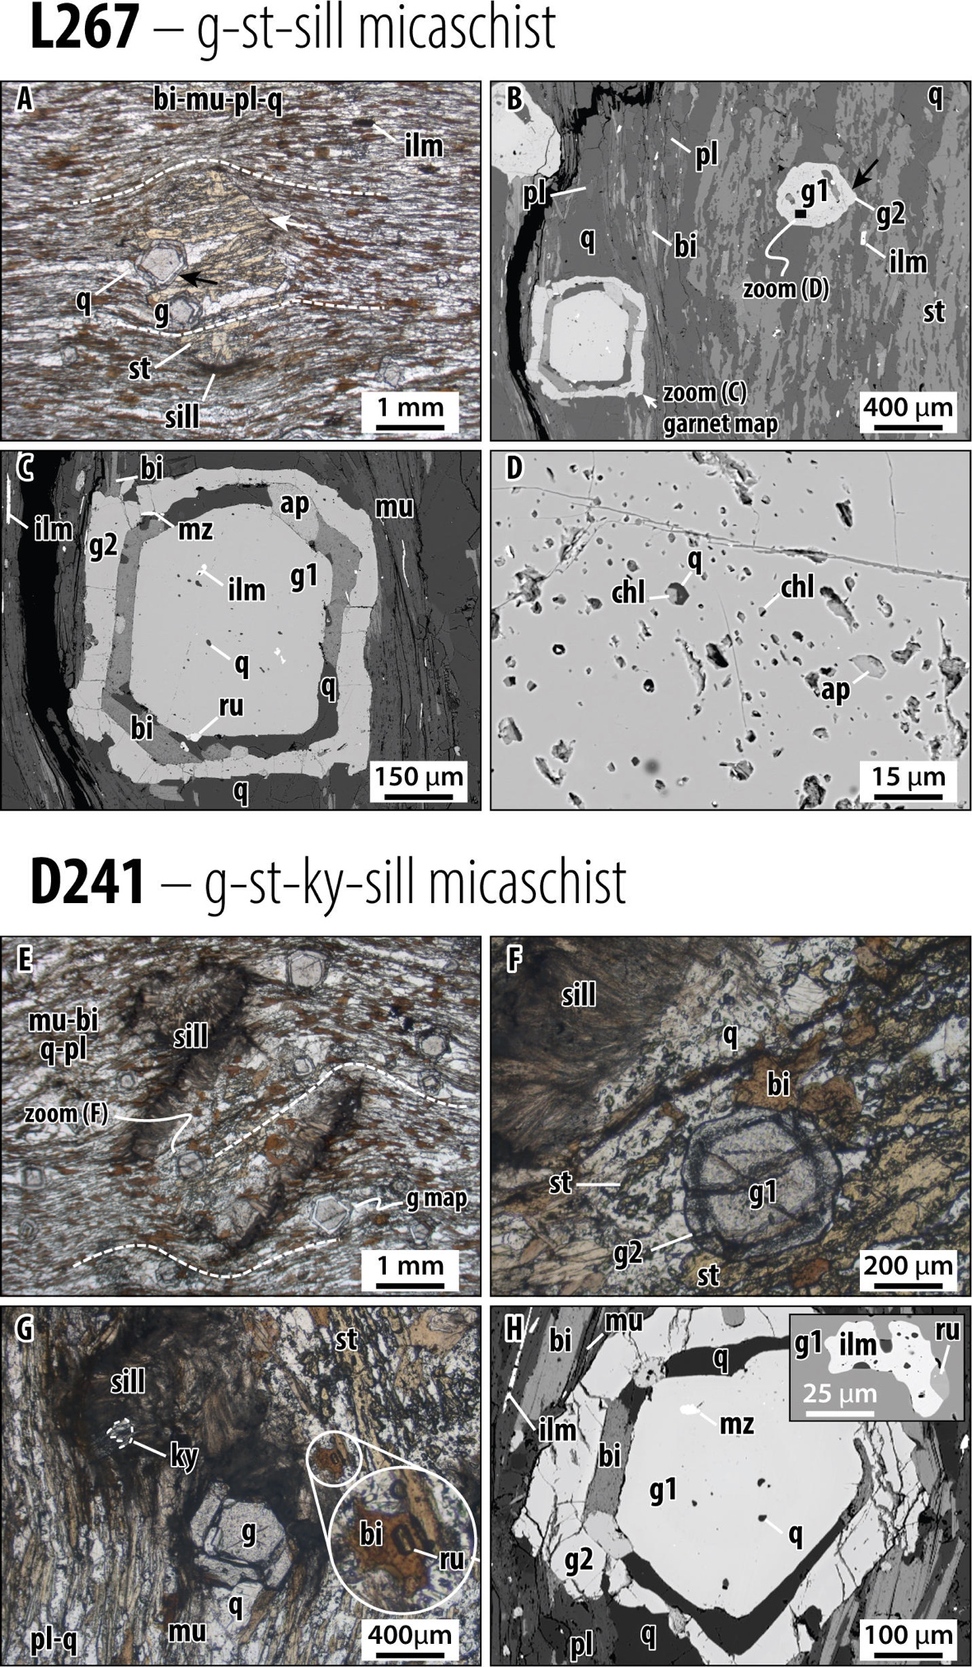
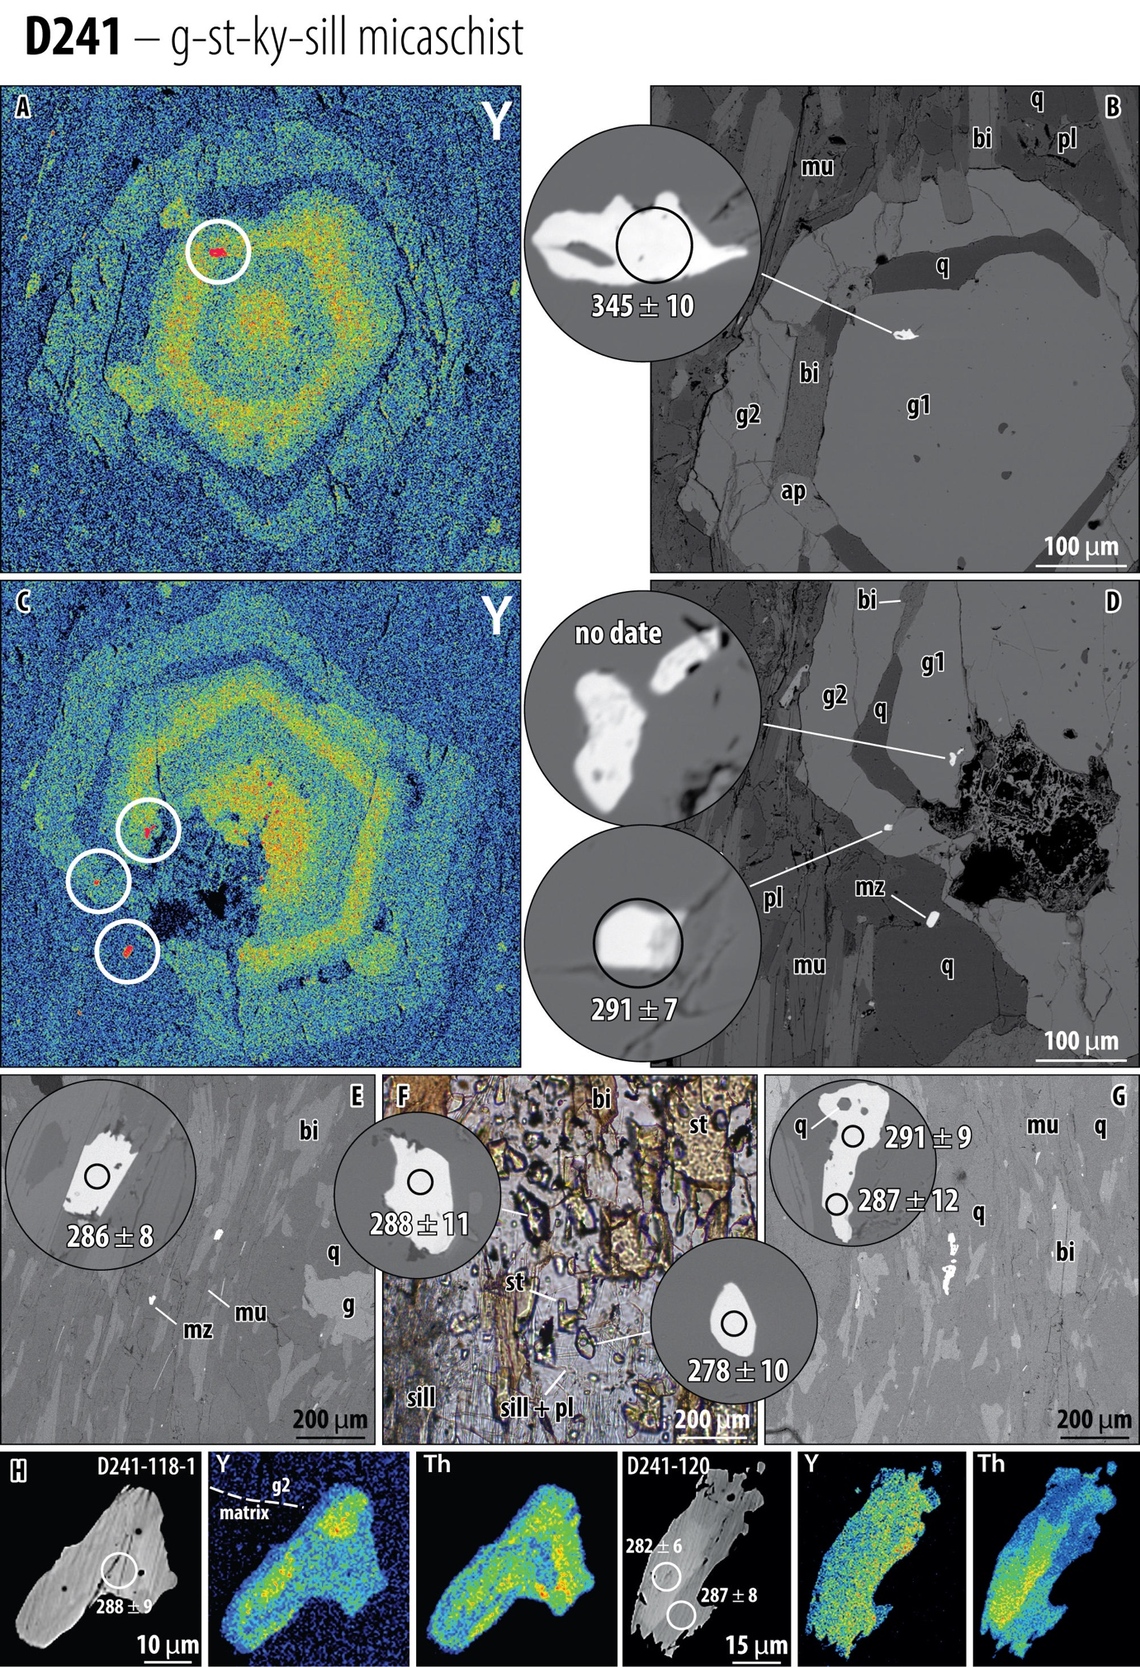
The micaschist samples display many petrographic similarities and are described together; the description stands for both samples, and differences are indicated in the text or parentheses. On the outcrop, the samples are fine-grained micaschists with small garnet (up to 1 mm) and staurolite (2–3 mm) wrapped in a penetrative foliation marked by a compositional layering. Under the microscope, L267 is composed of garnet (~5–10 %), staurolite (~5–10 %) and sillimanite (<1%), in a matrix of muscovite (~20%), biotite (~25%), plagioclase (~10 %) and quartz (~30 %), with accessory rutile, ilmenite, monazite, zircon and apatite. In contrast, D241 contains less staurolite (~2–3 %), contains kyanite (~1%), and more sillimanite (~3–5 %), while other minerals occur in similar proportions. The compositional layering is marked by an alternation of quartz-plagioclase- and biotite-muscovite-dominated layers of comparable thickness (100–250 µm; fig. 6A, E).
In both samples, two garnet generations can be identified optically (fig. 6B, C, and H). Commonly, garnet 1 is euhedral (up to 450 µm) and separated from garnet 2 (up to 100 µm thick) by a so-called “mineral ring” about 20–50 µm in thickness. Sometimes, the two garnets are in crystallographic continuity through a transitional cloudy garnet containing numerous tiny (1–5 µm) inclusions (fig. 6B, D, and F). Garnet 1 contains ilmenite, quartz, and monazite inclusions (fig. 6C, H), and in addition, rutile also occurs in D241. The mineral ring contains biotite, quartz, ilmenite, apatite (fig. 6C, H), and rutile in L267. The cloudy garnet zone contains biotite, quartz, apatite inclusions, as well as chlorite in L267 (fig. 6D). Garnet is abundant in the matrix, flanked by quartz in pressure shadows. It is also included in staurolite, where garnet 2 displays sharp grain boundaries against staurolite (black arrows in fig. 6A, B, and F).
_images_of_the_main_textural_features_in_.jpeg)
In L267, staurolite is xenoblastic but in sharp contact with the matrix minerals (white arrow in fig. 6A). Staurolite contains abundant inclusions of quartz with subordinate biotite and ilmenite, as well as garnet flanked by pressure shadows, all marking an internal fabric in continuity with the matrix foliation (fig. 6A). The external foliation, locally marked by sillimanite (fig. 6A), wraps around the garnet and staurolite porphyroblasts (fig. 6A and B). In D241, staurolite occurs as mm-sized anhedral crystals surrounded by an aggregate of biotite and quartz, all enclosed in a 500 µm thick corona of fibrolitic sillimanite (fig. 6E and F). Sillimanite aligns parallel with the matrix micas (fig. 6E) and contains rare anhedral crystals of kyanite (~200 µm; fig. 6G; identified by EBSD) and garnet (fig. 6G).
In both samples, garnet is zoned; several maps and profiles of continuous and discontinuous garnet crystals from the different textural positions were performed, and a representative garnet was selected for description in each sample (fig. 7A and D). The garnet selected in L267 has garnet 1 and garnet 2 in optical continuity, and the transition is marked by the cloudy appearance of the inner garnet 2. The garnet selected in D241 has a mineral ring between garnet 1 and garnet 2 (fig. 7B, E, and F). Based on sharp variations of grossular, garnet 1 (L267: Grs4 %; D241: Grs3–4 %) is further distinguished from an inner garnet 2 (L267: Grs7–10 %; D241: Grs8–10 %) and an outer garnet 2 (L267: Grs 4–5 %; D241: Grs3–5%). Across the three zones, garnet displays a rimward decrease of XFe and spessartine followed by slight increase at the edge of the crystal (core→rim→edge; L267: XFe0.90→0.84→0.85; Sps26→6→8 %; D241: XFe0.87→0.85→0.87; Sps25→7→9 %), associated with a rimward increase of pyrope and almandine followed by slight decrease at the very edge of garnet 2 (L267: Prp7→14→13 %; Alm62→75→74 %; D241: Prp10→14→11 %; Alm60→76→75 %). In both samples, the cloudy garnet has a composition similar to the inner garnet 2 from crystals with a mineral ring separating garnet 1 and garnet 2 (not shown).
_and_chemical_zoning_profile_(**d--g**)_in_garnets._the_position_and_.tiff)
The other minerals are fairly homogeneous across the thin section. Staurolite has XFe=77–78; Zn=0.015–0.025 apfu in L267 and XFe=75–78 and Zn=0.05–0.07 apfu in D241. Plagioclase is oligoclase (L267: An21–24 %; D241: An23–25 %). Muscovite contains a limited amount of paragonite (L267: XNa0.18–0.19; D241: XNa0.17–0.20) and low Si (L267: Si=3.05–3.07 apfu; D241: Si=3.06–3.09 apfu). Biotite has XFe=42–46 and Ti=0.11–0.22 apfu in L267; and XFe=46–47 and Ti=0.16–0.24 apfu in D241.
The following crystallisation sequence is deduced from petrographic and textural relations. Inclusion relationships indicate that garnet 1 crystallised with ilmenite in both samples, and additionally with rutile in D241. The inner garnet 2 crystallised in the presence of ilmenite, and also with rutile in D241 and chlorite in L267. Sharp grain contact between the outer garnet 2 and staurolite is interpreted as textural equilibrium, and therefore also as a proxy for chemical equilibrium. In D241, kyanite and staurolite occur in a similar position, suggesting a former chemical equilibrium. Staurolite preserves a foliation continuous with the matrix foliation that also wraps around staurolite crystals, indicating syntectonic growth. Sillimanite around subhedral to xenomorphic staurolite is interpreted as a replacement texture. Sillimanite oriented in the main foliation is also considered syntectonic.
4.1.2. K263 – Garnet-kyanite-sillimanite migmatite
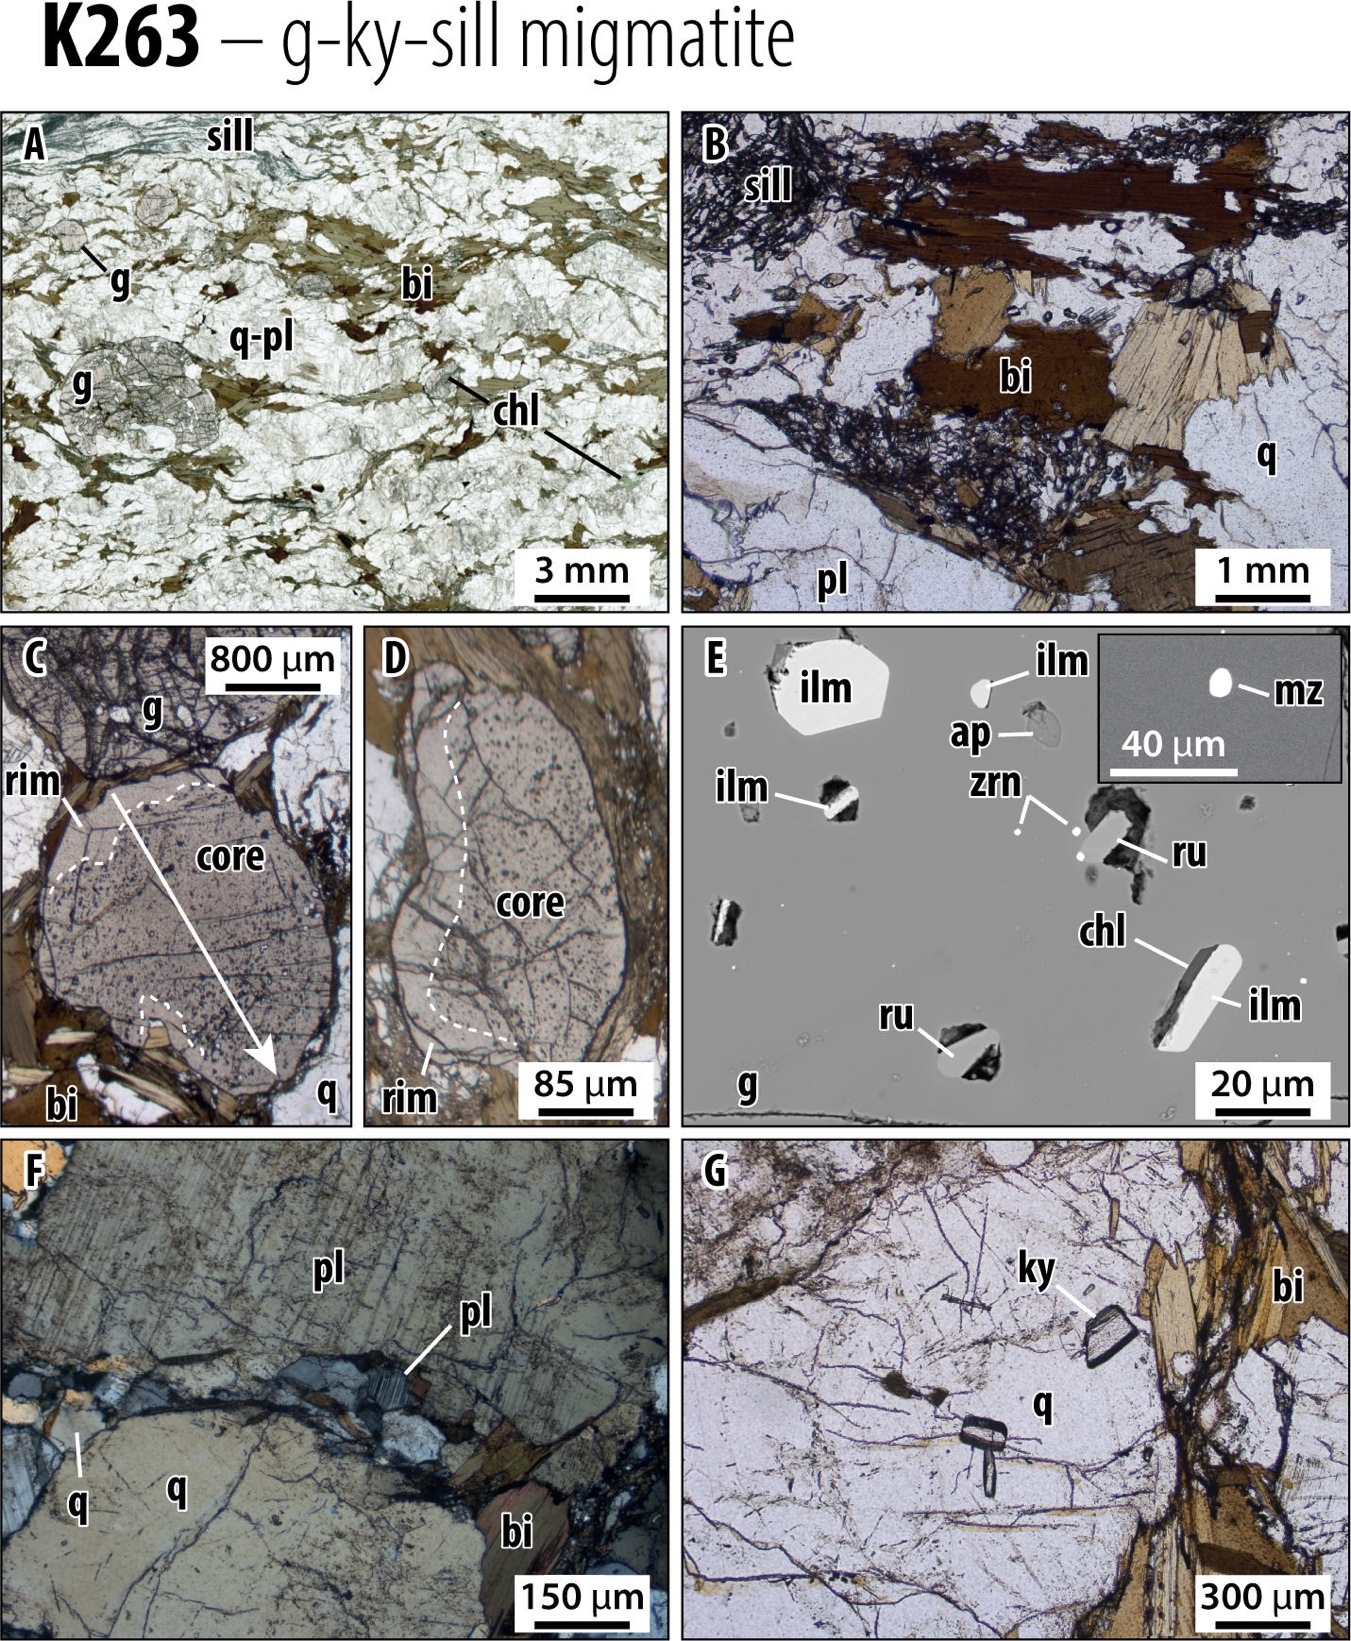
On the outcrop, the rock is a medium-grained migmatite composed of biotite-garnet-sillimanite and quartz-feldspar aggregates. Sillimanite marks a mineral lineation on the foliation plane (fig. 8B). Under the microscope, the sample shows a variable proportion of dark- (20–40 %) and light-colored (60–80 %) minerals. It contains garnet, kyanite, sillimanite, biotite, plagioclase, quartz, chlorite, and accessory ilmenite, rutile, zircon, monazite, xenotime, and apatite. Garnet porphyroblasts (1–5 mm) display an anhedral inclusion-rich core and a thin (50–300 µm) discontinuous inclusion-free rim (fig. 8C and D). Small inclusions (5 µm, but up to 50 µm) in garnet core encompass quartz, plagioclase, biotite, ilmenite, rutile, chlorite, apatite, as well as minor zircon and monazite. Rutile and ilmenite in the garnet core occur close to each other, and they are randomly distributed (fig. 8E).
The matrix contains plagioclase, quartz, biotite, and minor sillimanite crystals. The crystal-size distribution of quartz, plagioclase and biotite is bimodal, with a majority of mm-sized crystals (~95 %), and minor small interstitial crystals (~5 %, ~100 µm in size; fig. 8F). The coarse plagioclase and quartz contain small round crystals of biotite or kyanite identified by EBSD (100–300 µm; fig. 8G), plagioclase also contains round quartz inclusions. Coarse biotite (up to 3 mm) from the matrix is associated with prismatic sillimanite (~100 µm; fig. 8B). Biotite and garnet are locally chloritized.
Garnet is zoned (fig. 8C and G). From core to rim, XFe, spessartine, and grossular contents decrease, except next to the very edge, where the inverse trend of XFe and spessartine is observed (XFe85→75→81; Sps19→8→18 %; Grs11→5→5 %). Pyrope and almandine increase from core to rim and decrease at the very edge (Prp11→21→15 %; Alm58→65→62 %). The coarse matrix plagioclase displays increasing anorthite content from core to rim (An18→32 %), the small interstitial crystals compare to the rim composition (An28–29 %), and the most calcic crystals (An36 %) occur in garnet. Biotite in garnet shows lower XFe (32–39) and Ti (0.20–0.23 apfu) than most matrix crystals (XFe44–50; Ti0.26–0.36 apfu).
The petrographic features are interpreted in terms of the following crystallisation sequence. Inclusion relationships indicate that garnet core crystallised in the assemblage quartz, plagioclase, biotite, ilmenite, and rutile. Chlorite included in garnet could be primary or formed during retrogression. The xenomorphic shape of the garnet core possibly indicates a period of resorption. The garnet rim and the matrix assemblage represent later crystallisation events. Kyanite, preserved as inclusions, and sillimanite, ubiquitous in the matrix, belong to different metamorphic stages. Assigning rutile and ilmenite from the matrix is uncertain, but metastable rutile could be preserved from the kyanite-bearing stage. Small interstitial quartz, plagioclase, and biotite are interpreted as crystallised from a melt. Accordingly, we infer that garnet rim, kyanite, and rutile are part of the peak pressure assemblage, while sillimanite and ilmenite belong to the assemblage of a high-temperature overprint. Both stages potentially occurred at suprasolidus conditions. Chlorite after biotite and garnet represents later retrogression.
**_mat.jpeg)
4.2. Phase equilibria modeling
4.2.1. L267 – garnet-staurolite-sillimanite micaschist
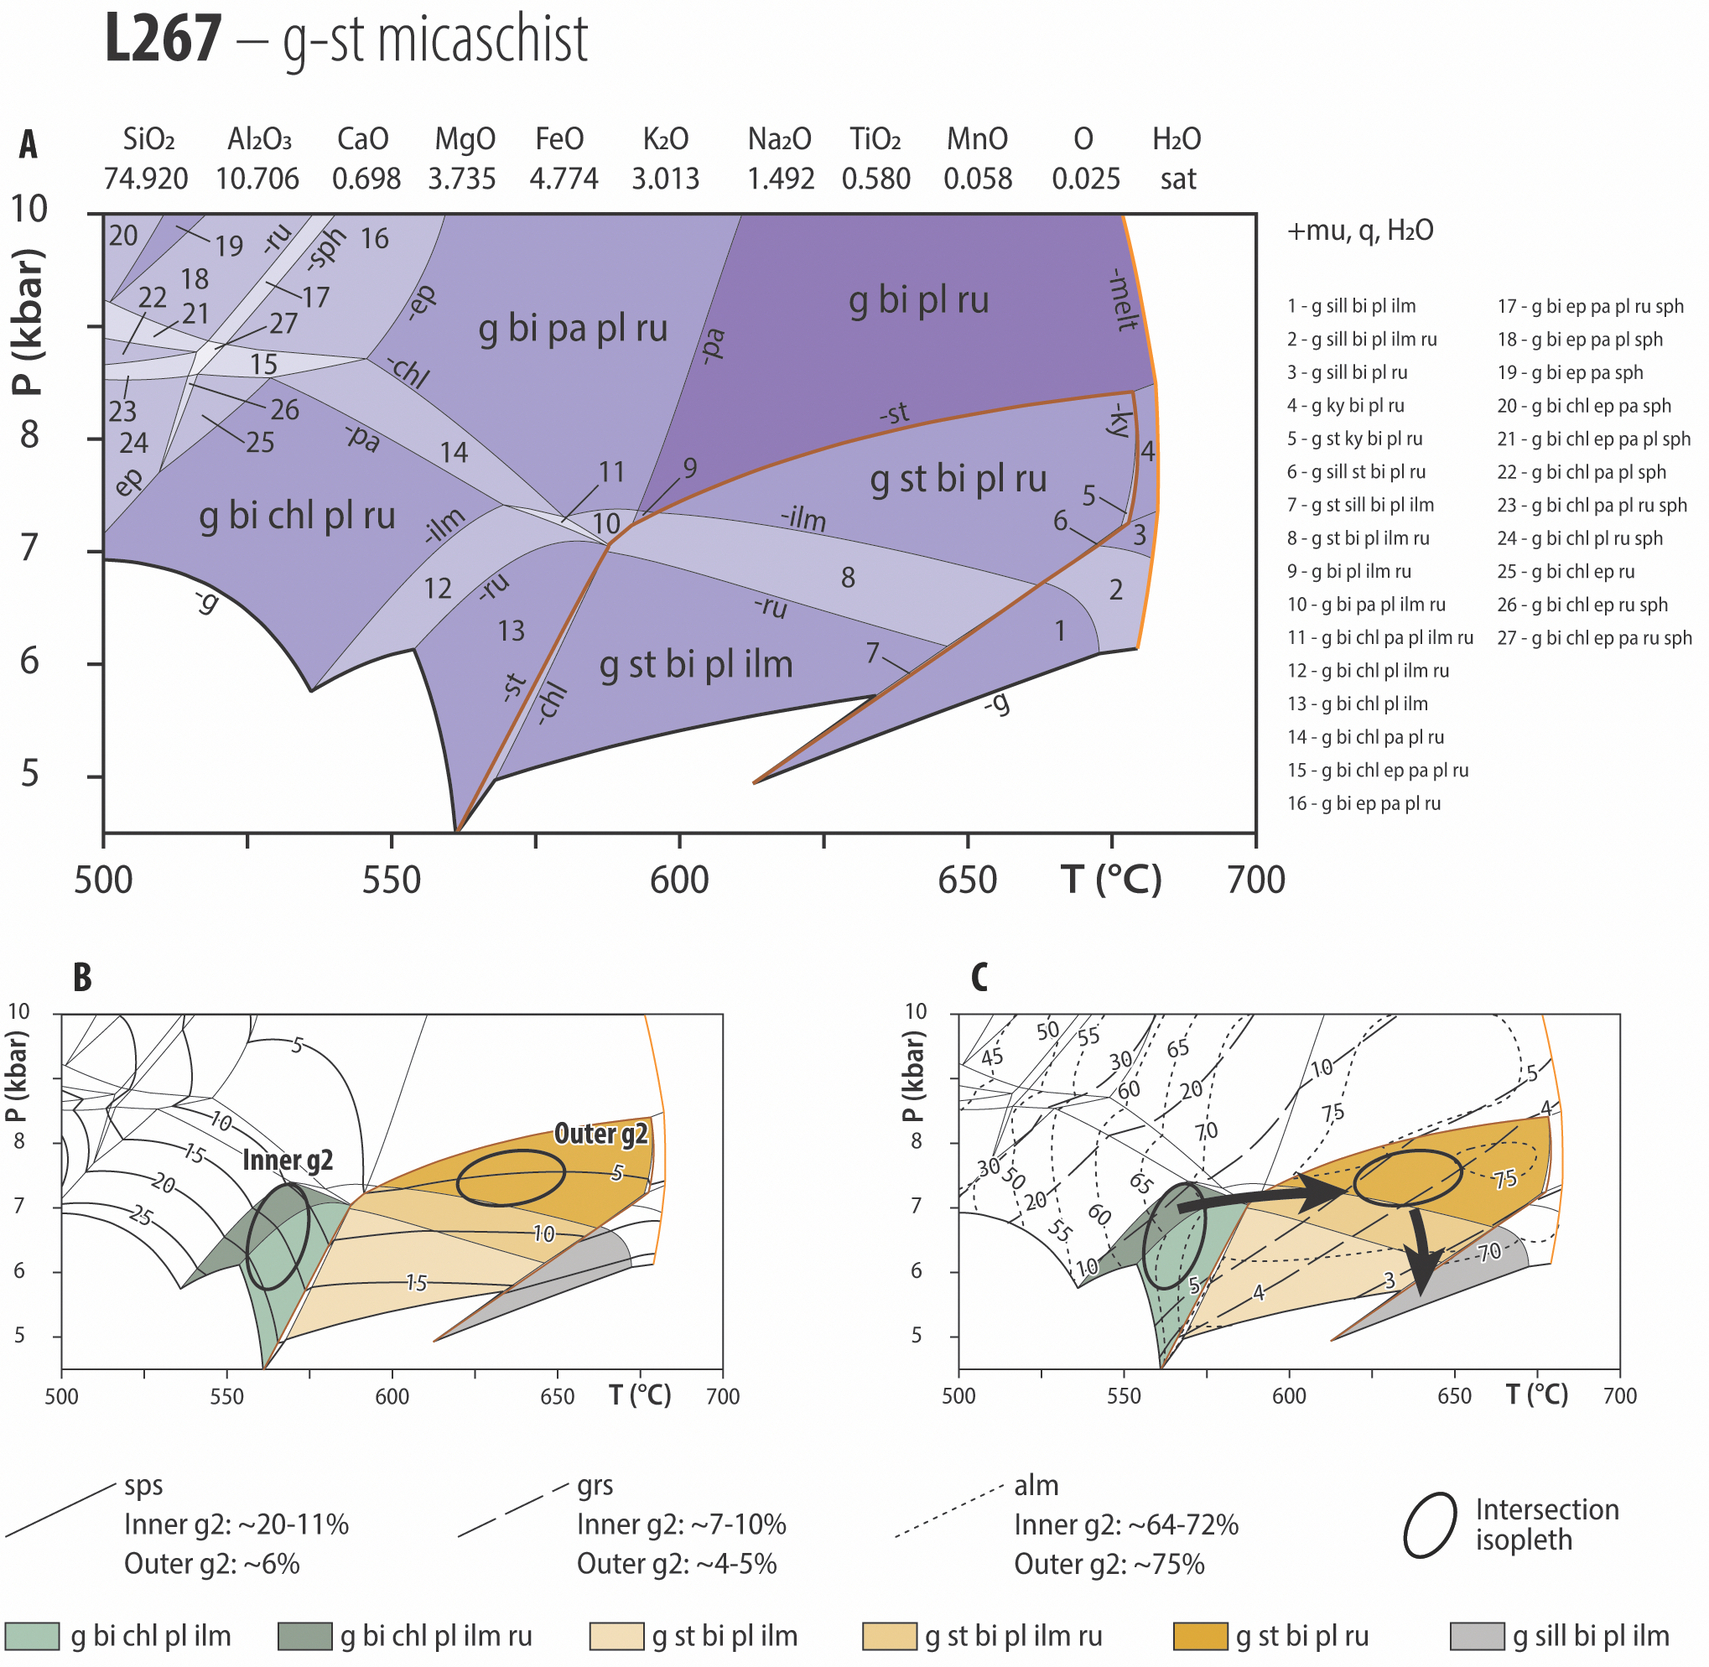
The pseudosection shown in figure 9 was constructed to model the conditions of garnet 1 growth. The observed assemblage, garnet 1, ilmenite, and quartz, is compatible with the modelled field g-bi-chl-mu-ilm. Modelled compositional isopleths for the garnet 1 core (Sps26, Alm62, Grs4) overlap around 4–5 kbar, 525–550 °C, and those for the garnet 1 rim (Sps20, Alm64–65, Grs4–6) around 5–6 kbar, 550–575 °C, indicating a prograde path within the modelled g-bi-chl-mu-ilm field.
**_*pt*_pseudosection_constructed_for_the_sem-measured_bulk_composition_of_the_sample.tiff)
The composition of garnet 1 modelled at 5 kbar and 550 °C was used to determine a fractionated composition to construct the pseudosection in figure 10 and model garnet 2 growth. The topology of the new pseudosection is comparable to the unfractionated one, except for the significantly reduced stability field of garnet toward higher pressure, above 4.5–7 kbar.
The observed assemblage of inner garnet 2, chlorite, biotite, quartz, rutile, and ilmenite is fully reproduced, together with matrix plagioclase, in the field g-bi-chl-pl-ilm-ru (label 12 in fig. 10) modelled at 6–7.5 kbar, 525–575 °C. The partial assemblage of outer garnet 2, staurolite, and rutile is reproduced at higher temperature in the field g-st-bi-pl-ru, at 600–675 °C and 6.5–8.5 kbar. The compositional isopleths for the inner (Sps11–20, Alm64–72, Grs7–10) and outer (Sps6, Alm75, Grs4–5) garnet 2 intersect in the fields g-bi-chl-pl-ilm-ru and g-st-bi-pl-ru, respectively, suggesting a roughly isobaric prograde P–T path.
Sillimanite and abundant ilmenite of the matrix are reproduced in the field g-sill-bi-pl-ilm (label 1 in fig. 10A) below 6.5 kbar and at 625–675 °C. The modelled change in garnet composition from the field g-st-bi-pl-ru to g-sill-bi-pl-ilm is consistent with the slight increase of spessartine and decrease of almandine observed at the edge of the outer garnet 2 crystals. Hence, the sillimanite overprint indicates a decompression.
**_*pt*_pseudosection_constructed_for_the_calculated_composition_of_l267_accounting_.jpeg)
4.2.2. D241 – Garnet-staurolite-kyanite-sillimanite micaschist
A pseudosection was constructed to model the growth of garnet 1 (fig. 11). The observed assemblage garnet 1, biotite, quartz, ilmenite and rare (i.e., one) rutile is reproduced in the field g-bi-chl-mu-ilm-ru (label 20 in fig. 11). However, the modelled compositional isopleths for the measured composition of garnet 1 core (Sps25, Alm60, Grs3–4) and rim (Sps15, Alm68, Grs4–7) both intersect in the modelled field g-bi-chl-mu-ilm, i.e., at 3–4 kbar, 525–550 °C and 5–6 kbar, 550–575 °C, respectively; far from the ilmenite-rutile-bearing fields. Rutile may be of a detrital origin or formed at lower P–T conditions at greenschist facies, as suggested by the low temperature position of the ilm-ru transition (field labeled 20 in fig. 11); thus, rutile may not be characteristic of the assemblage stable with garnet 1. In such a case, the pseudosection points to a prograde growth of garnet 1 from 3–4 kbar, 525–550 °C to 5–6 kbar, 550–575 °C.
**_*pt*_pseudosection_constructed_for_the_sem-measured_bulk_composition_of_the_sampl.tiff)
The pseudosection presented in figure 12 was constructed for a fractionated bulk composition using the modelled composition of garnet 1 at 5 kbar and 560 °C (fig. 11). In the fractionated pseudosection, the garnet stability field is significantly reduced above >5–7 kbar. The isopleths for the inner garnet 2 (Sps7–9, Alm70–72, Grs8–10) intersect in the field g-bi-chl-ilm around 7 kbar, 570 °C, which is compatible with the observed assemblage of inner garnet 2, biotite, ilmenite, plagioclase, and quartz, despite chlorite not observed in this sample. The inferred assemblage garnet-staurolite-kyanite is modelled in a narrow temperature window around 675 °C and between 7 and 9 kbar in the field g-st-ky-bi-ru (labeled 5 in fig. 12). The isopleths for the outer garnet 2 (Sps6–8, Alm74–76, Grs3–6) intersect in the field g-st-ky-bi-ru around 7–8 kbar, 675 °C in agreement with the inferred and calculated assemblages. Hence, garnet 2 growth is modelled along a roughly isobaric heating.
Sillimanite is modelled at 5–7 kbar and 625–680 °C. The observed local resorption of garnet in the vicinity of sillimanite may be accounted for by the modelled decrease of garnet mode (not shown) from the kyanite to the sillimanite stability fields. Similarly, the increase of spessartine and decrease of almandine contents at the edge of garnet 2 can be explained by the trend of garnet compositional isopleths during such decompression.
**_*pt*_pseudosection_constructed_for_the_calculated_composition_of_d241_accounting_.tiff)
4.2.3. K263 – Garnet-kyanite-sillimanite migmatite
A pseudosection for K263 was constructed using the measured bulk composition (fig. 13). According to the absence of textural evidence for retrograde back-reactions such as biotite replacement of garnet (e.g., Waters, 2001) or muscovite in the rock assemblage (e.g., Štípská et al., 2008), most of the melt must have been extracted before cooling below the solidus. Accordingly, H2O was set to reproduce H2O-undersaturated conditions when the rock crossed the solidus according to a TX(H2O) pseudosection (not shown). The possible range of H2O content is bracketed by the presence of K-feldspar (conspicuously absent in thin section) occurring at subsolidus conditions below 3.85 mol% of H2O, and by the saturation of the rock with an aqueous fluid above 4.20 mol% of H2O. This defines a narrow range of possible H2O content, and we used the value of 4.05 mol% for the calculation of the pseudosection.
The observed assemblage garnet-kyanite-rutile-biotite-plagioclase-quartz is best correlated to the field melt-g-ky-bi-ksp-ru (label 10 in fig. 13) at 8–10 kbar, 750–775 °C. Compositional isopleths for spessartine, almandine, and grossular for the spessartine-poor inner rim of garnet (Sps8, Grs5, Alm65) also intersect this field. K-feldspar, modelled in low proportion (<5%, not shown), is lacking in the observed assemblage, which could be explained by K-feldspar breakdown during decompression above the solidus. The assemblage sillimanite-ilmenite-rutile observed in the matrix is modelled in the very narrow fields g-sill-bi-ilm-ru±melt (labeled 17 & 18 in fig. 13). It is therefore unlikely that the rock equilibrated in these fields. Rutile is most likely a metastable remnant of the kyanite-bearing assemblage. Hence, sillimanite most likely documents an intermediate pressure overprint in the field melt-g-sill-bi-ilm around 5–6 kbar and 700–775 °C. The isopleths for garnet rim (Grs4, Alm61–63, Sps15–20) do not precisely intersect in the pseudosection, but the high spessartine content of garnet rim suggests significant cooling in agreement with chlorite observed in garnet fractures (not modelled).
**_*pt*_pseudosection_constructed_with_the_sem-measured_bulk_composition_of_the_samp.tiff)
An effective bulk composition was calculated, following a melt reincorporation procedure (see Methods), to assess the prograde, subsolidus P–T conditions of the rock (fig. 14). Garnet core contains the assemblage chlorite-biotite-plagioclase-quartz-ilmenite-rutile reproduced in the field g-bi-chl-mu-ru-ilm. Even if chlorite possibly formed during the retrograde P–T path, the isopleths corresponding to the measured composition of the garnet core (Sps19, Alm58, Grs11) closely overlap this field and the neighbouring field g-bi-chl-mu-ru between 550–575 °C, 5–6 kbar. The possible resorption of garnet core before garnet rim growth would imply a metamorphic evolution more complicated than a single prograde metamorphism, and the P–T path is thus indicated as a dotted line in the figure.
**_*pt*_pseudosection_constructed_for_the_calculated_initial_composition_of_k263_est.tiff)
4.3. Monazite petrography, geochronology, and trace-element data
4.3.1. L267 – garnet-staurolite-sillimanite micaschist
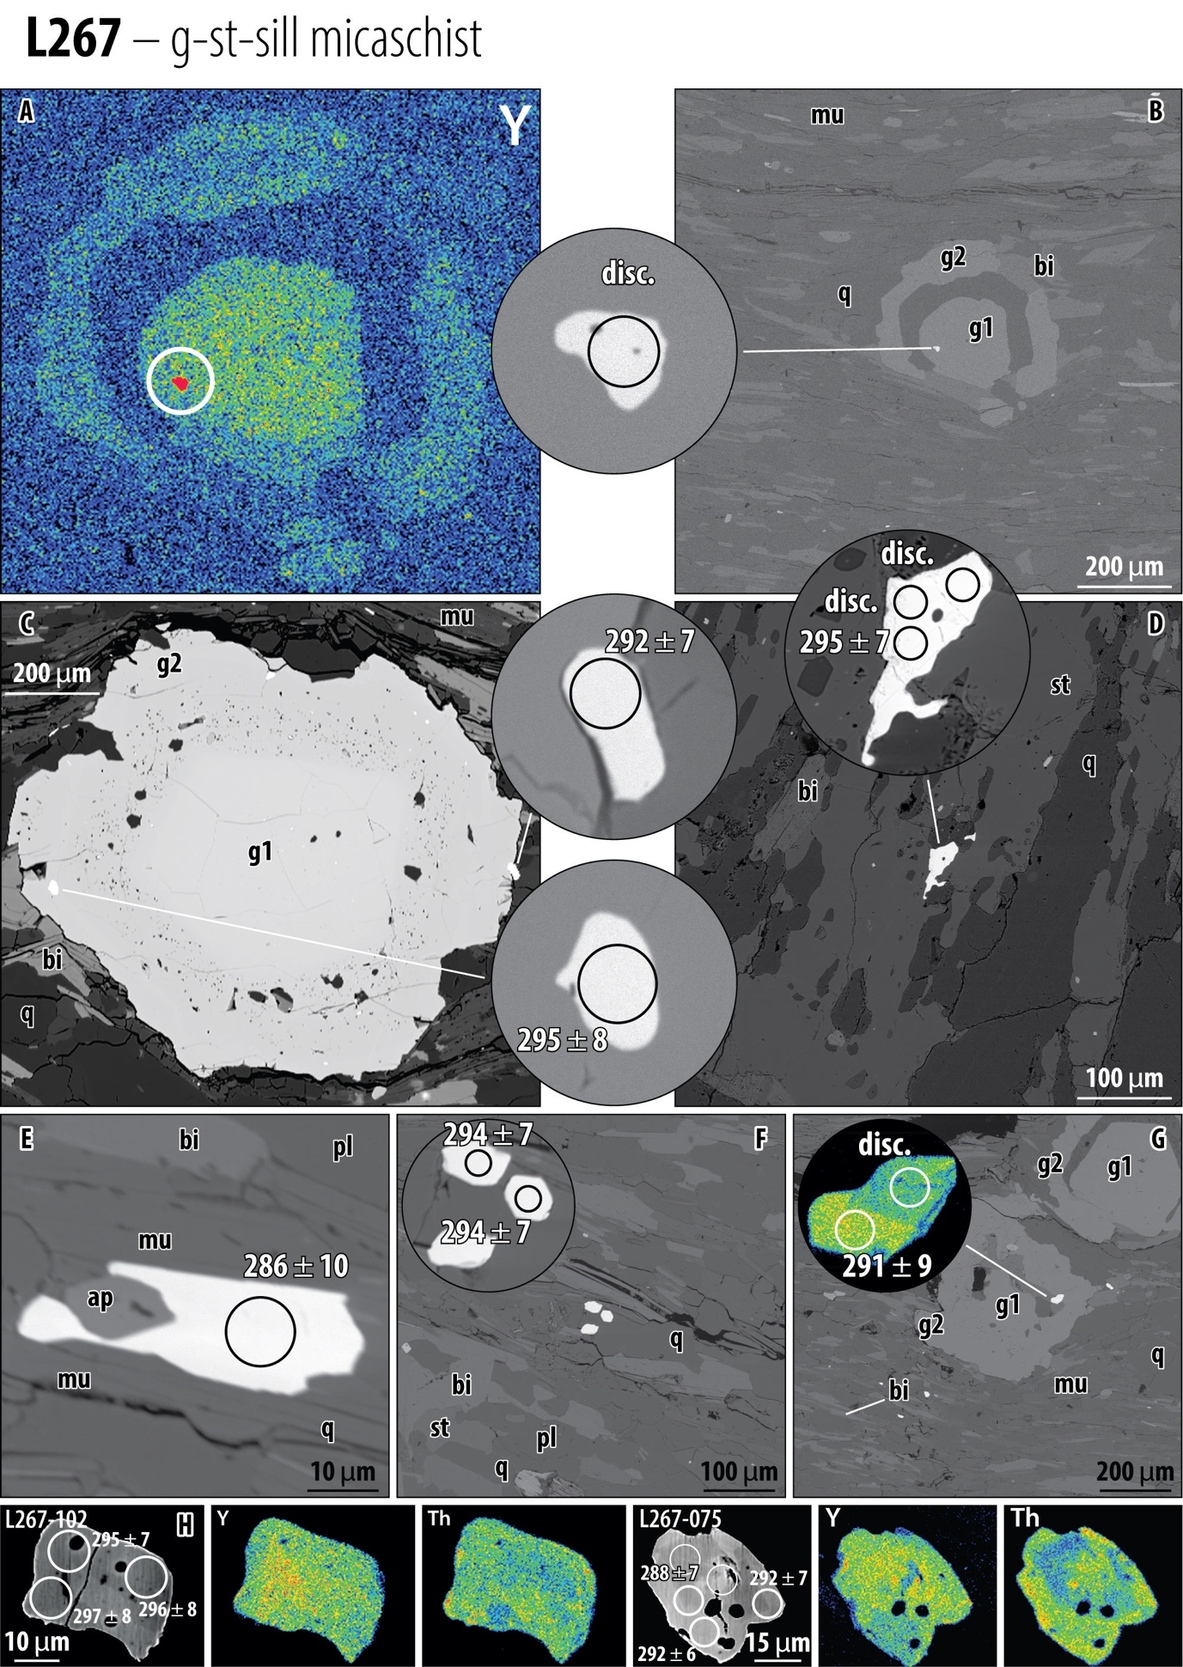
Monazite was carefully examined in thin section and crystals with suitable size (≥10 µm) for LASS analyses have been identified in garnet 1, fully or partially included in garnet 2, epitaxial on micas, fully included in matrix quartz, and staurolite (fig. 15). Compositional maps of the largest crystals reveal a patchy zoning (fig. 15H). Eighty-five spots were measured in 52 monazite crystals from various textural positions. Only one spot could be analyzed in garnet 1.
**_x-ray_map_of_y_showing_a_monazite_inclusion_in_garnet_1_and_**(.jpeg)
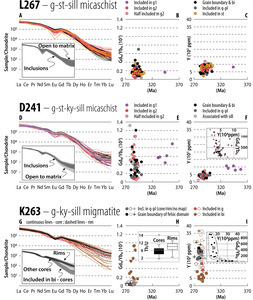
Textural control on the distribution of trace-elements in monazite crystals was investigated in REE-spider plots; GdN/YbN-vs-date and Y-vs-date binary plots (fig. 16A to C). Monazite included in garnet 1 shows a moderate slope of the heavy rare earth elements (HREE; GdN/YbN ~0.15x10³) and moderate Y-content (~8x10³ ppm). The remaining spots but one have similar HREE and Y-content, display homogeneous REE-spider plots, and tightly cluster in the GdN/YbN-vs-date and Y-vs-date plots (GdN/YbN ~0.18x10³; Y ~7x10³ ppm).

In the Tera Wasserburg diagram, the U-Pb data are mainly subconcordant to slightly discordant (fig. 17A). The only spot in garnet 1 is slightly discordant. Linear regression through eighty-two data points determines a discordia with a lower intercept date of 286.5 ± 1.5[6] Ma (MSWD = 1.6; L267) and an initial 207Pb/206Pb value of 1.32 ± 0.5. Despite the large uncertainty, the calculated initial isotopic Pb composition agrees with the terrestrial Pb evolution model of Stacey and Kramers (1975). An equivalent mean 206Pb/238U date of 285.5 ± 1[6] Ma with a similar MSWD value of 1.6 can be calculated using the same data points after correction for the incorporation of common Pb (fig. 17D).
pb_geochronology_of_monazite._terra-wasserburg_plots_of_monazite_upb_data_for_**(.tif)
4.3.2. D241 – Garnet-staurolite-kyanite-sillimanite micaschist
Monazite crystals occur in garnet 1, fully or half included in garnet 2, along grain boundaries, epitaxial with micas, in sillimanite coronas around staurolite; and fully included in matrix quartz or plagioclase (fig. 18). Small monazite (~10 µm) inclusions in garnet 1 systematically occur in a Y-rich zone of the garnet crystal (fig. 18A). Monazite outside garnet 1 tends to be larger (up to 50 µm), the largest ones were mapped, no core-rim relationships could be detected, but a patchy zoning is illustrated by Y and Th maps (fig. 16H). A total of 65 spots in 53 monazite crystals were analyzed. Individual spots show a strong correlation between the textural position of the analyzed crystal in the thin section and the date, but no obvious relationship between the internal chemical zoning analyzed and the date.
**_x-ray_map_of_y_in_garnet_with_a_monazite_inclusion_and_**(b)**_.jpeg)
In the trace elements plots for monazite, only 5 spots from the monazite included in garnet 1 are displayed because of the small crystal size and resulting contamination with garnet during ablation. Monazite in garnet 1 shows a moderate slope of the HREE (GdN/YbN 0.4–0.9x10³) and moderate Y-content (~ 10x103ppm), while monazite in the other textural positions shows a wider range of the GdN/YbN ratio (0.5–1.3x10³) and lower Y content (~ 1–7x10³ ppm). Among the early Permian crystals, those opened to the matrix display higher values of the GdN/YbN ratio (up to 1.3x10³), compared to the crystals fully included in garnet, quartz, or plagioclase (GdN/YbN ≤ 0.6x10³), and the GdN/YbN ratio is negatively correlated with Y-content.
In the Tera Wasserburg diagram, the crystals included in garnet 1 yield lower Carboniferous dates (ca. 350–330 Ma) while those in other textural positions are mostly early Permian (ca. 300–280 Ma). Both groups are characterised by subconcordant to moderately discordant spots (fig. 17B), indicating a limited incorporation of common Pb. Nine out of the eleven analyses from crystals in garnet 1 and one spot half included in garnet 2 yield a discordia with a lower intercept date of 339.5 ± 6.5[9.5] Ma. Because of the limited discordance of the spots, the calculated upper intercept was meaningless, thus, the intercept was fixed for a 207Pb/206Pb (0.8583) value after Stacey and Kramers (1975). The resulting discordia have quite a large MSWD value related to a moderate spread of the most concordant spots and the small number of data points. Following a correction for the common Pb, a similar mean 206Pb/238U date of 339 ± 6.5[9.5] Ma (MSWD = 3.2; D241) can be calculated using the same group of spots (fig. 17D). The younger group, mostly from crystals outside of garnet 1, fifty-three spots display a range of dates between 300 and 280 Ma. Due to the limited discordance of the spots, we assumed a fixed 207Pb/206Pb (of 0.8545) after Stacey and Kramers (1975) to calculate a discordia, which yields a lower intercept date of 288 ± 1.5[6] Ma. The discordia has a moderate MSWD value of 1.7, indicating a limited dispersion. The lower intercept date is equivalent to a mean 206Pb/238U date of 287.5 ± 1.5[6] Ma (MSWD = 1.6; D241) calculated using common Pb corrected dates from the same spots.
4.3.3. K263 – Garnet-kyanite-sillimanite migmatite
Monazite is observed along the cleavage of biotite and grain boundaries; included in large quartz and plagioclase; and included in garnet, usually as small inclusions (~5 µm) and once as a larger inclusion (~50 µm) together with plagioclase (fig. 19). Monazite contains inclusions of apatite, quartz, biotite and zircon. The crystals tend to be large (50–100 µm), and most of them were mapped. These maps show a core-rim relationship (fig. 19), indicating in most cases that at the scale of a single crystal, the rims are enriched in Y and Th relative to the cores. Yttrium in the cores defines either distinctly enriched bands (fig. 19B and D) or a patchy zoning (fig. 19G). Both Y and Th commonly show a patchy zoning in the rims (fig. 19G). None of the 83 spots performed in 14 crystals from each textural position (i.e., in thin section) allow for the discrimination of a textural control on the dates, as both cores and rims yield equivalent early Permian dates.
Trace element plots from the mapped crystals unravel a textural control on the incorporation of the trace elements (fig. 16G to I). The cores of monazite associated with biotite in the melanosome display a steeper slope of the HREE (0.2–0.9 103) and average lower Y content (Y: 3–8.3x10³ ppm) than the cores in the leucosome (Y: 7–28x103 ppm; GdN/YbN < 2 103). The rims display a restricted range of GdN/YbN (< 2 103) and a large scatter of the Y-content (3–36x103 ppm) without apparent relationship with the textural position.
In the Tera Wasserburg diagram, all the data are concordant (fig. 17C). All the spots are used to calculate a concordia date of 283.5 ± 1[6] Ma (MSWDC+E = 1.2; K263) and an identical mean 206Pb/238U date with MSWD = 1.1 (fig. 17D).
**_included_in_garnet__**(b)**_.tiff)
4.4. Zircon geochronology
This section provides a short description and summary of the U-Pb isotopic results of zircons from magmatic rocks. Field and petrographic pictures of the related samples are available in the supplementary figure S1.
4.4.1. Y269B – Diorite dike
Y269B is an undeformed diorite dike cutting across the main foliation of the Central Domain. It is composed of plagioclase (~65 %), green biotite (~15%), greenish to blueish amphibole (~10 %), titanite (up to a few per cent), and accessory epidote (~1 %), apatite, and zircon.
Zircon crystal fragments from the sample are usually quite large (up to 700 µm). The fragments normally display broad, striped zonation in CL images, and some grains show homogeneous domains (fig. 20A). Twelve analyses conducted on different grains, yield mostly concordant results, and all but one have Th/U > 0.2 (fig. 20A). Nine concordant analyses define a concordia date of 290 ± 2[6] Ma (MSWD = 1.3; Y269B). One concordant spot plots at ca. 410 Ma. The ca. 410 Ma grain could be a xenocryst from the country rocks, while the ca. 290 Ma date is interpreted as the emplacement age of the dike.
**_y269b__**(b)**_y261a__**(.tif)
4.4.2. Y261A – Nebulitic migmatite
The sample Y261A is a nebulitic migmatite composed of plagioclase (~70 %), quartz (~10–20 %), biotite (<10 %), K-feldspar (< 5 %), garnet (~1 %), and accessory ilmenite, apatite, and zircon.
Zircon crystals are dominantly euhedral, 100–300 µm in length, and with a length/width ratio from 1:1 to 1:3. These grains display well-developed oscillatory zoning in the CL images (fig. 20B), suggesting an igneous origin. Twenty-five analyses were conducted, yielding concordant to slightly discordant results (fig. 20B) with high Th/U ratios of 0.22–1.55. Sixteen concordant to discordant spots form a main cluster with a weighted mean 206Pb/238U age of 376 ± 1.5[7.5] Ma (MSWD = 1.2; Y261A). The seven concordant spots from this cluster yield an equivalent concordia date of 377 ± 2[8] Ma (MSWD = 1.4). A subordinate group defined by four (sub)concordant spots plots in the range of ca. 460–440 Ma, and one remaining concordant analysis plots at ca. 510 Ma. Three discordant data points probably result from limited Pb-loss. The main ca. 376 Ma age population can be interpreted either as a maximum depositional age of the sedimentary protolith, or as an igneous age related to the crystallisation of melt in the migmatite. The older concordant Ordovician grains may be detrital crystals inherited from the sedimentary protolith.
4.4.3. Y261B – Garnet-kyanite-sillimanite migmatite
The sample is a garnet-kyanite-sillimanite migmatite comparable to K263, with plagioclase (~40 %), quartz (~30 %), biotite (~20 %), K-feldspar (< 5 %), and accessory ilmenite, rutile, monazite, apatite, and zircon.
Zircon crystals are subhedral or rounded, 100–200 µm in size and display a length/width ratio between 1:2 and 1:3. The CL images usually show a blurred oscillatory zoning, locally interrupted by a thin (~10 µm) bright rim (fig. 20C). The oscillatory zoning suggests an initial magmatic crystallisation, the rounded feature of the crystals point to subsequent sedimentary reworking and the blurred texture points to a metamorphic overprint. Fifty spots analysed in the blurred oscillatory zoned crystals yield mostly concordant results with high Th/U in the range 0.28–1.1. In the Wetherill diagram, most crystals plot between ca. 520 and 380 Ma (fig. 20C). Because of the spread along the concordia curve, the data are also shown in a ‘relative density plot’ where nineteen spots define a peak at ca. 410 Ma corresponding to a weighted mean 206Pb/238U date of 412.5 ± 2[8.5] Ma (MSWD = 1.2; Y261B). Nine younger spots range between ca. 410 and 380 Ma. The ca. 520–420 Ma dates can be considered as the age of detrital zircons, but it is unclear whether the Devonian cluster of ca. 410–380 Ma represents a maximum depositional age or the crystallisation age of the melt in the migmatite.
4.4.4. Y259 – Tourmaline tonalite sill
The sample Y259 is a weakly deformed tonalite sill parallel with the lithological layering (SMain) in the migmatite. It is composed of plagioclase (~60 %), quartz (~20 %), biotite (~10%), K-feldspar (< 5 %), tourmaline (2%), and accessory ilmenite, apatite, and zircon.
Zircon crystals are subhedral, typically 200 µm in size with length/width ratio between 1:1 and 1:4. CL images of most crystals show a dark homogeneous core with faint outer brighter zones and rare ones display a brighter core with a blurred zoning pattern (fig. 20D). Most of the data are concordant, plot as two clusters at ca. 350 Ma and ca. 290 Ma (fig. 20D). All the spots display a very low Th/U < 0.005 regardless of the date. Seven analyses, including the spots from the cores, define a main cluster with a concordia date of 347.5 ± 3[7.5] Ma (MSWD = 0.83; Y259). Four analyses form a secondary cluster with a concordia date of 290 ± 4[7] Ma (MSWD = 0.34). Despite the very low Th/U ratio suggesting a metamorphic nature of the zircons, the magmatic protolith of the deformed sill indicates that a magmatic origin of the Carboniferous zircon and a metamorphic nature of the Permian one are most likely.
5. INTERPRETATION
5.1. P–T evolution
In this section, the P–T evolution is summarised (fig. 21) and discussed to assess the uncertainty relative to each segment of the P–T path. The micaschists display many petrographic similarities and are consequently discussed together.

5.1.1. Garnet-staurolite-sillimanite and garnet-staurolite-kyanite-sillimanite micaschist
The P–T paths determined in the micaschists involve three metamorphic stages, M1, M2, and M3. In general, the consistency of the P–T estimations between the two samples and those of Sukhorukov et al. (2016) suggests the robustness of the results.
M1 corresponds to an initial increase of P and T from ~3–4 kbar, 525–550 °C to ~5–6 kbar, 550–600 °C, documented by partial assemblages in garnet 1 and its compositional zoning. Garnet 1 in the g-st-ky-sill micaschist D241 displays a high-Y annuli, a feature previously correlated with the crossing of the staurolite isograd (see Corrie & Kohn, 2008). In agreement, the isopleths for garnet 1 overlap the staurolite-in line, yet the pseudosection modeling indicates that most of M1 occurred in the chlorite stability field.
Between M1 and M2, a pressure increase to 6–7 kbar is suggested by the compositional difference between garnet 1 rim and the inner garnet 2, as well as by rutile in the mineral ring of garnet from the g-st-sill micaschist L267. The atoll morphology of garnet can be accounted for by several mechanisms (Godet et al., 2022; Kulhánek et al., 2021; Robyr et al., 2014; Štípská et al., 2014, and references therein). A detailed discussion of these mechanisms is outside the scope of this study. Yet, even if significant dissolution of garnet core is often involved in the formation of atoll garnets (e.g., Kulhánek et al., 2021), it does not need to be so (e.g., Godet et al., 2022). The latter study suggested that an interruption of garnet growth along a segment of the P–T path can result in the formation of the atoll morphology. In the present case, garnet 1 is systematically euhedral, and garnet 2 has low Mn-content, which does not support significant dissolution of the garnet core. On the other hand, garnet growth interruption can be accounted for by a P–T path with limited cooling along the line ‘-g’ in figure 10 and figure 12.
M2 corresponds to an isobaric heating documented by the destabilisation of chlorite included in the inner garnet 2 (g-st-sill micaschist L267; fig. 6D), and by the appearance of staurolite in textural equilibrium with the outer garnet 2. As mentioned previously, while it is possible that the g-st-ky-sill micaschist D241 reached the staurolite isograd during M1, the systematic textural equilibrium observed between staurolite and garnet 2 suggests that M2 was the main staurolite-bearing metamorphic stage. The assemblages and outer garnet 2 compositions of both samples indicate identical conditions of the pressure peak of ~7–8 kbar but support different peak temperatures of ~625–650 °C (g-st-sill micaschist L267) and ~650–675 °C (g-st-ky-sill micaschist D241).
M3 was related to a decompression below 6–7 kbar, indicated by the growth of sillimanite and the slight XFe and spessartine increase observed at the very rim of the garnet crystals.
5.1.2. Garnet-kyanite-sillimanite migmatite
The P–T evolution of the g-ky-sill migmatite K263 is characterised by M1, M2, and M3. M1 is documented by the composition and inclusion content of garnet core, pointing to ~550 °C and ~6 kbar. The anhedral shape of the inclusion-rich garnet core (fig. 8C) potentially indicates resorption before the growth of the inclusion-free garnet rim. Given the high-temperature character of the sample, the observed smooth compositional zoning across the sharp optical interface could result from diffusional relaxation (e.g., Ague & Baxter, 2007). In this condition, significant modification of garnet core composition is likely. Yet the compositional isopleth for spessartine and grossular shows that even if Mn and Ca diffused toward the rim, garnet would have crystallised at even higher pressure and lower temperature. Thus, exact P–T conditions are inaccessible, but garnet core composition and small inclusions remain compatible with a prograde subsolidus origin.
Due to diffusion, garnet zoning cannot be used to constrain the detailed shape of the P–T path between M1 and M2 (dashed line in fig. 21). Furthermore, diffusion limits our ability to determine the composition fractionated by garnet and thus to estimate the effective bulk composition, especially during M2. In this case, we used the measured bulk composition modified with a limited amount of H2O, which remains the most unbiased approximation. M2, documented by the inferred former presence of melt, kyanite inclusions, rutile, and garnet 2 correspond to the peak P–T conditions modelled around ~750 °C and ~9 kbar. This suggests partial melting of the lower crust. Even if garnet fractionation could be accounted for, it would most likely not modify the topology of the pseudosection to a point that it becomes incompatible with this conclusion, which may, therefore, be considered robust.
M3, marked by the conspicuous replacement of kyanite in the matrix and the inferred appearance of ilmenite, occurred during decompression. The absence of textures indicating fluid-driven back-reactions (e.g., Waters, 2001) suggests that melt was lost at the peak conditions. Therefore, the efficient replacement of kyanite by sillimanite in the matrix suggests that M3 initially occurred while melt was still present and implies an isothermal decompression down to 700–775 °C and 5–6 kbar before cooling. Cooling is documented by the crystallisation of melt, later appearance of chlorite, and slight XFe and spessartine increase in garnet rim (e.g., Florence & Spear, 1991).
5.2. P–T–t evolution
5.2.1. Garnet-staurolite-sillimanite and garnet-staurolite-kyanite-sillimanite micaschist
The results of monazite dating in both micaschist samples are consistent and disclose a first-order textural control on the U-Pb results. In both cases, monazite included in garnet 1 is Carboniferous (ca. 350–330 Ma) while those in other textural positions are early Permian (ca. 290–275 Ma).
In g-st-ky-sill micaschist D241, monazite crystals are not randomly distributed in garnet 1 but systematically associated with the high-Y annuli (fig. 18A, C). Previous studies reported a similar mode of occurrence of monazite in garnet (Kohn & Malloy, 2004), which was interpreted as the result of prograde metamorphic reaction(s) (Corrie & Kohn, 2008). Recent studies showed that monazite can remain largely inert during metamorphism, which can hamper the direct attribution of a monazite date to the growth of its garnet host (e.g., March et al., 2024; Thiessen et al., 2019). However, these studies addressed the response of monazite in H2O-undersaturated granulite-facies rocks while countless studies of subsolidus prograde metapelites conclude that monazite grows or recrystallises, likely in the presence of a fluid, during the prograde P–T path (Štípská et al., 2015 and references therein). Monazite in garnet 1 is accordingly interpreted as the crystallisation product of prograde metamorphic reactions during M1-mic. In g-st-sill micaschist L267, the single monazite analysis in garnet 1 (207Pb-corrected 238U/206Pb date of ca. 330 Ma) cannot be interpreted as a metamorphic age. In g-st-ky-sill D241, the perceptible spread of the U–Pb data and the relatively high MSWD of 3.2 suggest partial reopening of the U-Pb isotopic system, possibly related to the subsequent Permian metamorphism. Consequently, the Carboniferous ca. 340 Ma date from g-st-ky-sill micaschist D241 is interpreted as the minimum crystallisation age of the monazite during M1-mic.
The U-Pb dates from crystals in other textural positions spread from ca. 300 Ma to ca. 275 Ma but do not reveal a clear textural control (fig. 19). Nevertheless, monazite crystals included in garnet 2 and staurolite are texturally related to M2, whereas those associated with sillimanite are texturally associated with M3, indicating that monazite could be affected by both events. In agreement, monazite crystals show a patchy zoning typical for recrystallised monazite (see Bosse & Villa, 2019, and references therein). The larger spread of the GdN/YbN in D241 than in L267 is correlated with the amount of sillimanite, suggesting that monazite effectively reacted during M3. In agreement, in D241, the spread GdN/YbN is limited in monazite crystals fully enclosed in M2-porphyroblasts but prominent in crystals opened to the matrix. Furthermore, in the same sample, GdN/YbN is negatively correlated to Y-content, suggesting that garnet was a competitor for HREE and Y (Skrzypek et al., 2018 and references therein). In this context, the trace element and textural data can be reconciled if monazite inclusions (re)crystallised early during M2 and progressively recrystallised or were modified later, when more garnet was present in the rock, during M3. Importantly, garnet resorption observed in the vicinity of sillimanite during M3 (fig. 6G) is a rare feature, only observed once, suggesting that release of HREE and Y during M3 did not significantly affect the bulk rock trace element budget. Finally, the moderately high MSWDs of 1.5–1.7 for the calculated dates are compatible with a limited overdispersion and progressive monazite recrystallisation. Hence, the geochronological data suggest a Permian (ca. 285–280 Ma) quick metamorphic continuum between M2 and M3.
5.2.2. Garnet-kyanite-sillimanite migmatite
Monazite in the sample K263 is found in several textural positions. It is included in coarse quartz and plagioclase (fig. 17E and F), which contain kyanite inclusions (fig. 7G). Monazite is also included in biotite, marking the main foliation with sillimanite. In biotite, the shape of the Y-rich rim of monazite is texturally controlled by biotite cleavage (fig. 17B), suggesting contemporaneous growth. Finally, monazite is common along grain boundaries (fig. 17D) where interstitial melts crystallised. These positions suggest monazite existed at the peak-pressure conditions and during decompression. In a range of P and T relevant for our study, a significant monazite amount can effectively survive partial melting in metagreywacke (Yakymchuk & Brown, 2014). Furthermore, monazite contains inclusions of apatite or overgrows apatite crystals (fig. 19C, G), thus apatite dissolution possibly favoured the preservation of monazite above the solidus (e.g., Wolf & London, 1995; Wolfram et al., 2017). Trace element data from the core of monazite crystals included in biotite show, like in the micaschist sample D241, a negative correlation between GdN/YbN and Y, suggesting a prograde origin during garnet growth. Lower GdN/YbN and higher Y of the core of monazite in the leucosome suggest that the effect of garnet fractionation was less important in the leucosome. Compared to the monazite core, higher Th/U in the rim is compatible with (re)crystallisation of the rim at higher temperature (e.g., Williams et al., 2022). Furthermore, the low GdN/YbN and high-Y of monazite rim may be tentatively explained by interaction with a melt enriched in Y and HREE due to garnet dissolution (e.g., Závada et al., 2021), which may be accounted for by the isothermal decompression M3.
Monazite core-rim chemical zoning indicates two genetic periods apparently at odds with the homogeneous U-Pb results. The rim usually displays a patchy texture (fig. 17), which could result from coupled dissolution-precipitation in the presence of melt (e.g., Varga et al., 2020). According to the same study, recrystallisation can result in a decoupled behavior of U-Pb and trace elements, but the variable reincorporation of components from the dissolved crystal would result in the preservation of an inherited isotopic signature. In nature, this usually results in a spread of the isotopic data (e.g., Didier et al., 2014; Weinberg et al., 2020), which is not observed here. Therefore, the tightly clustered U-Pb results obtained in monazite core and rim (fig. 19) suggest a close spacing in time of the two (re)crystallisation events, at a scale unresolvable by the dating method.
In agreement, the concordia U-Pb date 283.5 ±1[6] Ma (MSWDC+E = 1.4) and the equivalent mean 206Pb/238U date (283.5 ± 1[6] Ma; MSWD = 1.1) are interpreted as the age of decompression between M2 and M3. The tight cluster of U-Pb data obtained in the monazite core and rim is somewhat in agreement with the isothermal decrease of pressure between M2 and M3, suggesting a rapid decompression.
6. DISCUSSION
Along the studied section, the prograde and retrograde character of the micaschist and sillimanite-gneiss, respectively, indicate the location of a major structural boundary. The prograde metamorphic evolution of the micaschist is tracked relatively clearly by mineralogical changes and garnet zoning. On the other hand, a polyphase metamorphism in the migmatite complicates the relationships between the structures, metamorphism, and ages. The discussion is introduced with a summary on the development of migmatite domes in the Mongolian Altai. In this frame, we then discuss the geological evolution of the micaschists and migmatite, and finally propose a petrological model for the development of the Barrovian metamorphic sequence.
6.1. Devonian-Carboniferous and Permian orogenic cycles affecting the Altai Wedge
A main geological feature of the Altai Belt is the contrast between low- to medium-grade metasediments in the north and migmatite with abundant igneous rocks in the south (e.g., Badarch et al., 2002). Commonly, the metamorphic envelope of the high-grade complex exposes “Barrovian” garnet-staurolite micaschist (Jiang et al., 2015; Kong et al., 2022; Sukhbaatar et al., 2022), and the sillimanite and cordierite migmatite core features xenomorphic kyanite and/or staurolite inclusions (e.g., Burenjargal et al., 2014; Jiang et al., 2015).
In the Chinese Altai, the study of high-grade dome structures by Wang et al. (2021) and Kong et al. (2022) documented an originally subhorizontal migmatitic foliation S1 variably folded and transposed into a vertical cordierite-bearing foliation S2. Xenomorphic inclusions of staurolite and kyanite are interpreted as part of an older Ordovician or Silurian metamorphism (Jiang et al., 2019, 2022). Geochronological results of migmatites and granites cogenetic with the different structures indicate that S1 is ca. 410 Ma old, S2 is ca. 405 Ma and cross-cutting dikes are ca. 380 Ma, thus indicating a purely Devonian age for the dome formation. Similar structures occur in the Chandman Massif of the Mongolian Altai (Broussolle et al., 2015), but there, the age of horizontal fabric is constrained at ca. 360 Ma while the vertical transposition D2 was dated at ca. 350–345 Ma by syntectonic granite sheets (Lehmann et al., 2017). The age difference between these two locations is understood as the eastward propagation of a single tectonic event (Aguilar et al., 2024; Kong et al., 2022).
In contrast to the monocyclic Devonian to Carboniferous formation of domes, the study of Sukhbaatar et al. (2022) documents two partial melting events preserved in a single migmatite dome. The main migmatitic foliation was originally subhorizontal and was subsequently folded by upright folds with a horizontal axis. Rare low-strain domains in nebulitic migmatites preserve an older folded migmatite fabric, indicating two partial melting events. Zircon from a paragneiss sampled in the migmatitic core yields Devonian (ca. 420–375 Ma) and Permian (ca. 270 Ma) ages, documenting a strong Permian reworking of the Devonian migmatite. During the Permian, a renewed extensional event resulted in local extensive remobilisation of the Devonian infrastructure (Sukhbaatar et al., 2022). The latter study indicates that the Permian migmatite fabric was folded by upright folds during the late Permian to Triassic. In essence, the two superposed Devonian-Carboniferous and Permian extensional and contractional cycles resulted in similar structures and metamorphism.
6.2. Deformation, metamorphism, and temporal evolution of the Gegetin Gol section
Phyllite of the Northern Domain grades into micaschist of the Central Domain, suggesting their derivation from the same Ordovician (ca. 460 Ma) sedimentary protolith (Kröner et al., 2010). A major tectonic boundary is identified at the contact between the micaschist and sillimanite gneiss (fig. 21).
6.2.1. Devonian-Carboniferous metamorphism and deformation
In the studied micaschist, M1-mic corresponds to an increase of pressure initially associated with temperature increase, and then, either isothermal or related to a slight cooling (fig. 21). Furthermore, garnet 1 crystallised at low pressure and moderate temperature, indicating an elevated thermal state at the onset of M1-mic. Monazite included in garnet 1 indicates the minimum Carboniferous age of this metamorphic event (ca. 340 Ma; fig. 19). Isothermal pressure increase can be tentatively explained by magma loading, whereby rapid magma over-accretion buries underlying rocks (Brown & Walker, 1993; Connop et al., 2024; Wells, 1980). However, the age of metamorphism, ca. 340 Ma or slightly older, correlates with the end rather than the peak of a major magmatic event in the Mongolian Altai (410–350 Ma, e.g., Cai et al., 2015). In addition, the 3–4 kbar pressure increase would require the emplacement of large batholiths, which are absent higher in the studied section.
In the Mongolian Altai, several authors reported an upright folding of high-temperature horizontal fabrics related to an early Carboniferous compression (Broussolle et al., 2015; Lehmann et al., 2017). In the studied section, Devonian migmatites (Y261A) may also evidence a thermal event shortly preceding the Carboniferous compression. In the context of a weak crust, crustal shortening results at broad distances in distributed thickening (e.g., Cagnard et al., 2006; Pitra et al., 2010; Schulmann et al., 2002). Therefore, the M1-Mic pressure increase could be explained by magma loading, homogeneous thickening of the crust, or a combination of both.
In this study, the fabrics associated with the Carboniferous compressional event were not observed in the micaschist, neither at the macro- nor at the micro-scale. However, an early metamorphic fabric in the micaschist preserved as sigmoidal inclusion trails in garnet 2 was reported by Sukhorukov et al. (2016), and here referred to as Srelic. The inclusion trails most likely represent the folded remnants of Srelic trapped at the onset of the main deformation during the growth of garnet 2. These findings agree with the preservation of the early foliation deformed by recumbent folds in low-strain domains in otherwise mylonitic amphibolites (fig. 4D). The lack of relics of Srelic fabric in the micaschist possibly results from grain coarsening of the matrix crystals during the prograde metamorphism, leading to complete obliteration of previous fabrics.
6.2.2. The Central Domain - Permian extensional shear zones
In the micaschist samples, coarser garnet and staurolite porphyroblasts grew in the neck zones boudins during D2. Although Sukhorukov et al. (2016) showed a picture of staurolite porphyroblasts containing inclusion trails at high angle with the external fabric, our samples show the continuity of the internal and external foliation of staurolite (fig. 6A and E). Macroscopic field and microstructural observations are thus compatible with syn-tectonic growth of the Barrovian assemblages.
M2-Mic indicates an isobaric heating (fig. 21; Sukhorukov et al., 2016), a P–T path compatible with syn-metamorphic intrusions (e.g., Spear et al., 1984). Numerous granitoid sills are either parallel with the main metamorphic foliation Smain (fig. 4A), boudinaged or folded, suggesting their syntectonic emplacement. Monazite included in syn-D2 garnet 2 and staurolite yield an early Permian U-Pb age (288 ±1.5 [6] Ma) similar to that of a foliated granite sheet of the Central Domain (296 ± 2 [6] Ma; Kröner et al., 2010), confirming the close temporal relationship between magmatism and short-lived metamorphism.
Sillimanite overprint typifies subsequent M3 decompression. Monazite located in domains recrystallised during M3 ages undistinguishable from that related to M2, emphasising the close progressive and short-lived nature of M2 and M3. This is also compatible with the zircon U-Pb age of ca. 290 Ma dike cutting the D2 fabric (fig. 20D).
In contrast to the prograde character of Smain in the micaschist, Smain in the sillimanite gneiss transposes a former migmatitic foliation (fig. 4D), indicating a major boundary between the two domains. In general, important grain-size variations occur in the micaschist and the sillimanite-gneiss. The grain-size variation is correlated to the intensity of D2 transposition (compare fig. 4C and D), suggesting important deformation gradients typical for strain partitioning (Bell, 1981). Strain gradients are generally concentrated in simple shear-dominated mylonite zones reworking the Central Domain (Smain-SZ in fig. 21), as also mentioned by Sukhorukov et al. (2016). Recumbent folds (Frec) preserved in low-strain domains (fig. 4E) are compatible with a dominant vertical shortening component. Field and microstructural observations can be collectively interpreted as D2 deformation partitioning between low-strain pure shear-dominated domains and zones of intense simple shear (Bell & Rubenach, 1983). Altogether, the Central Domain can be interpreted as a highly partitioned normal shear zone where heat was presumably advected by magmatic pulse(s).
In general, spatial length and time scales of a thermal anomaly correlate well. For a typical crustal thermal diffusivity value (10-6 m2s-1), a thermal anomaly smaller than the size of a normal crustal thickness (~30 km) lasts less than 10 Myr, and the resulting metamorphism may be regarded as ‘short-lived’ metamorphism (Viete & Lister, 2017). In the studied area several observations are compatible with local and short-lived thermal perturbation related to magmatic intrusions: 1) the sharp (3–5 km) metamorphic gradient between the fine-grained bi-phyllite and coarse sill-gneiss; 2) the correlation between the staurolite-kyanite and sillimanite isograds and the locations of intrusions (fig. 2); 3) the geochronological data for M2, M3 and syn- to post-tectonic indicating a 10 Myr maximum thermal event, between ca. 295–285 Ma. This is compatible with the preservation of compositional breaks at a scale of <50 µm in garnet (fig. 8), also suggesting that near-peak metamorphism was short-lived (likely <5–10 My; Caddick et al., 2010). Altogether, the data indicate a short-lived metamorphism largely driven by the thermal anomaly induced by the intrusions of multiple magmatic sheets and dikes in the extensional shear zone.
6.2.3. Evolution of the Southern Domain
The Southern Domain located in the footwall of the extensional shear zone underwent a polyphase evolution evidenced by distinct sets of leucosomes (fig. 5E), isoclinal folding of the migmatitic foliation (fig. 5D) and the variety of ages obtained in zircons with igneous textures (fig. 20). It is unclear whether the protolith of the g-ky-sill stromatic migmatites K263 and Y261B was an early Paleozoic or a Devonian sediment, for example the ca. 410 Ma age peak from zircon core in Y261B may represent the maximum depositional age of the protolith or the age of a partial melting during metamorphism. As such, the inclusion-rich garnet 1 documents an undated prograde metamorphism. The sharp optical discontinuity between garnet core and rim can be interpreted in terms of resorption, in which case the prograde metamorphism could be much older than the main Permian event M2.
The ca. 380–375 Ma thermal event documented by the diatexite Y261A corresponds to the protolith age of orthogneiss (ca. 360 Ma; Helo et al., 2006) and a partially molten tonalite gneiss (ca. 385 Ma; Kozakov et al., 2023). Carboniferous zircon core from the tonalite sill Y259 documents a subsequent thermal event, possibly magmatic. Such Devonian to early Carboniferous magmatic ages are typical for the Mongolian Altai (e.g., Burenjargal et al., 2012; Cai et al., 2015; de Hoÿm de Marien et al., 2025; Jiang et al., 2012).
The nature of the Permian metamorphism is documented by the g-ky-sill migmatite K263 sample indicating a suprasolidus nearly isothermal decompression from 9 to 4–7 kbar at 700–750 °C, followed by cooling below the solidus (fig. 21). The homogeneous Permian ca. 285 Ma date obtained in monazite related to kyanite, and syn-folial sillimanite and biotite indicate the age of the decompression and the development of a shallow-dipping foliation (fig. 21). Subsequent horizontal shortening is documented by upright folds with horizontal hinges (fig. 5A) while rare recumbent folds have an unclear origin.
6.3. Tectonic interpretation
Sukhorukov et al. (2016) previously interpreted the P–T path of the micaschists in terms of overthrusting without the addition of heat. This interpretation has a theoretical background (see England & Thompson, 1984), however, the isobaric heating in these numerical models results from a 20 Myr period of thermal relaxation before erosion begins. Ryan and Dewey (2019) quoted this initial condition as an important caveat of the model. Our data (fig. 21) indicate that isobaric heating is related to the emplacement of magma in a shear zone that accommodated the exhumation of migmatite. Exhumation of migmatite by a normal shear zone focusing the magmatic activity is a typical characteristic of metamorphic core complexes (Vanderhaeghe et al., 1999). In this context and agreement with the study of Sukhbaatar et al. (2022) and Lexa et al. (2025), our P–T data suggest that the studied location corresponds to a moderately deep section (10–20km) of a metamorphic core complex.
While the general tectonic context of this extension is not fully understood (see Hanžl et al., 2023; Kozlovsky et al., 2015 for contrasting interpretations), a Permian metamorphic core complex is compatible with the widespread occurrence of rift zones in Mongolia (Kovalenko & Chernov, 2008; fig. 1). The basins are filled with volcanoclastic series including bimodal volcanics (Kozlovsky et al., 2005) and continental sediments (e.g., Buriánek et al., 2012). All these elements argue in favour of a late Carboniferous to early Permian lithospheric extension localised along pre-existing tectonic boundaries (Kovalenko & Chernov, 2008) and partially molten domains (Lexa et al., 2025; Sukhbaatar et al., 2022). Late Carboniferous (ca. 320 Ma) mantle-derived gabbroic plutons near the study area suggest a contribution of the mantle to the Permian thermal event (Buriánek et al., 2016).
6.4. Metamorphic core complex, regional extension, and Barrovian metamorphism
A seminal study by Viete et al. (2010) demonstrated that lithospheric extension associated with magmatism can account for the regional Barrovian metamorphism of the Scottish Highlands. According to the same study, the Barrovian sequence is located in the footwall of a detachment. This position contrasts with the structural position of the Barrovian metamorphic sequence studied here, located within the detachment zone, close to the hangingwall low-grade rocks. Below, we propose a new petrological and tectonic model to account for our observations.
Field studies in collapsed orogens indicate two successive regimes of extension, with the initial development of metamorphic core complexes evolving later into a wide rift system (Coney, 1987; Gautier et al., 1999). During the core complex stage, extension is controlled by a main detachment fault rooted in the ductile crust (e.g., Brun et al., 2018; Brun & van den Driessche, 1994). It remains so as long as the flow of the ductile crust towards the growing core complex accommodates the horizontal stretching (Tirel et al., 2006). In this context, the ductile crust is exhumed below the detachment, whereas little vertical movement occurs in the hangingwall. As the extension proceeds, active thinning of the crust above the Moho (Tirel et al., 2008) promotes decompression melting of the mantle (e.g., Sonder et al., 1987), inducing widespread crustal melting and magmatism (Poujol et al., 2016; Vanderhaeghe et al., 1999; Wernicke et al., 1987). The growth of a metamorphic core complex results in rapid exhumation of a large volume of hot lower crust to the upper crust (Teyssier & Whitney, 2002), inducing isothermal decompression and heat advection in shallow crustal levels (Rey et al., 2009a, 2009b). The combined effect of exhumation of the hot lower crust and syntectonic magma intrusions in the detachment during the growth of the dome can effectively advect heat vertically and laterally and influence the thermal evolution of the metamorphic envelope. To construct the petrological model of development of the Barrovian metamorphism in an extensional shear zone, we overlaid our P–T data on the model of asymmetric growth of a core complex resulting from a rolling hinge process of Brun and van den Driessche (1994).
At the initial stage (fig. 22A), P–T conditions for the micaschists (blue arrow in P–T diagram) and migmatite (orange arrow) align along an apparent thermal gradient of 20–25 °C/km. The micaschists (blue dot in tectonic sketches) belong to the ductile middle crust, and the migmatite (orange dot) to the partially molten lower crust. A normal fault initiates at 60° in the upper crust and progressively flattens in the ductile middle crust down to a décollement layer located at the boundary with the lower crust. Upward motion of the footwall causes an equivalent uplift of migmatite juxtaposed to the hangingwall ductile middle crust of the hangingwall, where heat can be transferred laterally by conduction. During this stage, the migmatite cools down while the middle crust heats up. The shear zone localises the flow of magma, as shown by the abundant granitoid dikes and sheets observed in the Central Domain (fig. 21). Structurally and magmatically induced advection of heat results in upward and lateral migration of the temperature isograd, and formation of an abnormally hot, thermally perturbed wedge in the hangingwall of the fault (fig. 22A).
As extension proceeds (fig. 22B), rollunder occurs in the footwall and causes a rotation of the fault to a lower angle (e.g., Buck, 1988; Wernicke & Axen, 1988). The segment of the fault that becomes flat no longer accommodates extension, and a new fault is created in the hangingwall (Brun & van den Driessche, 1994; Buck, 1988). Slices of rocks from the hangingwall are thus transferred in the normal shear zone; in turn, the thermally perturbed wedge progresses in the hangingwall undergoing isobaric heating. At this stage, the magma emplaced in the shear zone certainly plays a critical role in heating the hangingwall. Meanwhile, partially molten rocks flow towards the dome where melts crystallise in the dome apex.
Continued extension causes further exhumation of migmatite and further migration of the active shear zone (fig. 22C). Slices of the brittle and ductile crust from the hangingwall are incorporated into the footwall of the shear zone, resulting in exhumation of the ductile crust that was previously heated. Eventually, the dome migmatites and shear zone micaschists are juxtaposed (fig. 22D).
The inset in figure 22D shows an idealised geological section reproducing our observations at the final stage of the model. The high-strain zone controlled the position of the magmatic intrusions, which, in turn, controlled the location of the metamorphic gradient developed between the phyllites (in green) and the variably deformed migmatites (orange and brown). The core of the shear zone hosts the micaschists (in blue) that exhibit the relics of a Barrovian sequence formed during the earlier extensional stages.

7. CONCLUSION
In the valley of the Gegetin Gol river in the Mongolian Altai, a sharp partial Barrovian-type field metamorphic gradient intervenes between low-grade phyllite and high-grade migmatite zones. The Barrovian assemblages in micaschists do not result from a long-term thermal relaxation during thickening, but instead from 50–100 °C isobaric heating marked by a transition from garnet-chlorite to garnet-staurolite or garnet-staurolite-kyanite assemblages. Heating and subsequent decompression in the field of sillimanite were coeval with the activity of a normal shear zone which focused numerous granitoid syntectonic sheets and dikes. The shear zone accommodated the exhumation of lower crustal rocks typified by the decomposition of kyanite to sillimanite in migmatite. Monazite from the metamorphic rocks and zircon from the magmatic ones indicate the early Permian age (ca. 295–285 Ma) of extension and support a short-lived (~10 Myr) thermal event in the micaschists. The main tectonic contact located between retrogressed migmatite and prograde micaschist indicates that the micaschist initially belonged to the hangingwall of the shear zone, was subsequently incorporated into it, and consequently partially exhumed. This sequence can be explained by the progressive development of a detachment related to the formation of a metamorphic core complex. This study suggests that envelopes of metamorphic core complexes are prone to develop syn-extensional Barrovian metamorphic sequences.
ACKNOWLEDGMENTS
L. de Hoÿm de Marien dedicates this article to the memory of J. P. Brun, with whom a simple question was always the pretext for a rich discussion. This has proven invaluable during the redaction of this article. The implication of P. Pitra, J. van den Driessche, and E. Moulas through discussion is sincerely acknowledged. We thank warmly D. Viete and A. Smye for constructive reviews, as well as M. Brandon and J. Ague for careful editorial handling. This work was supported by the Czech Science Foundation (GAČR EXPRO 19-27682X), internal grant of the Czech Geological Survey, Czechia (number 329805), and the International Partnership Program of the Chinese Academy of Sciences (Grant/Award Number: 132744KYSB20190039).
AUTHOR CONTRIBUTIONS
Luc de Hoÿm de Marien – Data collection, modeling, visualization, original draft, review & editing. Pavla Štípská – Methodology, supervision, modeling, original draft, review & editing. Karel Schulmann – Funding acquisition, conceptualisation, supervision, original draft, review & editing. Andrew Kylander-Clark – Data collection, review & editing. Ondrej Lexa – Funding acquisition, conceptualisation, review & editing. Yingde Jiang – Data collection, review & editing. Petr Jeřábek – Data collection, review & editing. Martin Racek – Data collection, review & editing. David Buriánek – Data collection, review & editing.
DATA AND SUPPLEMENTARY INFORMATION
https://data.mendeley.com/datasets/5pjt9gdbyv/1
Figure S1. FigS1_Petrography_SamplesZrc_small.jpg – Field photographs and thin section photomicrographs of geochronological samples dated by U–Pb zircon LA–ICP–MS method.
Table S1. TableS1_MineralChemistry.xlsx – Representative mineral chemical analyses.
Table S2. TableS2_U-Th-Pb_TE_Mz.xlsx – Monazite U–Th–Pb and Trace Element data.
Table S3. TableS3_U-Pb_Zrn.xlsx – Zircon U–Pb data.
Editor: Mark T. Brandon, Associate Editor: Jay J. Ague