
1. INTRODUCTION
SiO2 is a major component of magmas and its properties affect appreciably their densities and viscosities. Volumetric properties vary with melt composition and accurate predictive models for melt behaviour thus require accurate SiO2 molar volumes (V°SiO2), and partial molar volumes SiO2) of the SiO2 component of melts over a wide range of melt compositions. An understanding of these properties also is required for industrial purposes such as production of glasses and ceramics. SiO2 volumetric properties determine in part their response to thermal and barometric shock, thus affecting durability and reactivity. As for magmas, SiO2 is an essential component of industrial glasses and ceramics in that many of these phases have high SiO2 contents. There is therefore good reason to obtain highly accurate partial molar volumes of SiO2 (and other components) in silicate melts and glasses.
The partial molar volumes of oxide components of silicate melts have been obtained successfully from density measurements by adoption of linear mixing models. (Bottinga et al., 1982, 1983; Bottinga & Weill, 1970; Courtial et al., 1999; Courtial & Dingwell, 1999, 2005, 2006; Dingwell et al., 1988; Ghiorso, 2004; Ghiorso & Kress, 2004; Lange, 1997; Lange & Carmichael, 1987, 1990; Liu & Lange, 2001, 2006). The resulting volumetric properties have been successfully applied to conditions ranging from the earth’s surface to the deep mantle (Agee, 1998; Birch, 1947; Ghiorso, 2004; Ghiorso & Kress, 2004; Guillot & Sarda, 2006; Jing & Karato, 2011; Lange, 1997; Lange & Carmichael, 1987; Rigden et al., 1989; Stixrude & Karki, 2005). Experimental studies nevertheless indicate that non-linear volumetric mixing occurs in some melts for which there are numerous explanations (Bockris & Mellors, 1956; Courtial & Dingwell, 1995; Dingwell et al., 1988; Guo et al., 2013; Jackson et al., 1993; Lange & Carmichael, 1987; Nesbitt & Fleet, 1981; Shiraishi et al., 1978; Toplis, 2001). Although the linear mixing approach has been highly successful, applications generally are restricted to melts no more siliceous than about andesitic composition (SiO2 less than ~70 mole%), in large part because many experimental studies are themselves restricted to melts of intermediate composition (~70–45 wt% SiO2). Density studies containing greater than 70 wt.% SiO2 are few but Knoche et al. (1995) conducted a comprehensive investigation of haplogranitic melts containing ~78 wt.% SiO2. They reported partial molar volumes for 18 oxide components and quoted SiO2 to be 27.3 cm3/mole at 1023 K. Using their expansivity (28.18x10⁻⁶ K-1), SiO2 is 27.8 cm3/mole at 1673 K. Nelson and Carmichael (1979), who measured melt densities containing 35–79 mole% SiO2, obtained a SiO2 value of 27.2 cm3/mole at 1673 K, and Bourova and Richet (1998) obtained a similar value (27.3 cm3/mole at 1670 K) by extrapolating to pure liquid SiO2, the volume-composition trends of silica-rich Na2O-SiO2 and BaO-SiO2 melts. Each of the last three studies focused on highly siliceous melts and the derived SiO2 values were greater than those obtained by the studies of Bottinga et al. (1983), Lange and Carmichael (1987), Lange (1997) and Ghiorso and Kress (2004), who quoted respectively, 26.75, 26.90, 26.86 and 26.71 cm3/mole for SiO2. The SiO2 values extracted from the various studies thus seem to correlate with the SiO2 content of the melts studied. The differences obtained for SiO2 indicate a need to understand better the interactions of components in highly siliceous melts and to refine the partial molar volumes of components in these melts. This study addresses the need.
1.1. Non-ideal mixing in siliceous melts
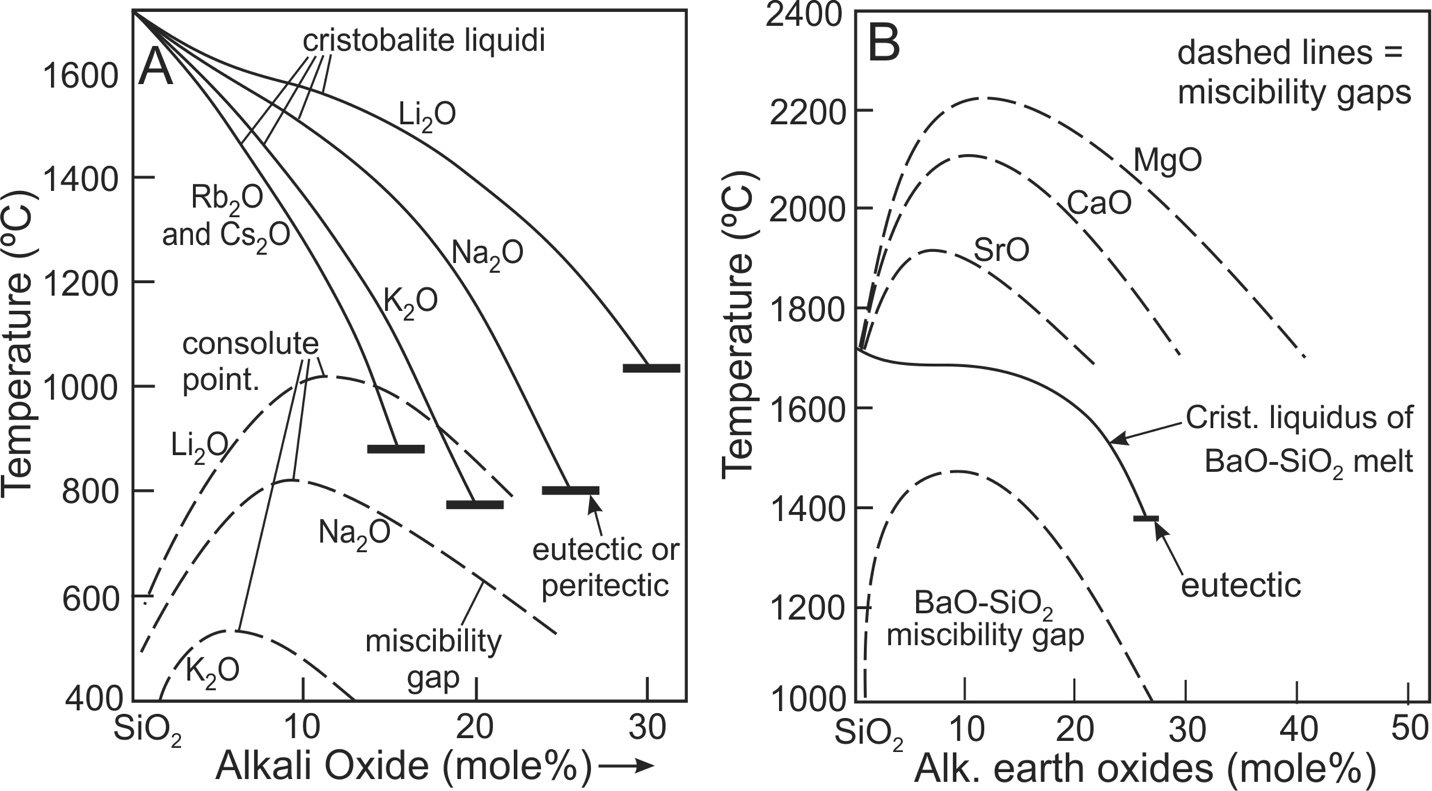
Numerous alkali and alkaline earth melts undergo phase separation (immiscibility) at highly siliceous compositions, as illustrated in figure 1 (Dietzel, 1942; Haller et al., 1974; Hess, 1996; Hudon & Baker, 2002; Kracek, 1930; A. B. Thompson et al., 2007; Veksler, 2004). The effects of non-ideal mixing are evident by the topological changes to cristobalite liquidi in Cs-, Rb-, K-, Na-, Li-, and Ba-SiO2 melts (figs. 1A and 1B; see also fig. 2 of Veksler, 2004). The cristobalite liquidi of Cs2O-SiO2 and Rb2O-SiO2 melts are effectively the same and where composition is plotted on a logarithmic scale, the liquidi are close to linear in melts containing 0 to ~10 mole% Cs2O or Rb2O (Kracek, 1930, his fig. 1). From these observations Kracek (1930) noted that “The coincidence of the curves for rubidium and cesium lends itself to the interpretation that their slopes were very nearly ideal at 100% silica”. On this basis he determined the enthalpy of fusion of cristobalite. Kracek (1930) also noted that the cristobalite liquidus of the K-silicate system displayed an inflection indicative of slightly non-ideal mixing. He further concluded from more pronounced inflections of the cristobalite liquidi that mixing in sodic and lithium melts was distinctly non-ideal. For alkaline earth systems, cristobalite liquidi are generally interrupted by miscibility gaps which is evidence for extreme non-ideal mixing (fig. 1B). The exception is the Ba system whose cristobalite liquidus displays an inflection so pronounced that it approaches horizontal in the region near 90 mole% SiO2 (fig. 1B), pointing to strong non-ideal mixing in the highly siliceous portion of the system. The consolute point temperatures of the miscibility gaps of these systems increase systematically, the order being Cs~Rb<Na<Li<Ba, which is the same order of the increase in the degree of topological inflections in the cristobalite liquidi. The physical-chemical interactions leading to phase separation may also affect volumetric mixing properties in highly siliceous melts and the main objective of this study is to determine if non-ideal volumetric mixing occurs in highly siliceous melts. To this end, we quantify the degree to which non-ideal volumetric mixing occurs. Of the melts so far studied, only the densities of the K-, Na-, Li- and Ba-silicate melts have been determined in highly siliceous melts and these are the focus of the study.
_.jpeg)
2. IDEAL AND NON-IDEAL MIXING
Compositional mixing of homogeneous media may range from simple to complex with ideal volumetric mixing being the simplest. In binary systems, ideal mixing follows the relation:
Vmelt=V∘1X1+V∘2X2
Vmelt is the molar volume of the melt, V°1 and V°2 are the molar volumes of the two (pure) components ‘1’ and ‘2’, and X1 and X2 are the mole fractions of the components. Ideal mixing results in a linear trend joining the molar volumes of the pure melt components (V°1 and V°2) with the molar volumes of all melts of intermediate composition plotting on the linear trend. Equation (1) can be recast by substituting X2= 1-X1. Expanding the expression and by collecting terms, one obtains:
Vmelt=V∘1X1+V∘2(1−X1)=(V∘1−V∘2)X1+V∘2
The equation is that of a straight line of slope (V°1-V°2) and intercept V°2. The form is convenient for fitting experimental molar volumes.
Molar volumes of non-ideal mixtures of components are more complex. Perhaps the simplest treatment of non-ideal mixing is that of the regular solution (Pitzer & Brewer, 1961, p. 282; J. B. Thompson Jr., 1967). Regular solutions mix according to a parabolic relationship (in volume versus melt composition) and they exhibit maximum deviation from ideal mixing at X1 = X2 = 0.50 in binary systems. The difference between the molar volume of a melt and the value calculated assuming ideal mixing is referred to as the excess molar volume of mixing (Vex):
Vex=Vmelt−V∘1X1−V∘2X2
The excess molar volume of mixing for a binary, regular solution is:
Vex=VXX1X2
where VX is a parameter sometimes referred to as the non-ideal mixing constant (Pitzer & Brewer, 1961; J. B. Thompson Jr., 1967). The molar volumes of melts that mix regularly thus follow the relation:
Vmelt=V∘1X1+V∘2X2+VXX1X2
This expression has been used previously to fit experimental melt molar volumes (Dingwell et al., 1988; Lange & Carmichael, 1987). Substitution of X2 = 1–X1 into equation (5) yields, after expansion and collection of terms:
Vmelt=A(X1)2+BX1+C
where
A=VX; B=(V∘1−V∘2+VX); C=V∘2
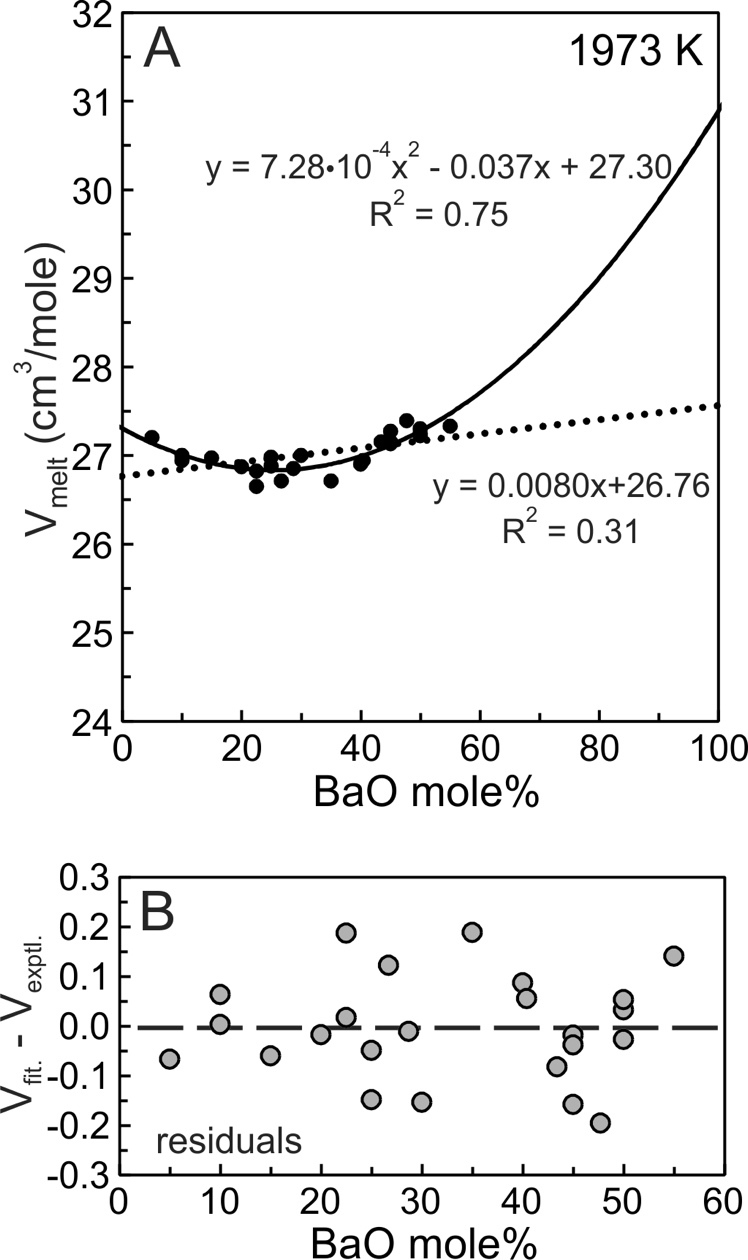
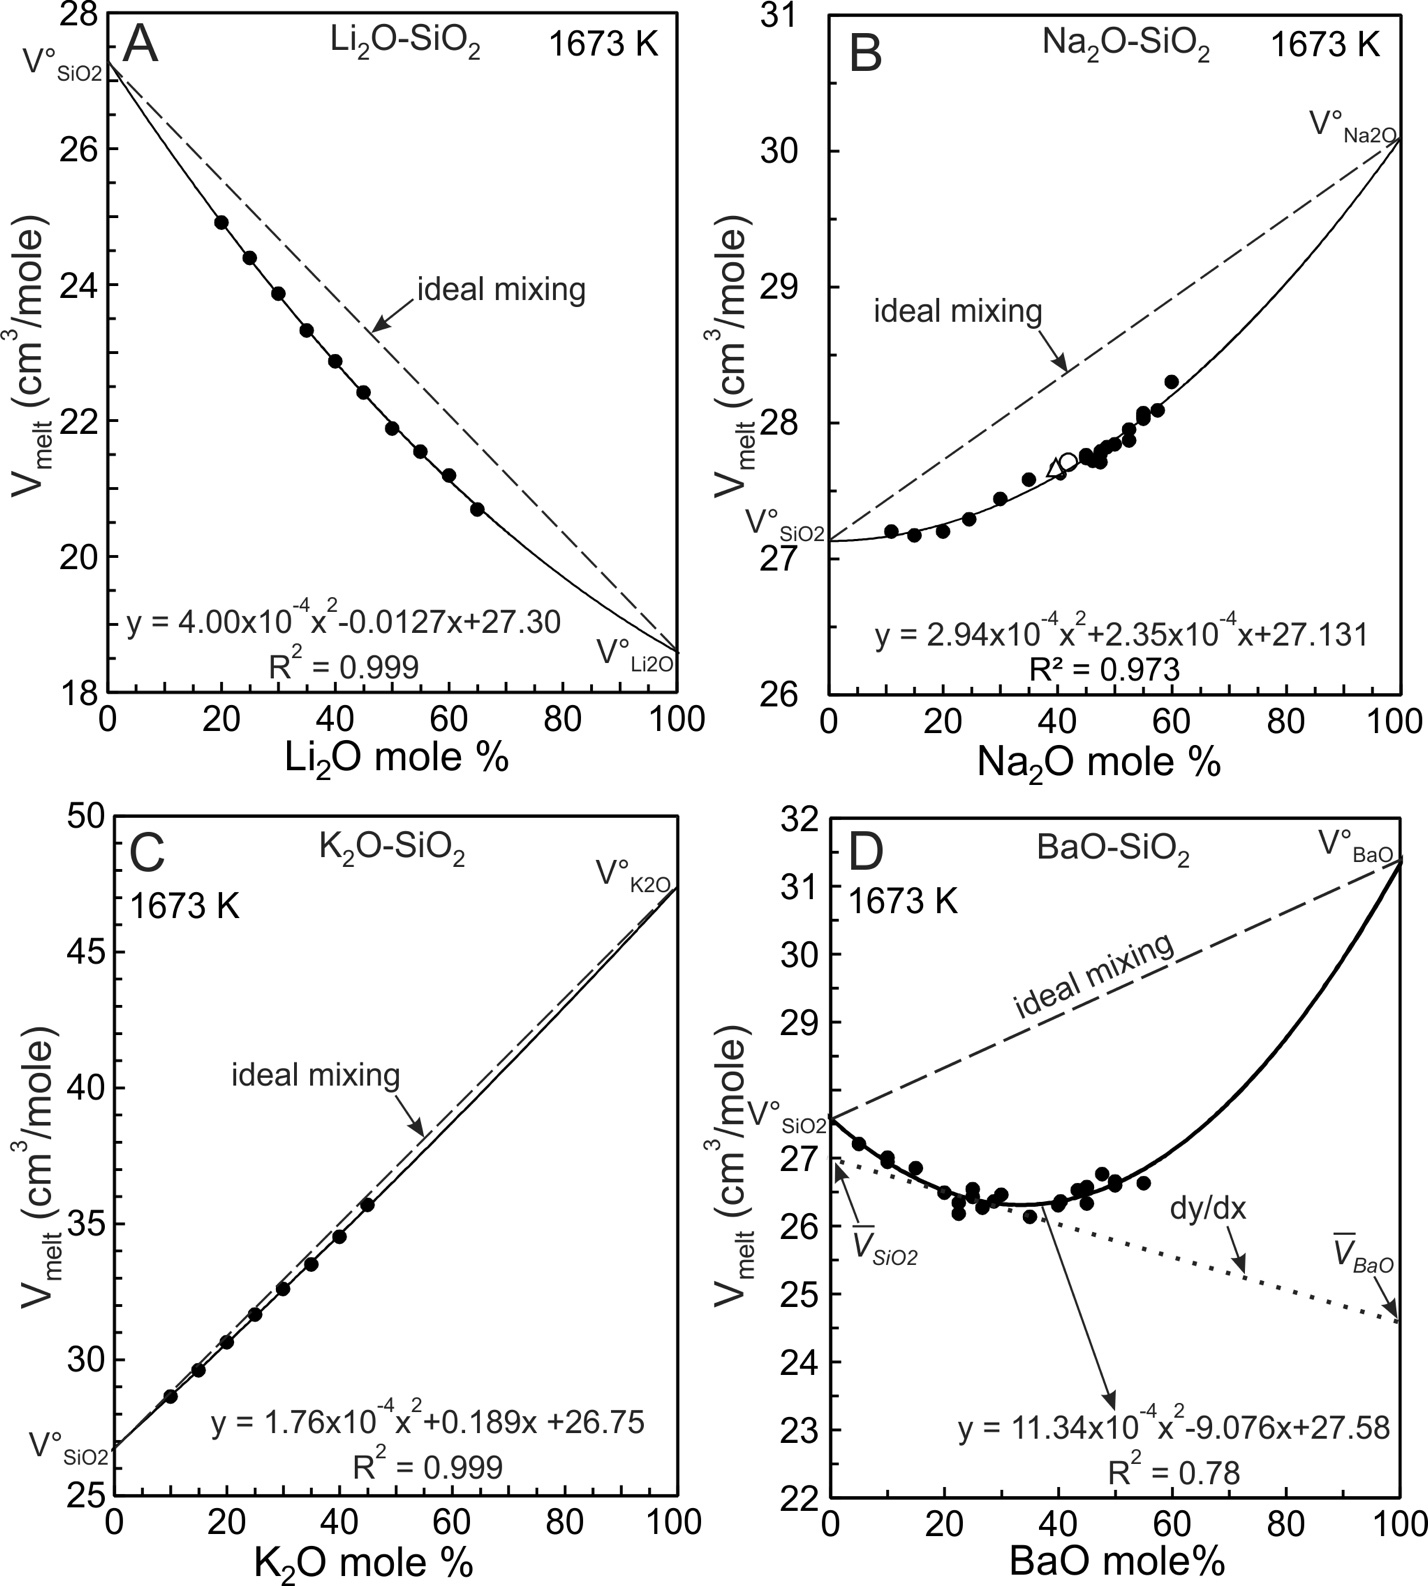
Equations (5) and (6) are entirely equivalent so regression of experimental melt molar volumes using either equation yields identical values for V°1, V°2 and VX. The solid curve of figure 2A is the quadratic fit (eq 6) to the Ba silicate molar volume data.
_melt_molar_volumes_(*v_melt_*)_of_the_bao-sio_2__system_at_1973_k_are_illustrated_as_s.jpeg)
3. FITS TO EXPERIMENTAL DATA
The BaO-SiO2 melt experimental molar volumes (Vmelt) illustrated in figure 2A describe an arcuate, concave upward trend with a minimum near 25–30 mole% BaO. The trend is poorly accounted for by a least-squares fit using the linear equation (1) (fig. 2A, dotted line), as indicated by the coefficient of determination (R2 = 0.31). The quadratic fit using equation (6) is better (fig. 2A, solid curve, R2 = 0.75) in that it reproduces well the arcuate trend of the data. The residuals shown in figure 2B are the differences between values obtained from the quadratic fit (Vfit; fig. 2A, solid curve) and the experimental melt molar volumes (Vexptl) with the residuals equal Vfit-Vexptl. The residuals (fig. 2B) indicate no particular bias of the quadratic fit so that the R2 value (0.75) reflects mostly experimental uncertainty in the measurement of Vmelt. The maximum residual value is ~0.2 cm3/mole. Using a typical Vmelt value of 27.0 cm3/mole (fig. 2A), the maximum residual represents ~0.75% of melt molar volumes, thus the quadratic fit reproduces volumes within 1% of the experimental values. A similar statistical treatment of the other melt systems investigated indicates that fits to molar volumes show no bias and reproduce the experimental values to within 1%. Miscibility in the BaO-SiO2 melt system is distinctly asymmetric (fig. 1) but there is no justification for using a volumetric mixing model more complex than a regular solution, as evident from the residuals shown in figure 2B. This does not imply, however, that volumetric mixing follows a regular solution model. Additional experimental data at greater BaO content would be required to draw such a conclusion.
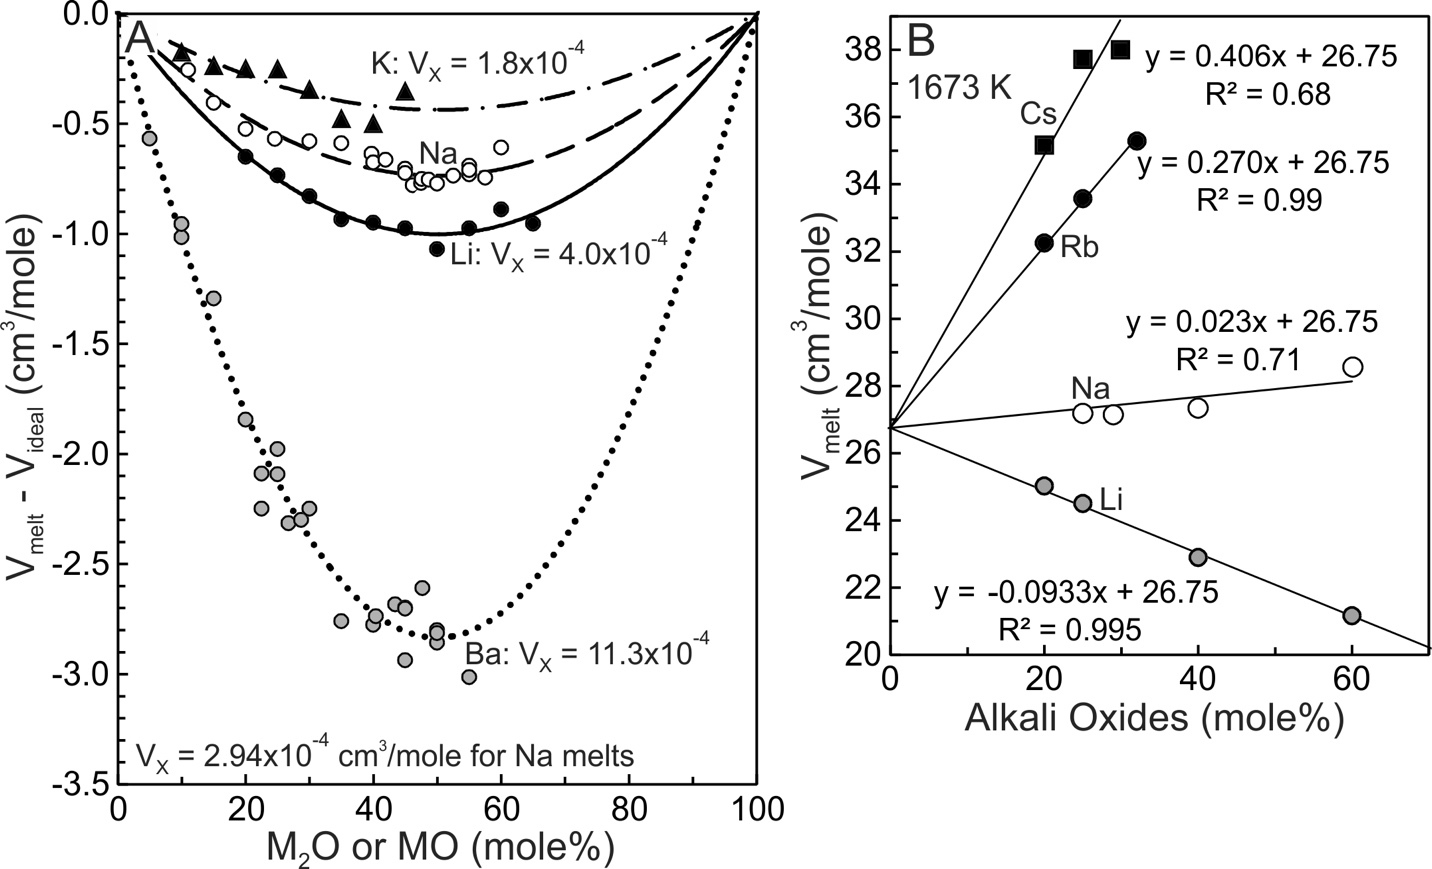
The experimental data for the four melt systems shown in figure 3 were fit using equation 6 and they yield the A, B and C fit coefficients listed in table 1. The molar volumes of the two components, V°SiO2 and V°MO, of each system then were obtained from the A, B and C coefficients using equation (7) and these are plotted on figure 3 at the respective compositional boundaries. The dashed line joining them illustrates the ideal mixing trend for each melt system. Assuming ideal mixing, the molar volume (Videal) was calculated for each composition at which Vmelt had been measured. Videal then was subtracted from the experimental melt volume (Vmelt) to obtain differences (Vmelt –Videal). These are plotted on figure 4A for each system. The Ba melts display the greatest differences and from this it is concluded that they are the most non-ideal with respect to volumetric mixing. Potassic melts are closest to ideal. The conclusion is consistent with the VX values obtained from the quadratic fits, as now emphasized. The ‘A’ coefficient of equation (6) (same as VX of eq 5) is the measure of non-ideality. It decreases from 11.34x10⁻⁴ cm3/mole for Ba melts to a low of 1.76x10⁻⁴ cm3/mole for potassic melts (fig. 3D). Deviations from ideality decrease in the order Ba>Li>Na>K. A consequence of using a quadratic equation to fit molar volumes is that non-ideal mixing contributions are necessarily of a parabolic nature so that maximum deviation from ideality is located at 50 mole% SiO2 (XSiO2 = 0.5).
_difference_between_experimental_melt_molar_volumes_(*v_melt_*)_and_the_volume_of_the_m.jpeg)
4. MOLAR AND PARTIAL MOLAR VOLUMES
The partial molar volumes of SiO2 SiO2) and modifier oxides MO) can be obtained from molar volume measurements (Vmelt) using equations (8), (9) and (10) to solve for SiO2 and MO at compositions where Vmelt has been measured:
Vmelt=¯VSiO2XSiO2+¯VMOXMO
Vmelt is the measured melt molar volume and X represents mole fraction. As shown by the dotted line in figure 3D. The slope (dy/dx) of the molar volume mixing trend at a specified composition is equal to:
dydx=¯VMO−¯VSiO2XMO−XSiO2=(¯VMO−¯VSiO2)/1.0
where XMO = 1.0 and XSiO2 = 0.0. The slope, dy/dx, is obtained at a specified melt composition (XMO) by taking the derivative of equation (6), which is:
dydx=2AXMO+B
The A and B fit coefficients of equation (6) are listed in table 1 and they pertain to the MO mole% scale (see footnote 1 of table 1 to obtain ‘A’ and ‘B’ coefficients for the mole fraction scale). The values for dy/dx for each melt are provided in tables 2 to 5. The solution to the equations yields SiO2 and MO and these are also listed in tables 2 to 5 at each composition for which melt molar volumes were measured.
With respect to equation (10), dy/dx may be obtained from experimental molar volumes using a finite differences approach. By this method, however, large uncertainties in the slopes may be introduced owing to uncertainties associated with individual measurements of melt densities (hence volumes) and to the choice of the compositional ‘step size’ used to obtain finite difference values. One avoids these uncertainties by using the slope (dy/dx) of the best fit quadratic equation (6), where dy/dx is evaluated at compositions for which Vmelt has been measured.
4.1. Molar volume of SiO2 (V°SiO2)
Although liquid SiO2 has a specific V°SiO2 value at 1673 K and 101.3 kPa, the quadratic fits to molar volumes shown in figure 3 yield V°SiO2 values of 26.75, 27.13, 27.30, and 27.58 cm3/mole respectively for the K, Na, Li and Ba systems. These values follow the order of the non-ideal mixing term, VX, of figure 4A, the implication being that non-ideal mixing affects at least some of the retrieved V°SiO2 values. Because the K-silicate melts are closest to ideal (fig. 4A) this system should yield the best estimate of V°SiO2, which is 26.75 cm3/mole. The value is adopted for 1673 K and it is similar to those reported by the comprehensive studies of Bottinga et al. (1983), Lange and Carmichael (1987), Lange (1997) and Ghiorso and Kress (2004). Their values were 26.75, 26.90, 26.86, and 26.71cm3/mole respectively. We emphasize, however, that our adopted V°SiO2 value (26.75 cm3/mole) has been determined for a system displaying minor non-deal mixing.
A somewhat more accurate value may be obtained from Cs and Rb melts in that they seem to mix effectively ideally (Kracek, 1930). Sasek and Lisy (1972a, 1972b) reported the densities of Li-, Na-, Rb- and Cs-silicate melts at 1673 K (fig. 4B). There are too few data to employ meaningful quadratic fits to the Rb and Cs systems so that linear, least-squares fits were employed with V°SiO2 fixed at 26.75 cm3/mole. The fits (fig. 4B) and the fit coefficients (V°M2O) are listed in table 1. Nascimento (2007) compiled measurements on Rb and Cs silicate glasses containing ~1–60 mole% alkali oxide. For both systems experimental glass molar volume trends between ~1–10 mole% describe slightly arcuate trends, implying minor non-ideal mixing in the highly siliceous glasses (Nascimento, 2007, see his fig. 2). Additional density measurements on Rb2O-SiO2 and Cs2O-SiO2 melt systems are wanted at highly siliceous concentrations to obtain a more robust value for V°SiO2.
4.2. Partial molar volumes SiO2 and MO)
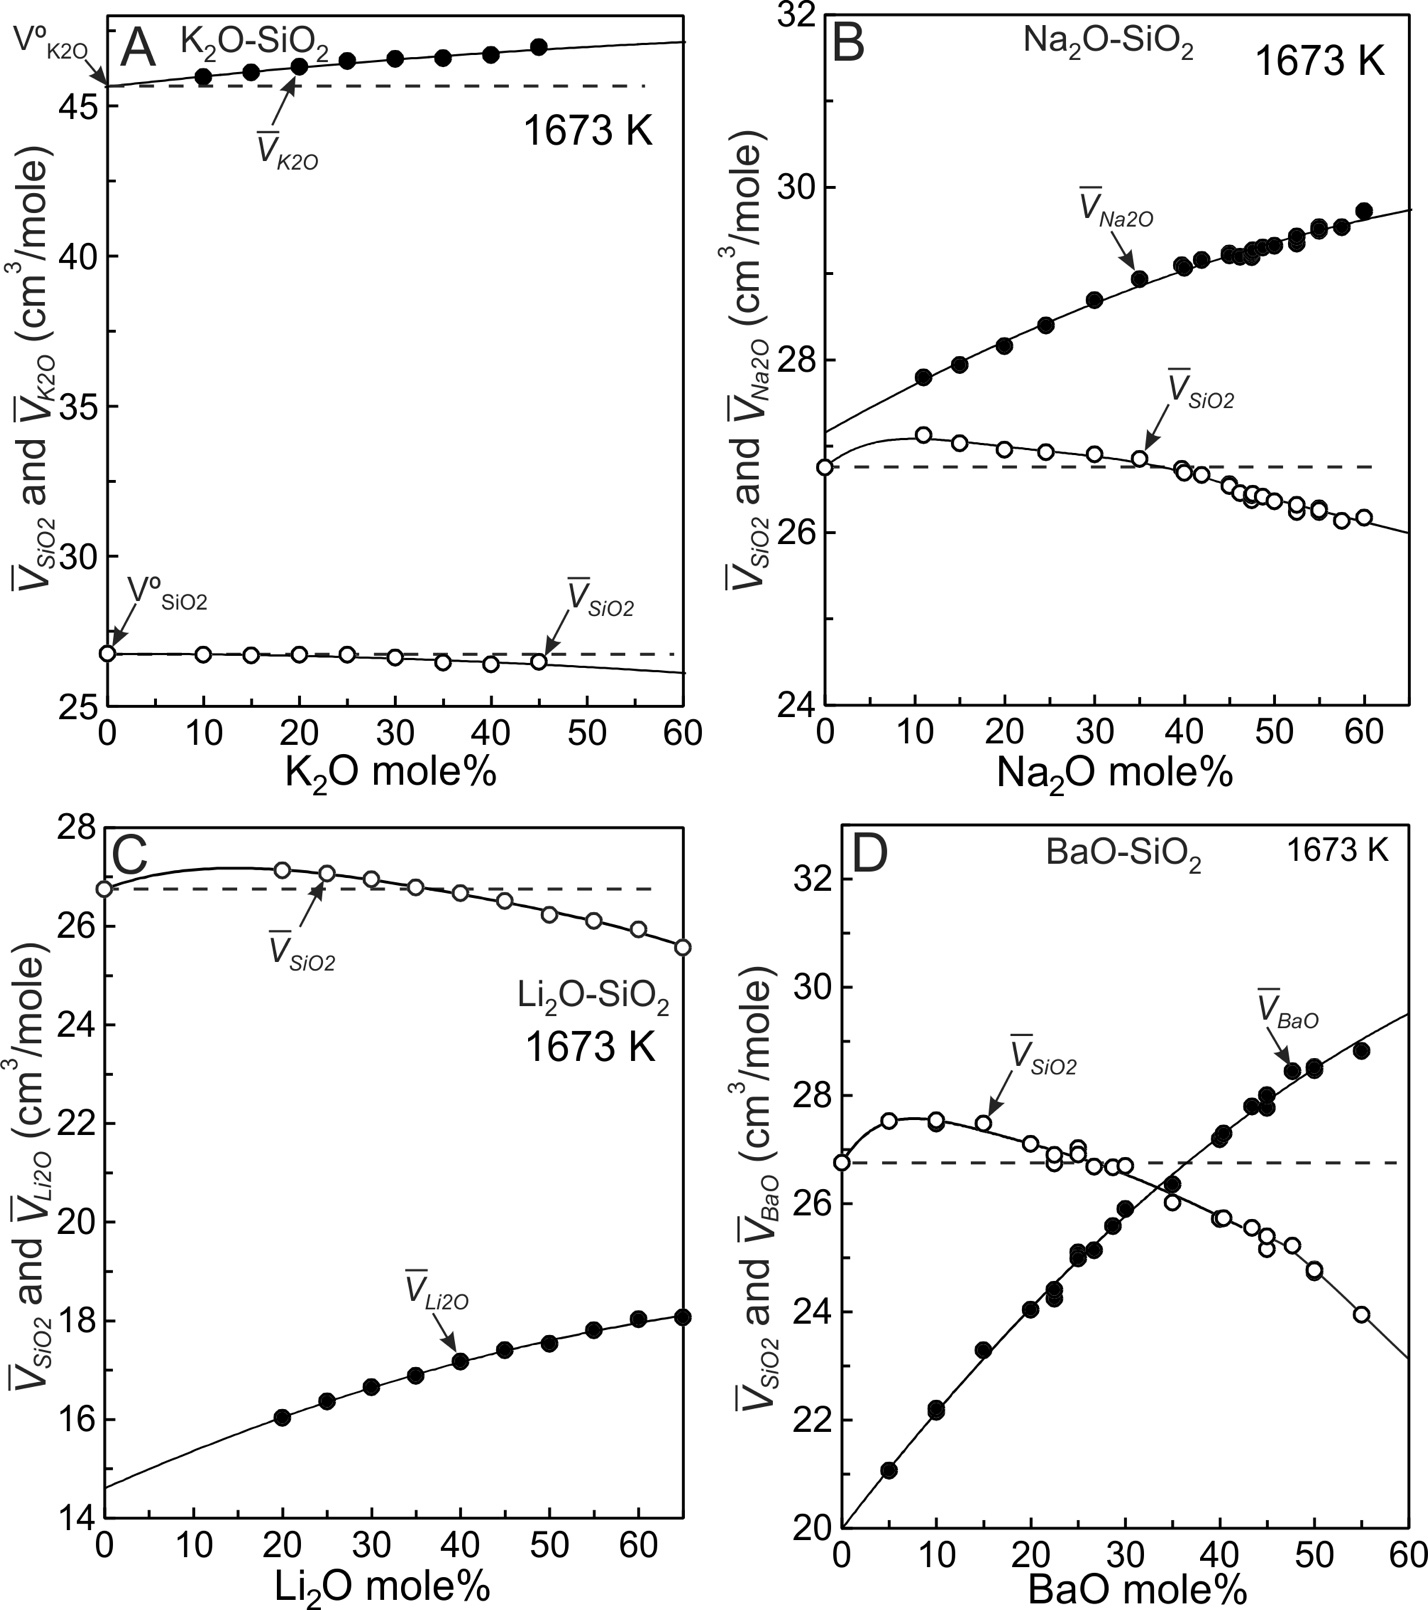
The partial molar volumes of SiO2 and modifier oxides (MO) derived from the fits (fig. 3) using equations (8) to (10) are listed in tables 2 to 5 and are plotted on figure 5 where the solid lines emphasize the trends. The horizontal dashed lines emanating from V°SiO2 on each diagram (fig. 5) indicate SiO2 values that would result if mixing were ideal. In potassic melts containing up to ~45 mole% K2O (fig. 5A), SiO2 is effectively the same as V°SiO2 thus SiO2 behaves ideally (within experimental uncertainty). The situation is different for K2O. If it were to mix ideally, K2O would follow the horizontal dashed line emanating from V°K2O (fig. 5A). Instead it increases somewhat in progressively more potassic melts. It is the K2O component that gives rise to non-ideal mixing in this system. It accounts for the VX value of 1.76x10⁻⁴ cm3/mole (fig. 4A) and to the slight curvature of Vmelt in figure 3C. The non-ideal behaviour of K2O results from collapse of tetrahedra around the cation (Nesbitt et al., 2022), as addressed in the next section.
SiO2 values of the Li, Na and Ba melts are not constant and instead achieve maxima between about 95 and 80 mole% SiO2 (fig. 5B, 5C, 5D). After achieving a maximum value, SiO2 decreases with progressive increase in modifier oxide content for each system. SiO2 mixes non-ideally in Li, Na and Ba melts. Relative to V°SiO2 (26.75 cm3/mole), the maxima in SiO2 become more pronounced in the order K<Na<Li<Ba, which is consistent with the progressive increase in VX (fig. 4A), with the consolute temperatures (fig. 1), and with the extent to which the topology of the cristobalite liquidi deviate from linearity in figure 1. Na2O, Li2O and BaO values increase with MO content (fig. 5), thus both SiO2 and MO behave non-ideally in Na2O-SiO2, Li2O-SiO2 and BaO-SiO2 melts.

5. ELECTROSTRICTION
The partial molar volumes of all modifier oxides are affected by electrostriction (Nesbitt et al., 2022). It results from a reaction between O atoms of Si tetrahedra and modifier cations whereby Coulombic attraction causes tetrahedra to collapse around cations (Marcus, 2011; Nesbitt et al., 2022; Pitzer & Brewer, 1961, pp. 500–502) thereby decreasing melt molar volumes and altering modifier oxide and SiO2 partial molar volumes. The extent of collapse depends on the charge and size of the modifier cation; the greater its charge the stronger the force of attraction and the greater the extent of collapse around the cation. Also, the greater the size of the cation the greater the number of SiO4 tetrahedra that can collapse around the cation. The reaction results in non-ideal mixing of all modifier oxide components in silicate melts. Electrostriction also accounts for: (1) establishment of the oxygen coordination polyhedra of cations; (2) consistent cation coordination numbers (CNs) and; (3) establishment of equilibrium M-O bond distances in melts. Where the Coulombic force of attraction is sufficiently strong, SiO4 tetrahedra beyond the first coordination sphere may collapse toward the cation (Nesbitt et al., 2022). The electronegativity of the cation may also contribute to collapse in that the M-O bond is unlikely to be entirely ionic. The greater the covalent character of the bond the stronger should be the bond and the shorter should be the bond distance, which should affect collapse.
Following Nesbitt et al. (2022), MO is composed of two terms. One is the volume occupied by the polyhedral cage (VPoly) surrounding the modifier cation. The other relates to the extent of volume collapse of tetrahedra around the cation (VCol):
¯VMO= VPoly+VCol
From Nesbitt et al. (2022), VPoly is given by:
VPoly=(4π3)d3+6.83 (Å3 per atom)
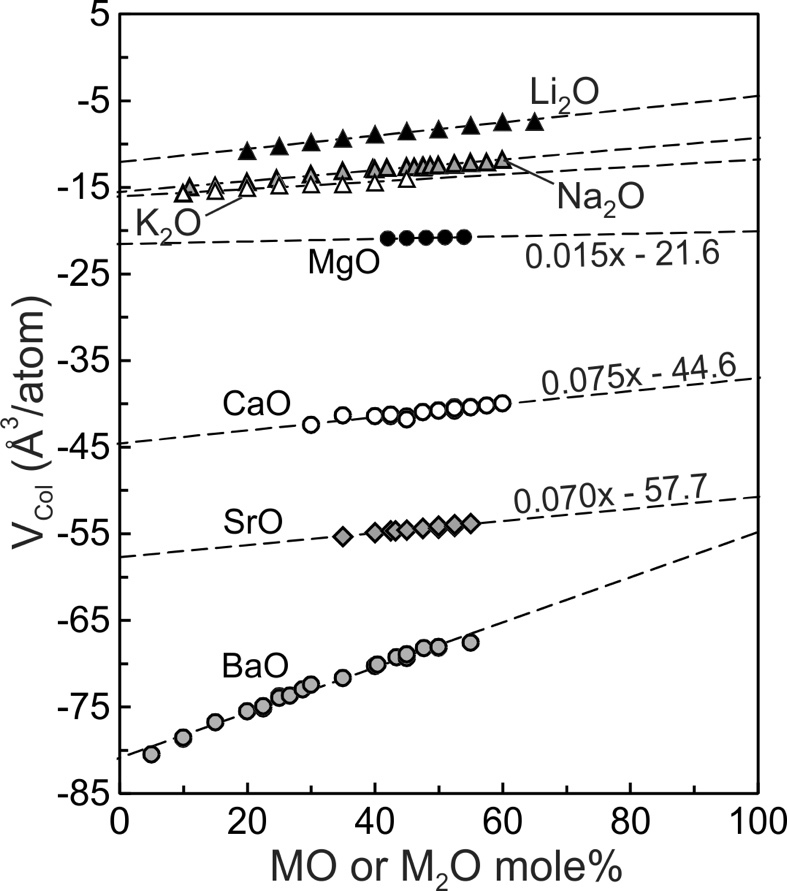
where ‘d’ is equilibrium M-O bond distance, which is the sum of the ionic radii of the modifier cation and O2- derived from crystalline silicates (Huheey et al., 1993; Navrotsky et al., 1985). The constant (6.83 Å3/atom) is an ‘excluded volume’ common to all alkali and alkaline earths modifier cations. The VPoly term is independent of melt composition and is 37.41, 61.19, 92.06 and 115.46 Å3/atom respectively for Li, Na, K and Ba. Following Nesbitt et al. (2022), VCol values for the Li, Na, K and Ba silicate melts were calculated using equation (11) by subtracting the appropriate VPoly from of tables 2–5. VCol values for Mg, Ca, and Sr melts were similarly calculated after evaluating at 1673 K using the expansivities of Tomlinson et al. (1958). All VCol values are plotted on figure 6. In each system, VCol increases effectively linearly with increasing modifier oxide content:
VCol=m(MMO)+b
where ‘m’ is the slope, ‘b’ is the intercept and MMO is mole% of MO (modifier oxide). The data were fit using a linear least-squares approach and the resulting ‘m’ and ‘b’ fit coefficients are included in table 1 for Li, Na, K and Ba melts. Fit coefficients for Mg, Ca and Sr melts are provided in figure 6. The value of ‘b’ represents VCol at 100 mole% SiO2, which is the value of VCol at infinite dilution of the modifier oxide. Substituting the appropriate VCol value into equation (11) gives at infinite dilution. Inspection of the slopes of the trends for Li, Na, K and Ba silicate melts indicate that they do not change appreciably in highly siliceous melts so that the estimates of at infinite dilution seem robust.
The VCol values for Rb2O and Cs2O are not plotted on figure 6 for lack of experimental melt molar volumes as a function of composition. Bottinga et al. (1983) nevertheless obtained Rb2O and Cs2O from the data available (fig. 4), and VCol values were determined to be -27.6 and -25.5 cm3/mole respectively (Nesbitt et al., 2022). These melts thus mix non-ideally due to electrostriction but the effect of non-ideal mixing is likely to be minimal, as for the K2O-SiO2 system (fig. 3C). The SiO2 component of Rb and Cs melts likely behaves ideally, as in K2O melts (fig. 5A). Additional measurements of densities of highly siliceous binary melt systems are required to evaluate better the partial molar volumes of the components of these systems.
_as_a_function_of_melt_composition_for_numerous_alkali_and_alkal.jpeg)
6. MELT MOLAR VOLUME TRENDS
SiO2 behaviour is close to ideal in K silicate melts (fig. 5A) whereas K2O behaves somewhat non-ideally due to electrostriction. With collapse of tetrahedra toward the cation, the melt volume (Vmelt) decreases to a value less than expected for ideal mixing (fig. 3C). K2O has its lowest value at infinite dilution (fig. 6A), thus the effect of electrostriction has its greatest effect, per mole of K2O, in the most siliceous melts. Because K2O increases somewhat with increased K2O content of the melt (fig. 5A) a weak concave upward Vmelt trend is observed (fig. 3C, solid curve). To summarize, with collapse of tetrahedra around K+, and with SiO2 effectively constant (fig. 5A), the melts display molar volumes slightly less than expected for ideal mixing. Electrostriction is responsible for the weak non-ideal behaviour.
The dashed lines of figure 6 illustrate that K2O, Na2O, Li2O and BaO have their lowest values at infinite dilution (XSiO2 = 1.0) and all increase with modifier oxide content of the melt. The four binary systems display qualitatively similar mixing trends (fig. 3) in that all are weakly to strongly concave upward. The enhanced concavity of the Na, Li and Ba melts results both from the large SiO2 values at compositions between ~95 and ~80 mole% SiO2 (figs. 5B, 5C, 5D), and from the continuous increase in MO with modifier oxide content of the melts. Concavity of the melts becomes greater in the order K< Na<Li<Ba, which is the order of VX values (fig. 4A). Both components, SiO2 and MO, contribute to non-ideal mixing in Na, Li and Ba silicate melts whereas only the K2O component makes a contribution in the potassic melts.
6.1. Gibbs-Duhem test for thermodynamic consistency
The partial molar volume trends illustrated in fig. 5 are constrained to obey the Gibbs-Duhem equation, one form of which is (Rowlinson, 1969, p. 125):
XSiO2(∂¯VSiO2∂XSiO2)P,T=XMO(∂¯VMO∂XMO)P,T
There is a maximum in SiO2 in the Ba, Li and Na silicate melts (Fig. 5) and at each maximum is 0.0. Because XSiO2 and XMO are non-zero at these maxima, must be 0.0 (a minimum) for equation (14) to be satisfied. It is a thermodynamic necessity. This behaviour is observed in other liquid systems, as discussed and illustrated by Rowlinson (1969, p. 125). Experimental results for the Ba, Li and Na silicate melt systems unfortunately do not extend to sufficiently large XSiO2 values to provide experimental evidence for minima in Additional experimental studies of highly siliceous melts are wanted. With such studies a more fundamental understanding of the physical chemical behaviour of these melts will be obtained.
7. DISCUSSION
7.1. Reactions and non-ideal mixing
The electrostriction reaction contributes to non-ideal mixing in all melts containing modifier oxides. Its maximum effect occurs at infinite dilution of the modifier oxide and as apparent from figure 6, the order of MO at infinite dilution is Li<Na<K<Mg<Ca<Sr<Ba. The order is different from the order of VX values (fig. 4A) and we conclude that electrostriction is not the major contributor to the non-ideal volumetric mixing in Na, Li or Ba melts. According to Kracek (1930) the SiO2 component of Cs and Rb melts mix ideally or nearly so. Assuming VX is effectively zero for these melts, the degree of non-ideal mixing, based on VX values (fig. 4A), increases in the order Cs=Rb<K<Na<Li<Ba. Consolute point temperatures follow the same order (fig. 1; see also Hess, 1996). Also, consolute point compositions typically are located at ~90 mole% SiO2 (fig. 1; Haller et al., 1974; Hess, 1996). SiO2 values for Na, Li and Ba melts display maxima in the same compositional range (fig. 5) so that cryoscopic observations (fig. 1), the VX values (fig. 4A) and the maxima in SiO2 (fig. 5) all indicate that non-ideal volumetric mixing increases in the order Cs~Rb<K<Na<Li<Ba. From these observations, we suggest that the physical-chemical interactions giving rise to phase separation in alkali and alkaline earths silicate melts also affect the volumetric properties of these melts, with the contributions to non-ideal volumetric mixing increasing in the order K<Na<Li<Ba. The minor non-ideal volumetric mixing in Cs, Rb and K melts likely arises mostly from electrostriction, with VX for Cs and Rb melts likely being less than the value obtained for K silicate melts (fig. 4A)
7.2. Phase separation and SiO2
Hess (1996, his fig. 9) noted a remarkably strong correlation between consolute point temperatures and the ‘ionic potential’ of alkali and alkaline earths modifier cations. Hudon and Baker (2002) extended the relationship to include other cations. Hess (1996) argued that immiscibility observed in highly siliceous melts resulted from repulsive interactions of modifier cations (M-M) due primarily to insufficient ‘shielding’ of modifier cations by BOs, which dominate highly siliceous melts. In melts of greater modifier oxide content immiscibility does not occur because NBOs provide better shielding from M-M interactions than BOs. A premise of the hypothesis is that dissolution of alkali oxides in SiO2-rich melt results in modifier cations remaining in close proximity after dissolution. Subsequent studies make the ‘close proximity’ argument uncertain, although they do not disprove it. Above ~600–700 K, sodic glasses are fast ion conductors with Na+ being highly mobile (Lei et al., 2015). It should be still more mobile in melts. Also, above ~700 K, 23Na static NMR experiments indicate that Na motion is rapid enough to average out Na-Na dipolar couplings and that Na+ acts in a liquid-like manner at and above ~900 K (George et al., 1998). Modifier cations thus may be well dispersed in melts. In support of the Hess hypothesis we add a role for Si, where both Si-M and M-M repulsive interactions contribute to and are responsible for phase separation. As for M-M repulsion, Si-M repulsion should give rise to a strong correlation between consolute point temperatures and the ‘ionic potential’ of the modifier cations as emphasized by Hess (1996). We now elaborate on Si-M interactions.
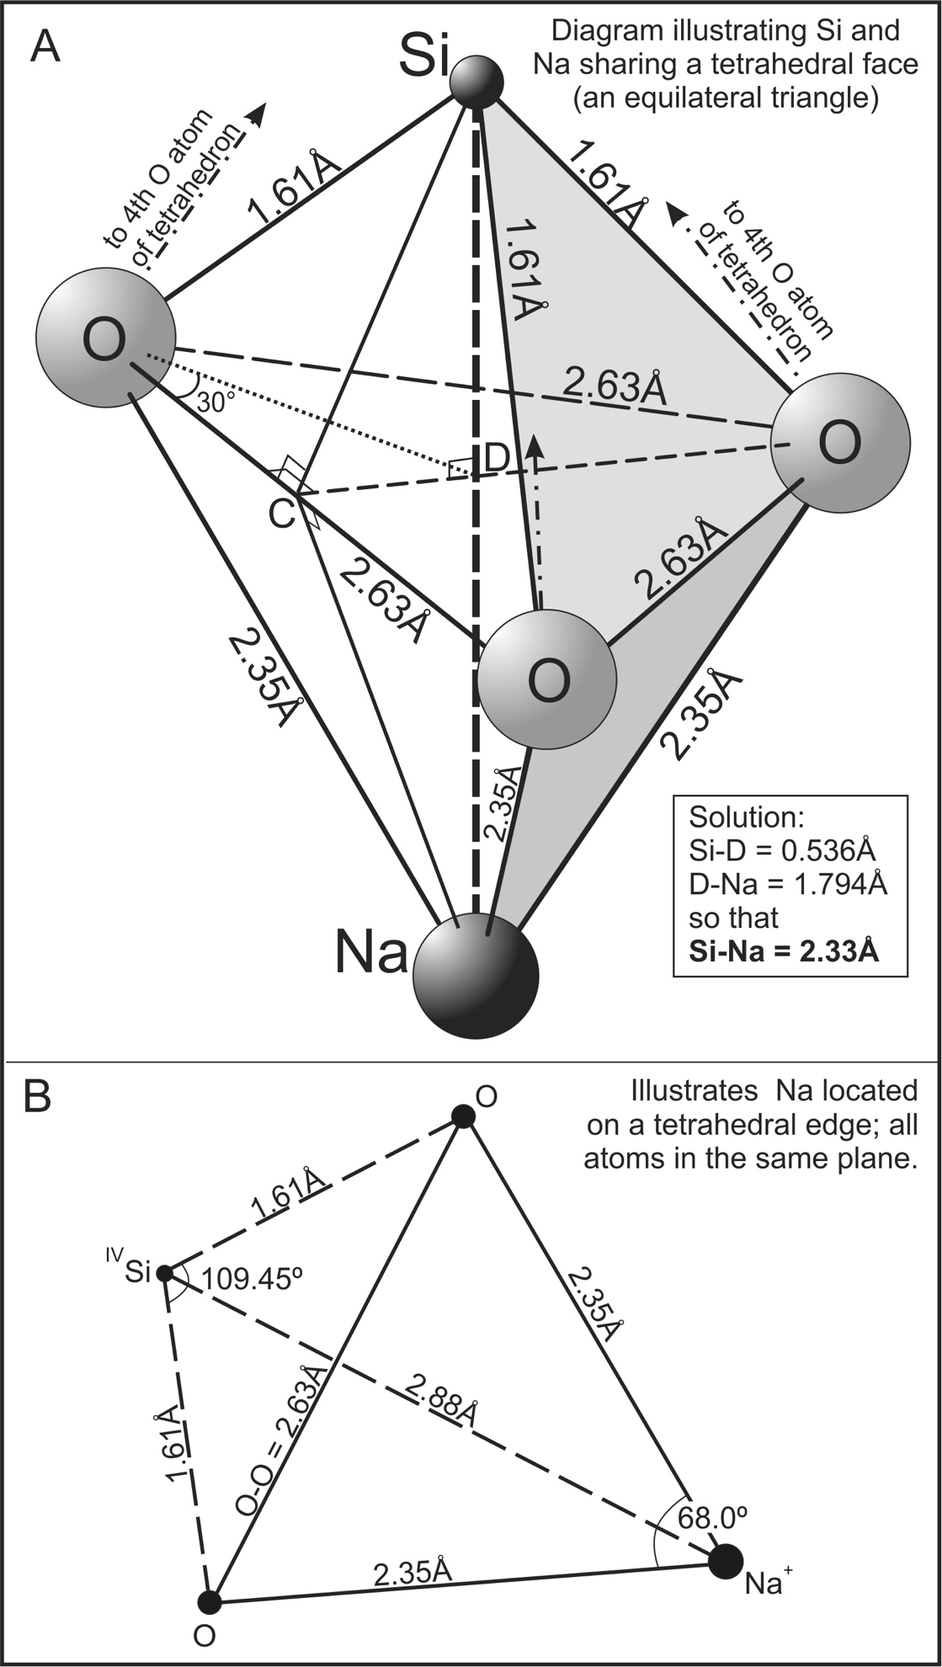
The first coordination sphere of a modifier cation is composed of oxygen atoms (both NBO and BO) which, in turn, are bonded to Si atoms so that ~3–8 Si atoms should be present in the second coordination spheres of alkali and alkaline earth cations (Du & Cormack, 2004; Du & Corrales, 2006, their table 6; Micoulaut, 2008; Navrotsky et al., 1985). Si-M Coulombic repulsion thus is expected. Consider a Na+ to be coordinated to three O atoms on the face of a Si tetrahedron (fig. 7A) where all Na-O bond distances are 2.35Å, all Si-O bond distances are 1.61Å (Huheey et al., 1993) and all O-Si-O angles to be 109.47º (tetrahedral angle). The distance separating Si and Na then is ~2.33Å, as proven by solution of triangles SiOC, OCD and SiCD to obtain Si-D = 0.536Å (fig. 7A). An equivalent solution to triangle NaCD, with Na-O = 2.35Å yields a D-Na distance of 1.794Å and the sum of Si-D + D-Na is the Si-Na distance and equal to 2.33Å. The Si-Na bond distance is similar to the O-Na bond distance (2.35Å). Considering that Si has a greater positive partial charge than NBO and BO have negative partial charges (Demiralp et al., 1999; Hsieh et al., 1994), Si-Na repulsion should be appreciable. In another arrangement where Na is bonded to two O atoms of a tetrahedron (an edge), the solution to the triangles yields a maximum Si-Na separation of 2.88Å as shown in figure 7B where Na, Si and the two O atoms are located on the plane drawn. Si-Na repulsion again should be appreciable. The above calculations may be repeated with other alkali ions. Si-Li repulsion should be stronger than Si-Na repulsion at equilibrium bond distances due to the smaller size of Li. Si-K repulsion should be weaker. Si-modifier cation repulsion thus is likely to contribute to phase separation much as M-M repulsion does.
_is_shared_by_both_a_si_and_a_na___._equil.jpeg)
The magnitude of the repulsive (and attractive) forces depends on the partial charges on the modifier cation (M), Si, BO and NBO of the tetrahedra. Hsieh et al. (1994) determined partial charges on atoms of Na2Si2O5 glass using X-ray photoelectron spectroscopic (XPS) studies and differences in partial charges of NBO and BO were confirmed experimentally by Nesbitt et al. (2017). For Q4 species, Hsieh et al. (1994) obtained partial charges on Si and BO of +1.27 and -0.63 respectively, which are similar to the MD simulations of Demiralp et al. (1999), who obtained Si and BO partial charges of +1.32 and -0.66 on Q4 species. Hsieh et al. (1994) also determined partial charges on Si, BO, NBO and Na of Q3 species to be +1.23, -0.64, -0.96 and +0.68 respectively. Hess (1996) emphasized that NBO ‘shields’ M+ from other M+ better than BO. NBO also shields M+ from Si better than BO. In highly siliceous melts where BO greatly dominates, phase separation may result from the combined effect of M-M and Si-M repulsion. The Hess hypothesis may also explain the greater SiO2 values in ~90 mole% SiO2 melts than V°SiO2 of v-SiO2 (fig. 5B to 5D). Si-M and M-M repulsion may be responsible. Determination of densities of Cs, Rb, K, Na, Li and Ba melts containing between ~100–80 mole% SiO2 are required to understand better SiO2 and MO values in highly siliceous melts.
Thermodynamic treatments of immiscibility have been performed but these provide little insight into the physical-chemical interactions at the atomic-molecular level (e.g., Kim & Sanders, 1999 and references therein). Simulations may provide insight into the above-noted interactions but we offer a note of caution. Both attractive and repulsive interactions are dependent on the partial charges of the atoms involved. If these interactions are to be properly investigated, the partial charges (electron density) on the atoms should be determined from first principles molecular orbital calculations. Assignment of partial charges to atoms prior to molecular dynamics calculations (e.g., Du & Corrales, 2006, their table 2) may not be appropriate in that both experiments and simulations indicate that partial charges vary depending on local environments (Demiralp et al., 1999; Hsieh et al., 1994). The appropriate calculations should provide substantial insight into the both volume collapse and the Hess hypothesis.
7.3. Partial molar volumes compared with previous results
Many previous studies used linear equations to extract partial molar volumes of the oxide components (Bottinga et al., 1982, 1983; Bottinga & Weill, 1970; Ghiorso & Kress, 2004; Lange, 1997; Lange & Carmichael, 1987, 1990). These studies made clear that the extracted partial molar volumes applied to restricted compositional ranges, typically ~45–70 mole% SiO2. Within this compositional range, partial molar volumes obtained using linear equations are remarkably similar to values obtained here using the quadratic equation (6) to fit melt molar volumes. Bottinga et al. (1983), and Ghiorso and Kress (2004) obtained SiO2 = 26.75 and 26.71 cm3/mole respectively. Our approach yields 26.75 cm3/mole. With respect to modifier oxides, our Na2O values of melts containing ~45 to ~65 mole% SiO2 range between ~28.9 and ~29.5 cm3/mole (fig. 5B). The Na2O value quoted by Ghiorso and Kress (2004) is 29.1 cm3/mole. Bottinga et al. (1983) obtained 29.03 cm3/mole. The major differences between SiO2 and MO values obtained here, and with linear mixing models, become apparent in highly siliceous melts (SiO2≥75 mole%). Our results are in accord with those of Knoche et al. (1995) who determined partial molar volumes of components in haplogranitic melts. Their experimental value for SiO2 is ~27.8 cm3/mol at 1673 K, indicating that SiO2 is greater in haplogranitic melts than in andesitic to basaltic melts. This analysis indicates that the maximum values of SiO2 in Na, Li and Ba melts range between ~27.1 to ~27.5 cm3/mole and that the maxima are achieved at compositions between ~80 and 95 mole% SiO2 (fig. 5). Melts studied by Knoche et al. (1995) contained 12.5 mole% Al2O3 and its effects on SiO2 and other components are unknown. Nevertheless, non-ideal mixing of SiO2 in highly siliceous melts helps to rationalize experimental results spanning a compositional range from ~100 to ~45 mole% SiO2.
8. CONCLUSIONS
Two non-ideal volumetric mixing contributions have been identified in alkali and alkaline earths binary silicate melts. The partial molar volumes of modifier oxides MO) behave non-ideally due to electrostriction. The Coulombic force of attraction between modifier cation and O atoms of Si tetrahedra causes the tetrahedra to collapse toward modifier cations. The reaction decreases the molar volumes of melts and of MO. A contribution to non-ideal mixing may arise from the SiO2 component. SiO2 mixes ideally in siliceous potassic melts and it probably mixes similarly in siliceous Rb and Cs melts. In melts containing Na, Li and Ba, however, SiO2 mixes non-ideally and SiO2 displays maxima between ~95 and 80 mole% SiO2. The extent to which SiO2 deviates from ideal mixing correlates strongly with the topological properties of cristobalite liquidi and with consolute point temperatures of the respective alkali and alkaline earth silicate melts. We propose that a common reaction is responsible for phase separation, for topological differences in the cristobalite liquidi, and for the non-ideal volumetric mixing behaviour of SiO2 in the highly siliceous melts. The reaction may involve Si-M and M-M repulsive interactions but their nature and strength remain problematic.
ACKNOWLEDGMENTS
HWN thanks Dr. K. Harrison for many discussions concerning calculations of Coulombic interactions among Si, O and modifier cations. The discussions made much clearer the complexities of Si-O-M interactions. We also thank Drs. Bernard de Jong for reading a draft of the manuscript and offering insightful comments. Two reviewers, including Dr. Kai Hess, provided highly insightful reviews which resulted in substantial improvement to the manuscript. GSH acknowledges funding in the form of a NSERC discovery grant. We thank the editors, Drs. M. Brandon (editor) and E. Moulas (Assoc. editor) for their input to the manuscript, and our respective departments and universities for the logistical support required to conduct this study.
AUTHOR CONTRIBUTIONS
All authors contributed to the ideas included in the ms. It is impossible to assign to individual authors the various conceptual contributions because a concept expressed by one inevitably has been altered and expanded by another. The majority of the writing was performed by HWN and PR, although all contributed to the writing and editing of the ms.
Editor: Mark Brandon, Associate Editor: Evangelos Moulas