
_graph_of_1se_uncertainty_in__206_pb__207_pb_age_vs._percent_concordance_with__207_pb__.tiff)
_chondrite-normalized_rare-earth_element_concentrations_in_2480_ma_detrital_zircons_ana.tiff)

_plot_of_zircon-crystallization_temperatures_determined_from_titanium_content_in_zircon.tif)
_thorium_versus_uranium_content_of_2480_ma_zircons_analyzed_by_la-icp-ms_for_this_study.tif)


__hf__and__nd__isotopic_composition_of_modern_oceanic_island_basalt_(oib)_and_mid-oc.tif)
1. INTRODUCTION
U-Pb geochronologic analysis of detrital zircons has been instrumental in identifying vectors for clastic sediment dispersal and determining paleogeography at regional to continental scales (e.g., S. J. Davis et al., 2010; Dickinson & Gehrels, 2010; Spencer et al., 2011). Analysis of trace and rare-earth elements, hafnium isotopes, and inclusion mineralogy in dated zircons allows characterization of igneous rock units in detrital-zircon source regions and insight into past tectonic and magmatic settings (e.g., Bickford et al., 2019; Surpless & Beverly, 2013). In this study we present new geochemical and mineralogic analyses of a distinctive population of ∼2480 Ma detrital zircons in ∼1.74 Ga metasedimentary units in northwestern Arizona to constrain the location and geologic nature of the igneous source rocks. This is intended to improve understanding of the Paleoproterozoic paleogeography of the igneous source and of sediment dispersal pathways that connected the source and downstream basins. We specifically consider the possibility that sources and dispersal pathways include areas now in Australia and Antarctica. Identification of distant sources and pathways could potentially constrain paleogeographic reconstructions of now dispersed cratonic fragments.
Genesis of the Mojave and Yavapai tectonic provinces of southwestern North America occurred at ∼1800–1650 Ma during subduction-related magmatism and accretion to the Laurentia paleocontinent. Details of crustal genesis, such as the significance of tectonic accretion of volcanic arcs, and intra-arc or back-arc extension, are not well understood (e.g., Anderson et al., 1993; Baird et al., 2022; Bickford et al., 2019; Bickford & Hill, 2007; Duebendorfer et al., 2006; Karlstrom et al., 2001; Karlstrom & Bowring, 1988; Wooden et al., 2013). General southeastward trends toward younger ages of initial magmatism and more isotopically juvenile crust are apparent from U-Pb geochronology and Nd, Hf, and Pb isotope geochemistry (Bennett & DePaolo, 1987; Holland et al., 2018; Wooden & DeWitt, 1991). Zircons from Paleoproterozoic metasedimentary rocks throughout the Mojave and Yavapai tectonic provinces are typically characterized by two broad age groups, one at ∼1700–2000 Ma and the other at ∼2400–2800 (e.g., Holland et al., 2015, 2018; Shufeldt et al., 2010; Spencer et al., 2016). Similar bimodal age spectra characterize some Proterozoic rock units in Australia and Antarctica, but reconstructions of Laurentia with other cratons are still speculative (e.g., Dalziel, 1991; Goodge et al., 2017; Hoffman, 1991; Holland et al., 2018; Moores, 1991).
The Vishnu Schist and its relatives in northwestern Arizona represent a component of the Paleoproterozoic crust that forms the Yavapai and Mojave tectonic provinces in the (now) southwestern part of the Laurentia paleocontinent. The schist is generally characterized by a bimodal zircon-age spectrum with a distinctive population of ∼2480 Ma zircons that form a sharp peak in the zircon age spectra of some schist samples. Here we present new trace and rare-earth element data from 45 dated 2480 Ma zircons, and electron microprobe scans that identified mineral inclusions in 5 of 16 zircon grains, from two widely separated samples of psammitic schist that have similar zircon age spectra to Vishnu Schist and are probably related. This analysis better characterizes the geochemistry and mineralogy of the unidentified zircon source. We also review and analyze existing geochronologic and geochemical data that further characterize this ∼2480 Ma zircon population. This analysis is followed by an evaluation of detrital-zircon U-Pb data from other Proterozoic clastic sedimentary rock units in North America, Australia, and Antarctica in order to identify potential sources and zircon-dispersal vectors. Ultimately, our goal is to identify an ∼2480 Ma igneous source or other sites of ∼2480 Ma detrital-zircon deposition that would provide new constraints on the paleogeography and tectonic displacements of Archean and Proterozoic crustal elements.
2. VISHNU SCHIST AND RELATED UNITS
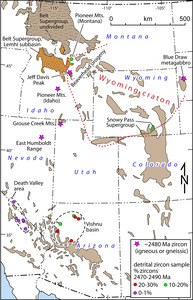
Metasedimentary rocks of the Vishnu Schist are exposed in the bottom of eastern Grand Canyon (fig. 1) in Grand Canyon National Park, an area known as “upper granite gorge.” Vishnu Schist consists of micaceous pelitic schist and quartz-mica psammitic schist that includes graded beds interpreted as turbidites (Ilg et al., 1996; Karlstrom et al., 2012). Association with pillow basalts and mafic and felsic metavolcanic rocks led to the interpretation that these rocks were deposited in an island-arc tectonic setting (Hawkins et al., 1996; Ilg et al., 1996). Similar schist is exposed in “lower granite gorge” in western Grand Canyon (fig. 1; Billingsley et al., 2006; Karlstrom et al., 2003; Wenrich et al., 1986). U-Pb geochronology of igneous rock units intruding or interbedded with Vishnu Schist indicates that deposition of Vishnu protolith strata was underway at 1750–1740 Ma (Hawkins et al., 1996). Kolmogorov-Smirnov (K-S) statistical analysis of U-Pb dates of detrital zircons from 12 samples of Vishnu Schist, 10 from eastern Grand Canyon and 2 from western Grand Canyon, indicate high similarity in the age spectra of the zircon grains (Shufeldt et al., 2010). The abundance of 2470–2490 Ma zircon grains in Vishnu Schist is highly variable, however, with 3 of 12 samples containing 15–30% zircons of this age range and 6 samples containing only 1–5% zircon grains of this age range (table 1).

Detrital zircons in two other Paleoproterozoic clastic rock units have similar bimodal age spectra. Metaconglomerate with deformed clasts, tuffaceous and quartzose metasandstone, and micaceous pelitic schist in the Cottonwood Cliffs area, located ∼60 km south of western Grand Canyon (fig. 1), form a north-striking, 1.5–2 km thick sequence that depositionally overlies mafic metavolcanic rocks (Beard, 1986; Beard & Lucchitta, 1993; Evans, 1999). Ninety-six zircon grains from a sample of metasandstone within the conglomerate yielded a U-Pb age spectrum similar to the bimodal age spectra of the Grand Canyon samples, with 30.2% of the grains falling in the 2470–2490 age range (table 1; Doe, 2014). Pelitic and fine psammitic strata with variably developed cleavage and schistosity outcrop ∼180 km south of eastern Grand Canyon in the Jerome Canyon area north of Prescott, Arizona (fig. 1). These metasedimentary rocks are interbedded with basaltic lavas and breccias and associated sparse layers of calc-silicate and ferruginous silica (Spencer et al., 2016). The 1736 ± 21 (2SE) Ma Williamson Valley Granodiorite intrudes the Jerome Canyon siliciclastic and volcanic rock units. Twenty-four percent of the 75 dated detrital-zircon grains from a sample of fine psammitic schist fall in the 2470–2490 age range (table 1). K-S statistical comparison of the Jerome Canyon detrital-zircon age spectrum with the 12 age spectra from Vishnu Schist (Shufeldt et al., 2010) found sufficient similarity with three of the Vishnu Schist samples that derivation from the same sand source could not be ruled out at the 95% confidence level (Spencer et al., 2016).
U/Pb isotopic analysis of 6 samples of Paleoproterozoic siliciclastic rocks in the Death Valley area of southeastern California and southern Nevada identified a dominant zircon age peak at 1820–1880 Ma, but older zircon dates are broadly scattered at ∼2200–3200 Ma and do not define a single older age peak (Holland et al., 2018). Only 2 out of 542 analyzed grains (0.4%) in the Death Valley area yielded dates in the 2470–2490 Ma age range, which is unlike the Grand Canyon samples analyzed by Shufeldt et al. (2010) in which 87 of 1034 zircon grains (8.4%) yielded dates in this age range. Holland et al. (2018) applied the name “Vishnu basin” to include the Death Valley area as well as northwestern Arizona, but we consider the lack of 2480 grains in the Death Valley area to indicate differences in sediment source areas that suggest different depositional basins. The distinction between the two areas is not entirely clear, however, as one sample from the eastern Grand Canyon yielded zero dates in the 2470–2490 age range out of 90 analyzed (Holland et al., 2015). Stratigraphic relationships between all the analyzed rock samples are unknown because of later plutonism, metamorphism, deformation, and the great distances between many of the samples. Differences in abundance of 2470–2490 Ma grains could reflect deposition in different basins, different positions within a basin with multiple sediment inputs, and different stratigraphic levels where sediment sources had changed over time.
3. 2480 Ma ZIRCON GRAINS
3.1. U-Pb zircon geochronology
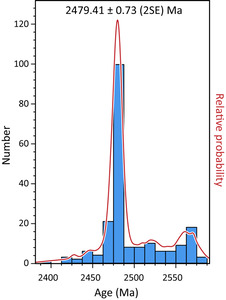
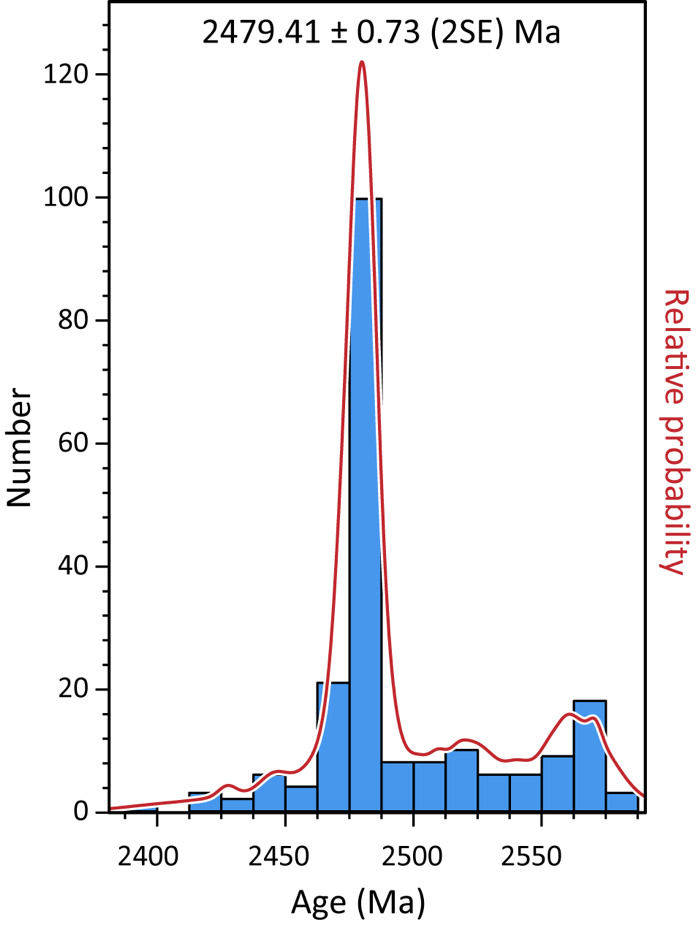
Zircon-age spectra from samples from all 4 sample areas in northwestern Arizona include a subset of 2470–2490 Ma zircons that make up as much as 30% of the zircon grains in the rock samples (fig. 1; table 1). An area of ∼40,000 km2 encompasses these 4 sample areas, indicating a voluminous ∼2480 Ma zircon source that was >600 million years older than any known rock unit in southwestern North America. Zircon 207Pb/206Pb dates define a dominant age peak at 2480.0 ± 27.3 (2SE) Ma (mean age and standard error determined with the Excel© program AGE PICK from the Arizona Laserchron Center). This date includes systematic uncertainties such as uncertainties in decay and abundance constants (Gehrels et al., 2008). Gaussian deconvolution (Sambridge & Compston, 1994) identified an age peak at 2479.41 ± 0.73 Ma (2SE) (fig. 2). Eighty-nine 207Pb/206Pb analyses of zircon grains dated at 2470–2490 Ma, with <10 Ma 1SE analytical uncertainty and <3% discordance from concordia, yielded a weighted mean age of 2480.0 ± 0.9 (2SE) Ma, which is essentially identical to the age of the dominant peak identified by Gaussian deconvolution. The small uncertainties of the peak ages identified by Gaussian deconvolution and by the weighted mean age reflect only the precision of the analyses and not the accuracy of the date (Gehrels et al., 2008). The low uncertainty associated with the age peak indicates consistent results in each analysis which would not be possible without consistent behavior from the zircons and from the mass spectrometer.
The 2470–2490 Ma detrital-zircon population, referred to here as the “2480 Ma” zircon population, is distinguished by its generally smaller analytical uncertainty and greater concordance with ideal closed-system U-Pb isotopic evolution compared to older and younger grains (fig. 3A). Average analytical uncertainty and discordance with closed-system U-Pb evolution are lower for the 2480 Ma zircon population than for older or younger zircons in the same rock sample (fig. 3B). Within the 2480 Ma zircon population there is a weak correlation of lower analytical uncertainty with higher U content, which is the opposite of what would be expected if radiation damage increased analytical uncertainty. Average U content of 2480 Ma zircons (157 ± 48 (1SE) ppm) is slightly less than for older (165 ± 109 (1SE) ppm U) or younger (209 ± 113 (1SE) ppm) grains, but this is not statistically significant (data from Doe, 2014; Holland et al., 2015; Shufeldt et al., 2010; Spencer et al., 2016).
_graph_of_1se_uncertainty_in__206_pb__207_pb_age_vs._percent_concordance_with__207_pb__.tiff)
3.2. Trace and rare-earth element (TREE) analysis
The grain mounts that were used for U-Pb analysis of zircons from Cottonwood Cliffs and Jerome Canyon (Doe, 2014; Spencer et al., 2016) were re-used to determine the trace-element and rare-earth-element content of 45 zircon grains that had been dated at ∼2480 Ma (see supplemental data). Analyses were conducted in 2022 at the Arizona Laserchron Center at the University of Arizona with a Photon Machines Analyte G2 laser (193 nm) connected to an Element2 multi-collector LA-ICP-MS (laser-ablation – inductively coupled plasma – mass spectrometer) equipped with a Jet pump and interface (Gehrels, 2020; Pullen et al., 2018). Primary calibration standards SL and FC were analyzed intermittently during sample analyses (set-up with sequential analyses of standards FC-SL-FC-SL-FC-SL, then 5 unknowns in groups separated by FC-SL, then ending with FC-SL-FC-SL). Secondary standards R33 and NIST612 were also analyzed occasionally during sample analyses. Precision of measurements of element concentrations is <5% for a typical zircon grain (Gehrels, 2020). The expected stoichiometric concentration of Si in zircon (153,230 ppm) is shown for all zircons because this value was assumed and then used to calibrate signal intensities for all other analyzed elements (Gehrels, 2020).
The concentration of trace and rare-earth elements (TREE) in zircon crystals can vary greatly because of changes in element concentrations in host magma during crystallization, changes in mineralogy of crystallizing phases during magma evolution, and changes in physical conditions such as temperature, pressure, water content, and oxygen fugacity (e.g., Davies et al., 2021; Hoskin & Schaltegger, 2003). As a result, TREE concentrations in zircons are highly variable and not particularly revealing of parent-magma chemistry (Hoskin et al., 2000). Rare-earth element (REE) concentrations in the 2480 Ma zircons are not distinguishable from REE concentrations in zircons from a wide variety of rock types (fig. 4). The 2480 Ma zircons are all depleted in heavy REE’s compared to the higher range of concentrations in the most mafic rocks represented in figure 4.
_chondrite-normalized_rare-earth_element_concentrations_in_2480_ma_detrital_zircons_ana.tiff)
3.3. Electron microprobe analysis
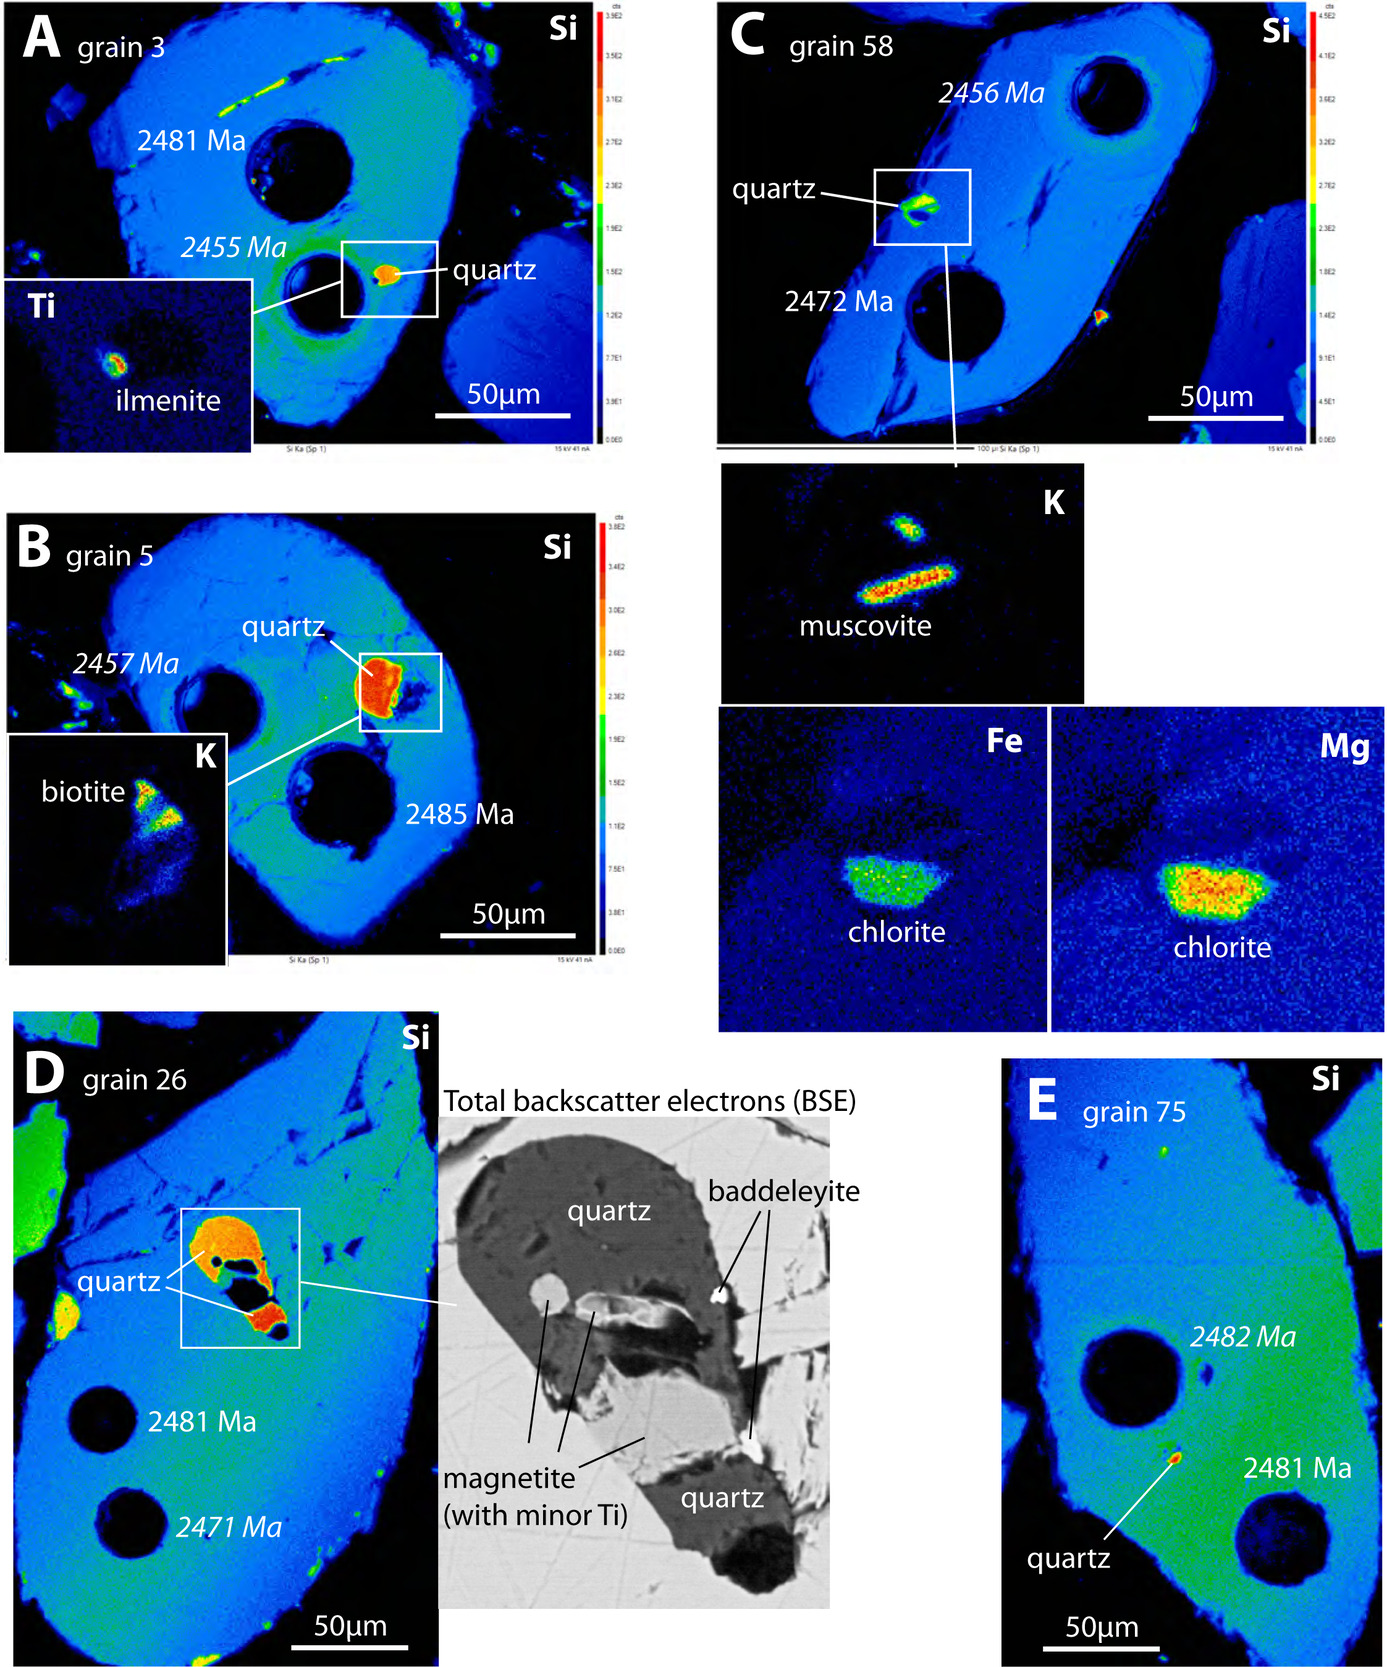
Sixteen 2480 Ma zircon grains from the Cottonwood Cliffs and Jerome Canyon samples were scanned for nine elements with a Cameca SX100 Ultra electron microprobe at the Michael J. Drake Electron Microprobe Laboratory at the University of Arizona. Follow-up analysis with energy-dispersive x-ray microanalysis was used to confirm identification of mineral inclusions in the zircons. Five of the zircon grains contain or partially contain ∼5–30 μm quartz inclusions with associated smaller inclusions of ilmenite, magnetite, biotite, muscovite, baddeleyite, and chlorite (fig. 5).
3.4. Hf isotopic composition
Six zircon grain mounts used by Shufeldt et al. (2010) were analyzed by Holland et al. (2015) for both U/Pb age and hafnium-isotope composition. These analyses confirmed the bimodal age spectra of the Vishnu samples and determined initial εHf for 187 zircon grains. Sixteen 2480 Ma zircon grains from Vishnu Schist analyzed for Hf isotopes by Holland et al. (2015) yielded initial εHf values of −4.3 to +3.2 with an average initial εHf value of −1.2 ± 3.6 (2SE).
4.0 INTERPRETATIONS OF GEOCHEMISTRY AND MINERAL INCLUSIONS
4.1. Inclusion mineralogy
Five of 16 zircon grains scanned with an electron microprobe contain quartz, and 4 of these 5 inclusions also include other minerals. Grain 58 (fig. 5C) contains a composite inclusion of quartz, muscovite and chlorite, but this inclusion is at the margin of the grain and the inclusion minerals could be products of alteration or metamorphism, especially for the chlorite. The inclusion in grain 5 (fig. 5B) contains quartz and biotite that form an ∼25 µm, nearly round inclusion that is much larger than any of the cracks in the zircon grain, none of which appear to be filled with secondary minerals. We interpret this inclusion as primary. The composite inclusion in grain 26 (fig. 5D) is ∼55 µm long and is much wider than any of the cracks in the zircon grain, none of which contain secondary minerals. We also interpret this inclusion as primary. Two other quartz inclusions (fig. 5A and 5E) are small (∼5–10 µm) and far from cracks, and are also interpreted as primary. While quartz is sufficiently abundant in the inclusions to indicate zircon crystallization in a silicic magma, it is uncertain if biotite in one inclusion and muscovite in a partial inclusion are indicative of magma composition or are outliers unrelated to primary magma chemistry.
4.2. Titanium and Th/U
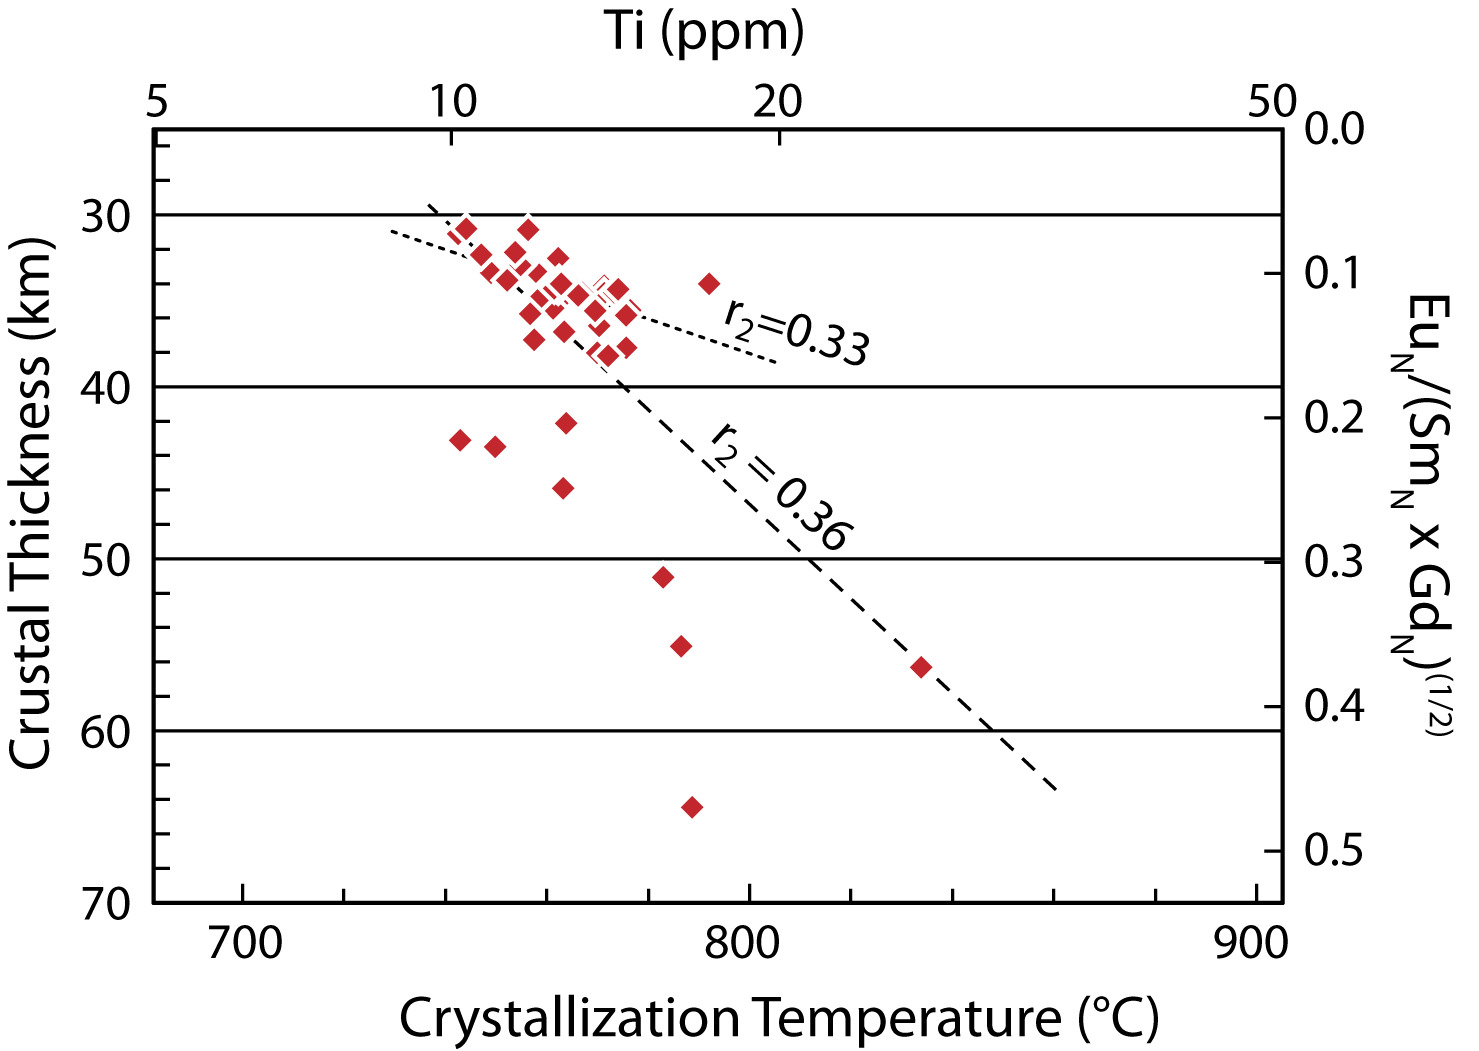
The titanium content of 2480 Ma zircons, typically ∼5–25 ppm, reflects the temperature of crystallization. Calculation of crystallization temperature requires the presence of rutile, however, otherwise only a minimum temperature can be determined (Watson et al., 2006; Watson & Harrison, 2005). Titanium concentrations in the analyzed 2480 Ma zircon grains, none of which are known to contain rutile inclusions, indicate minimum crystallization temperature of ∼740–800 °C, a temperature range that is more characteristic of mafic rather than felsic magmas (fig. 6A; Fu et al., 2008). Mafic rocks, however, generally contain zircons with Th/U ratios that are much higher than for 2480 zircons (Kirkland et al., 2015), suggesting a more felsic composition for the 2480 Ma zircon-source magma (fig. 6B). The strong linear correlation between Th and U (fig. 7A, 7B) indicates that post-crystallization mobilization of Th and U by hydrothermal, metamorphic, and igneous processes has not been significant. Such mobilization would reduce or eliminate the correlation between the two elements (e.g., G. H. Davis et al., 2019). The characteristics identified in figures 6 and 7 indicate zircon crystallization from silicic magma that was unusually hot, with no evidence of post-crystallization mobilization of U and Th in zircons.
_plot_of_zircon-crystallization_temperatures_determined_from_titanium_content_in_zircon.tif)
_thorium_versus_uranium_content_of_2480_ma_zircons_analyzed_by_la-icp-ms_for_this_study.tif)
4.3. Europium depletion
The magnitude of europium depletion in zircon relative to the adjacent (on the Periodic Table) rare-earth elements samarium and gadolinium reflects the importance of plagioclase crystallization during magma ascent. Plagioclase is an increasingly significant product of magma crystallization at shallower depths where it incorporates europium (Eu2+) in place of calcium (Balica et al., 2020; Tang et al., 2020). Calculation of a crustal-thickness estimate from measured europium depletion in zircon is based on the concept that much magma crystallization occurs when mafic magma ascends to the base of the crust where it pools and crystallizes until the residual magma is buoyant enough to continue its ascent in the crust. Ascending mafic magmas that pool and crystallize beneath thick crust contain little or no plagioclase whereas pooling beneath thin crust results in much plagioclase crystallization. Furthermore, at depths greater than ∼40 km, garnet crystallization is effective at removing Fe2+ from the melt phase and thereby increasing the proportion of Fe3+ and the oxidation state of the residual magma. With greater oxygen fugacity, Eu2+ is oxidized to Eu3+, which behaves like the other trivalent REEs (all but cerium). Europium depletion of magma relative to other REEs is thereby inhibited under deep crustal, oxidizing conditions (Tang et al., 2018, 2020). Calibration of the europium-depletion anomaly relative to crustal thickness as determined by independent means allows estimation of crustal thickness in areas of magmatism where zircon host rocks are intermediate to moderately felsic (55–75% SiO2; Tang et al., 2020, 2021).
The 2480 Ma zircon population in our two schist samples has large europium depletions. Thirty-seven of forty-five 2480 Ma zircon grains analyzed for rare-earth elements contain 7–16% of the Eu that would be expected given the measured concentrations of Sm and Gd, while the other 8 grains contain 20–50% of the expected Eu (fig. 8). If the zircons crystallized from intermediate to moderately felsic magmas, then crustal thickness was ∼30–40 km during the time of magma ascent and crystallization of most of the zircons (using the calibration of Tang et al., 2020). Data points with higher Eu content and inferred crustal thickness possibly represent the contaminating influence of micro-inclusions in zircon. The deepest plotted data point on figure 8, for example, also has the highest phosphorous (416 ppm) and aluminum (204 ppm) content, whereas the median values for the highly skewed trace-element data are 137 ppm P and 2 ppm Al.
4.4. Trace elements and magma source
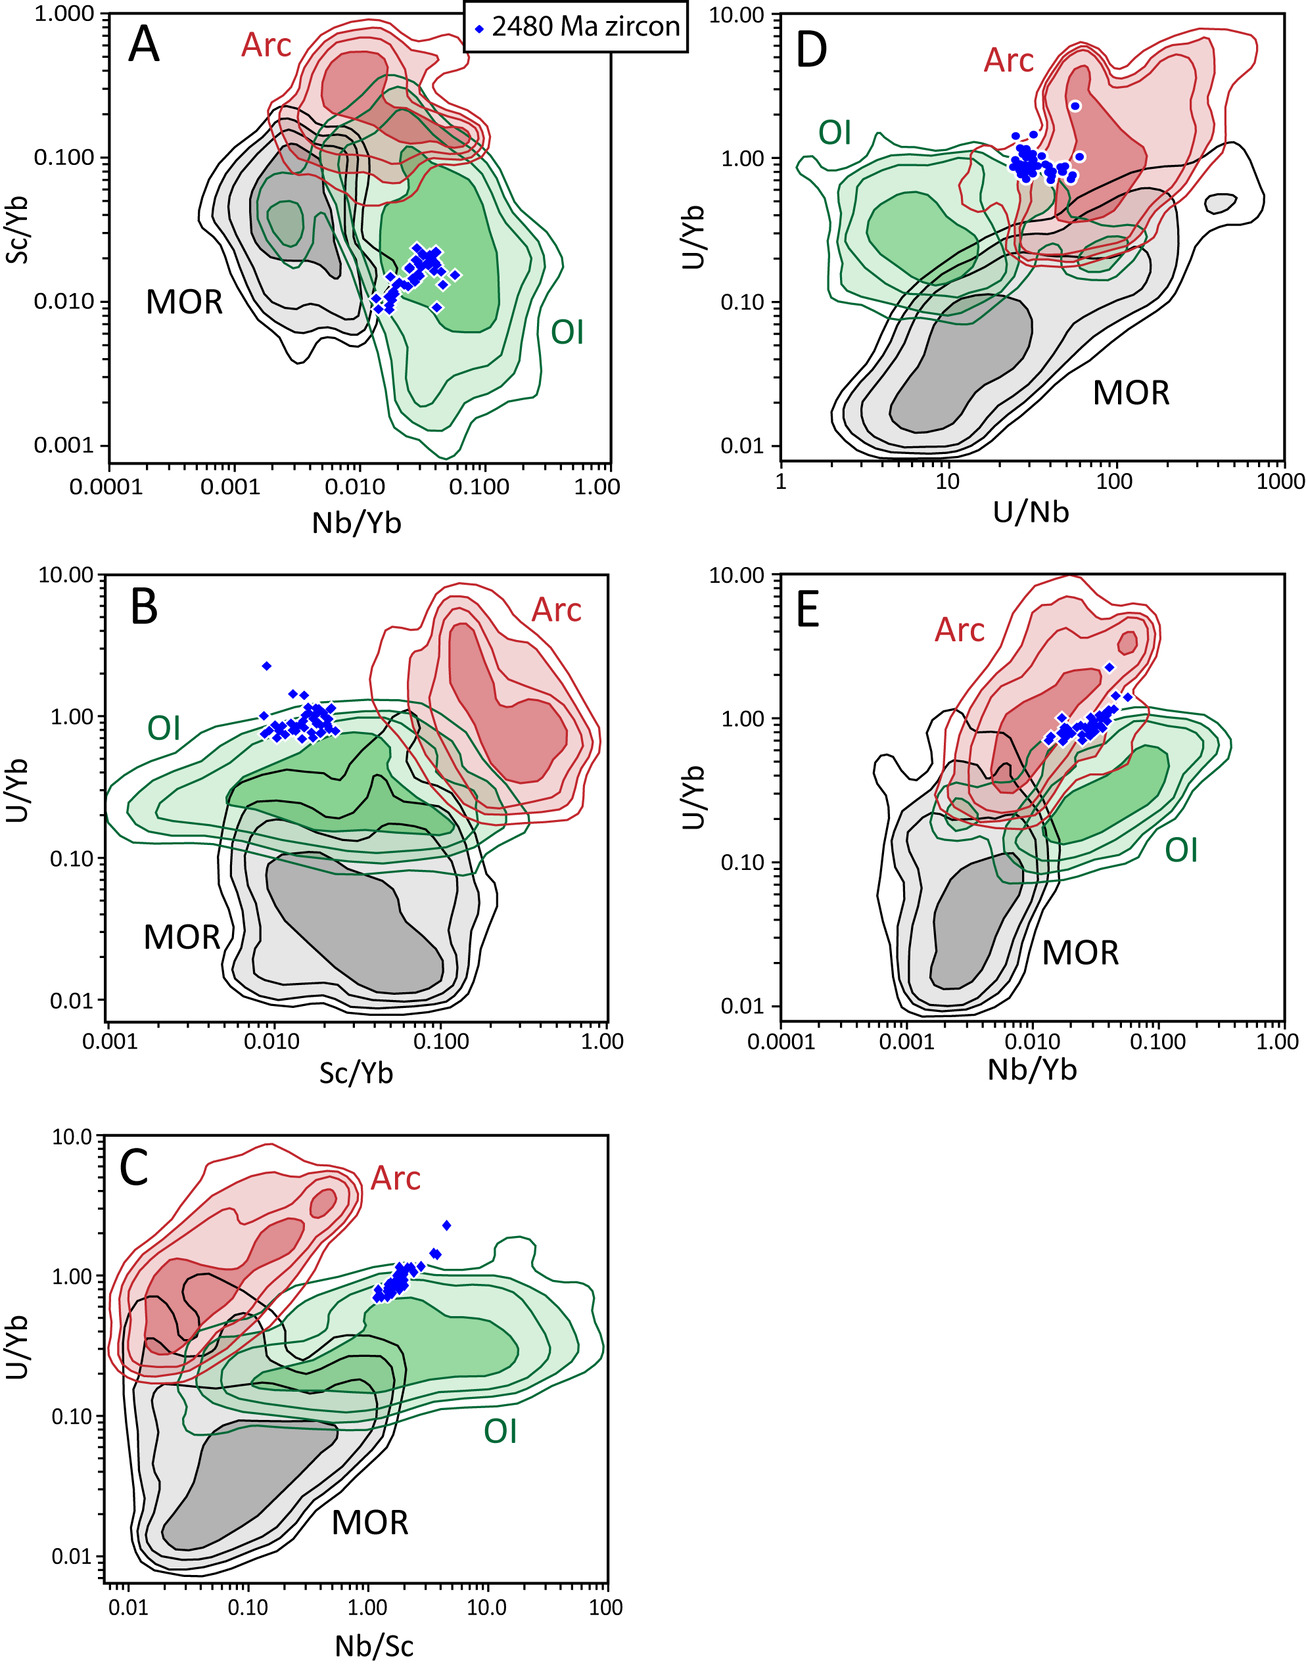
The most basic distinction for the origin of most magmas is their derivation from one of three major sources: (1) oceanic spreading centers, also known as mid-ocean ridges (MOR), (2) hotspots, also known as oceanic islands (OI), that are derived from deeper in the mantle than igneous rocks from oceanic spreading centers, and (3) subduction-related magmatism in magmatic arcs (ARC). MOR mantle sources underwent melt extraction early in Earth’s history, leaving them depleted in incompatible elements, whereas OI sources have higher concentrations of such elements and different Sr, Nd, and Hf isotopic evolution as a result. Distinction of ARC and OI sources of zircons can be challenging because similar or overlapping levels of TREE concentrations in zircons from these sources.
The ratios of specific pairs of trace- and rare-earth elements in zircons are more likely to be effective at revealing parent-magma composition as some partition coefficients covary with magma evolution and some ratios are associated with general magma type. The study by Grimes et al. (2015) analyzed TREE concentrations in over 5000 zircon grains, with each grain known to have been derived from one of the three major magma sources outlined above. Element ratios that were most effective in identifying magma sources include U/Yb, Sc/Yb, Nb/Yb, Nb/Sc, and U/Nb. The 2480 Ma zircon grains analyzed for this study are plotted on five graphs of element ratios with fields identified for each major magma source as determined by Grimes et al. (2015; fig. 9). The 2480 Ma zircons are not associated with MOR magmas in any of the graphs, but in three graphs these zircons plot well within the field for OI zircons (fig. 9A, 9B, 9C). In figures 9D and 9E the 2480 Ma grains plot in the boundary zone between zircons derived from ARC and OI magmas. In figures 9A and 9B the 2480 Ma zircons plot with an order of magnitude lower Sc/Yb than the ARC field, while in figure 9C they plot with an order of magnitude greater Nb/Sc than ARC zircons. These trace element ratios thus suggest an oceanic island source.
4.5. Summary
The 2480 Ma zircon population in the Vishnu Schist and related metapsammite in northwestern Arizona is characterized by many distinctive properties, as follows: (1) The extensive area containing schist with 2480 Ma zircons, and high abundance of 2480 Ma zircons in some samples, indicate a large, perhaps batholith-size source, (2) a 207Pb/206Pb date of 2480.0 ± 27.3 (2SE) Ma from 89 zircon grains from widely spaced samples, (3) statistically smaller average analytical uncertainty and smaller deviation from U-Pb concordance than is generally characteristic of other analyzed zircon grains in Vishnu Schist and related units in Arizona, (4) a weighted mean age of 2480.0 ± 0.9 (2SE) Ma that reflects a high level of laboratory precision and insignificant post-crystallization mobilization of U and Pb, (5) quartz inclusions in zircons that indicate derivation from a felsic magma, (6) low Th/U and low heavy rare-earth element concentrations that suggest crystallization from an intermediate to felsic magma, (7) high temperatures of zircon crystallization indicated by titanium concentrations in the zircons, (8) high levels of europium depletion that indicate zircon crystallization within or at the base of ∼30–40 km thick crust, and (9) trace-element geochemical characteristics consistent with derivation from an oceanic-island igneous source. The narrow range of U-Pb dates and the strongly linear relationship of U and Th in 2480 Ma zircons suggest derivation from a single igneous body, in contrast to the wide range of initial εNd identified by Holland et al. (2015) that suggests a heterogenous source, perhaps involving multiple intrusions.
5. 2480 Ma ZIRCONS IN OTHER AREAS
Identification of other areas with clastic strata containing the distinctive 2480 Ma zircon grains, and areas with igneous rocks of this age, could contribute to better understanding of Proterozoic paleogeography and tectonic displacements.
5.1. Western Laurentia
The nearest known locations where ∼2480 Ma zircons have been identified in igneous rock units are in three Cenozoic metamorphic core complexes in the Basin and Range tectonic province. The East Humboldt Range, located in the central Great Basin ∼600 km north of Vishnu Schist exposures, includes a monzogranite orthogneiss that yielded a U-Pb zircon age of 2449 ± 3 Ma (Premo et al., 2014; fig. 10). The Pioneer metamorphic core complex in central Idaho includes a 2.47 Ga quartz monzonite, but with initial εHf of −7 to −14 that is unlike Vishnu 2480 Ma zircons (Wilhelmi et al., 2019). Two Cenozoic plutons in the Grouse Creek Mountains, which are part of the Grouse Creek – Albion – Raft River metamorphic core complex in northwestern Utah and southern Idaho, yielded several zircon grains with zircon cores with ages of ∼2.5 Ga (Egger et al., 2003). Two orthogneiss units farther north, near Jeff Davis Peak in southwestern Montana, were dated by U-Pb zircon at ∼2480 Ma (Pearson et al., 2017). Except for the Jeff Davis Peak area, all these areas are west of the Archean Wyoming craton and it is not known if the zircons represent rock units that were part of the Wyoming craton or were juxtaposed with it by Proterozoic tectonic displacements (Foster et al., 2006; Mueller, Wooden, Mogk, et al., 2011; fig. 10). At least four ranges in the northwestern Wyoming craton, ∼1000 km north of Vishnu Schist exposures, have yielded evidence of ∼2.45 Ga tectonothermal activity (Harms & Baldwin, 2023; Mueller, Wooden, & Mogk, 2011). All these zircon dates and related magmatism and deformation could represent convergent tectonic activity, crustal thickening, and magmatism within the Beaverhead orogeny on the northwest margin of the Wyoming craton (Harms & Baldwin, 2023). While there is evidence of earliest Paleoproterozoic igneous and metamorphic activity in and west of the Wyoming craton, a candidate for the source of 2480 Ma Vishnu zircons has not been identified in these areas.

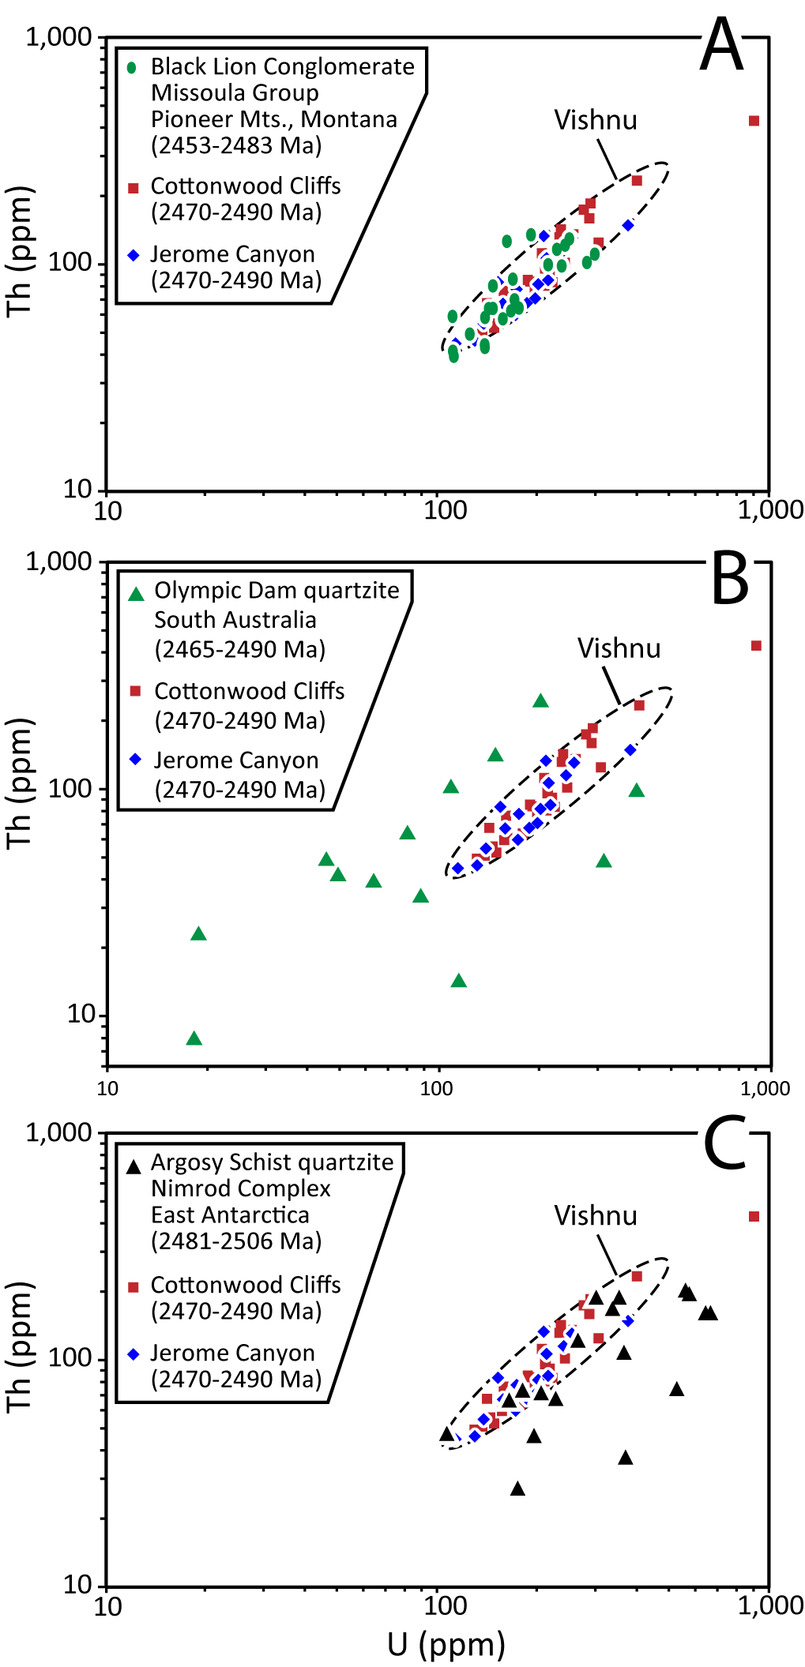
An additional indication of proximity to the source of the 2480 Ma zircons is represented by the Black Lion Conglomerate in the Pioneer Mountains of southwestern Montana (fig. 10). Sandstone from this unit, which is tentatively correlated with the Mesoproterozoic Belt Supergroup (McDonald et al., 2012; McDonald & Lonn, 2013), yielded a detrital-zircon age spectrum with a peak at 2476 Ma defined by 24 of 71 zircons (Link et al., 2016; fig. 11D). U and Th analyses of these 24 zircon grains match those of the Cottonwood Cliffs and Jerome Canyon zircon analyses (fig. 12A), supporting derivation of the zircons from the same source as for the Vishnu 2480 Ma zircons. Unlike the Arizona 2480 Ma zircon population that contains ∼2% slightly younger zircon grains dated at 2455–2470 Ma, the Black Lion Conglomerate contains 17% grains in this age range (n=12), suggesting a significant period of igneous activity that immediately followed 2480-Ma magmatism but is poorly represented in Vishnu and related Arizona samples. The Black Lion Conglomerate has been associated with the Belt Supergroup (McDonald & Lonn, 2013), indicating a Mesoproterozoic age that is ∼300 Ma younger than the Vishnu Schist and suggesting a long period of at least intermittent exposure of the 2480 Ma zircon source. The age of the Black Lion Conglomerate is uncertain, however, as the analysis by Link et al. (2016) identified no zircon grains younger than ∼1800 Ma and its age is not well constrained by other geologic data.

5.2. Gawler craton
Archean and Proterozoic crustal elements within Australia and Antarctica were possibly adjacent to the Yavapai and Mojave tectonic domains of (now) southwestern Laurentia during the time of Vishnu basin sedimentation (e.g., Betts et al., 2008; Gibson & Champion, 2019; Goodge & Fanning, 2016; Holland et al., 2018; Verbaas et al., 2018). We reviewed published detrital-zircon data from Australia and Antarctica to locate ∼2480 Ma zircon populations that could have been derived from the same source as the Vishnu zircons.
Zircons with U-Pb ages similar to 2480 Ma Vishnu zircons were identified in South Australia. Mineralization at the giant Olympic Dam Cu-U-Au-Ag deposit on the Gawler craton occurred largely within a brecciated 1594 Ma granite and was associated with granite emplacement and cooling (Cherry et al., 2018; Courtney-Davies et al., 2020; Ehrig et al., 2021). Overlying clastic strata, consisting primarily of sandstone and mudstone, include a quartz-rich sandstone penetrated by two drill holes. Six hundred and thirty U-Pb analyses of zircon grains from the quartz-rich sandstone yielded dates from 199 grains with 90%–103% concordance and 1SE analytical uncertainty of <10 m.y. (Cherry et al., 2017; McPhie et al., 2016, analysis by LA-ICP-MS at the University of Tasmania). These 199 analyses are plotted on a probability density plot (fig. 11E) along with analyses of three Vishnu basin samples from Arizona (fig. 11A, 11B, 11C). Two sets of age peaks, one at 1729–1738 Ma and the other at 2471–2481, are approximately aligned, and the younger peak is higher, for all four sample data sets. The 1588 Ma age peak of the youngest zircons from the Olympic Dam quartz-rich sandstone is the maximum depositional age. Deposition of the Olympic Dam quartzite thus occurred at least ∼150 million years after deposition of the Vishnu Schist protolith. The age peak of 2471 ± 21 Ma determined by McPhie et al. (2016) is within the range of the 2480.0 ± 27.3 Ma (2SE) date for the Vishnu age spike that includes systematic uncertainties.
Regardless of similarities in age spectra, Th and U analyses of the 13 ∼2471 Ma Olympic Dam zircons do not match the linear trend characteristic of the northwest Arizona 2480 Ma zircons (fig. 12B). Because of the low uncertainty and high concordance in U-Pb isotopic analyses of 11 of 13 of these zircons, it is unlikely that variable U/Th resulted from post-crystallization hydrothermal or metamorphic activity. We conclude that the ∼2480 Ma zircon grains in the Olympic Dam and Vishnu Schist metasediments were not derived from the same source. Furthermore, widely varying U/Th along with low uncertainty and high concordance suggests that the ∼2480 Ma Olympic Dam zircons were derived from diverse sources.
5.3. East Antarctica
Most recent reconstructions of Laurentia and Australia-Antarctica place the Mojave province and Vishnu basin near the Nimrod crystalline complex of the central Trans-Antarctic Mountains (e.g., Gibson & Champion, 2019; Goodge et al., 2017; Holland et al., 2018). Quartzite in the Argosy Schist of the Nimrod crystalline complex yielded a zircon age spectrum from 60 zircons that includes a sharp age peak defined by 23 zircons with a weighted mean age of 2499 ± 3.6 Ma (Goodge & Fanning, 2016; age and uncertainty calculated with Isoplot 3.7 using Gaussian deconvolution (Ludwig, 2008)). This weighted mean age is within the 2SE uncertainty of the 2480.0 ± 27.3 Ma age for the Vishnu zircon age spike that includes systematic uncertainty. Correlation of zircon populations is unlikely, however, as the Argosy quartzite zircons have a range of U/Th ratios that do not match the Vishnu zircons and are so scattered that they do not appear to have been derived from a single igneous rock unit (fig. 12C). Furthermore, uncertainties associated with individual Argosy zircon analyses are similar for older and younger zircons and not less as with the 2480 Ma Vishnu zircons (Goodge & Fanning, 2016).
6.0 CHARACTERIZATION OF THE IGNEOUS SOURCE
6.1. Source in the Wyoming craton
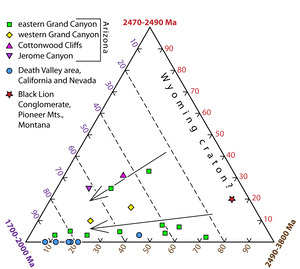
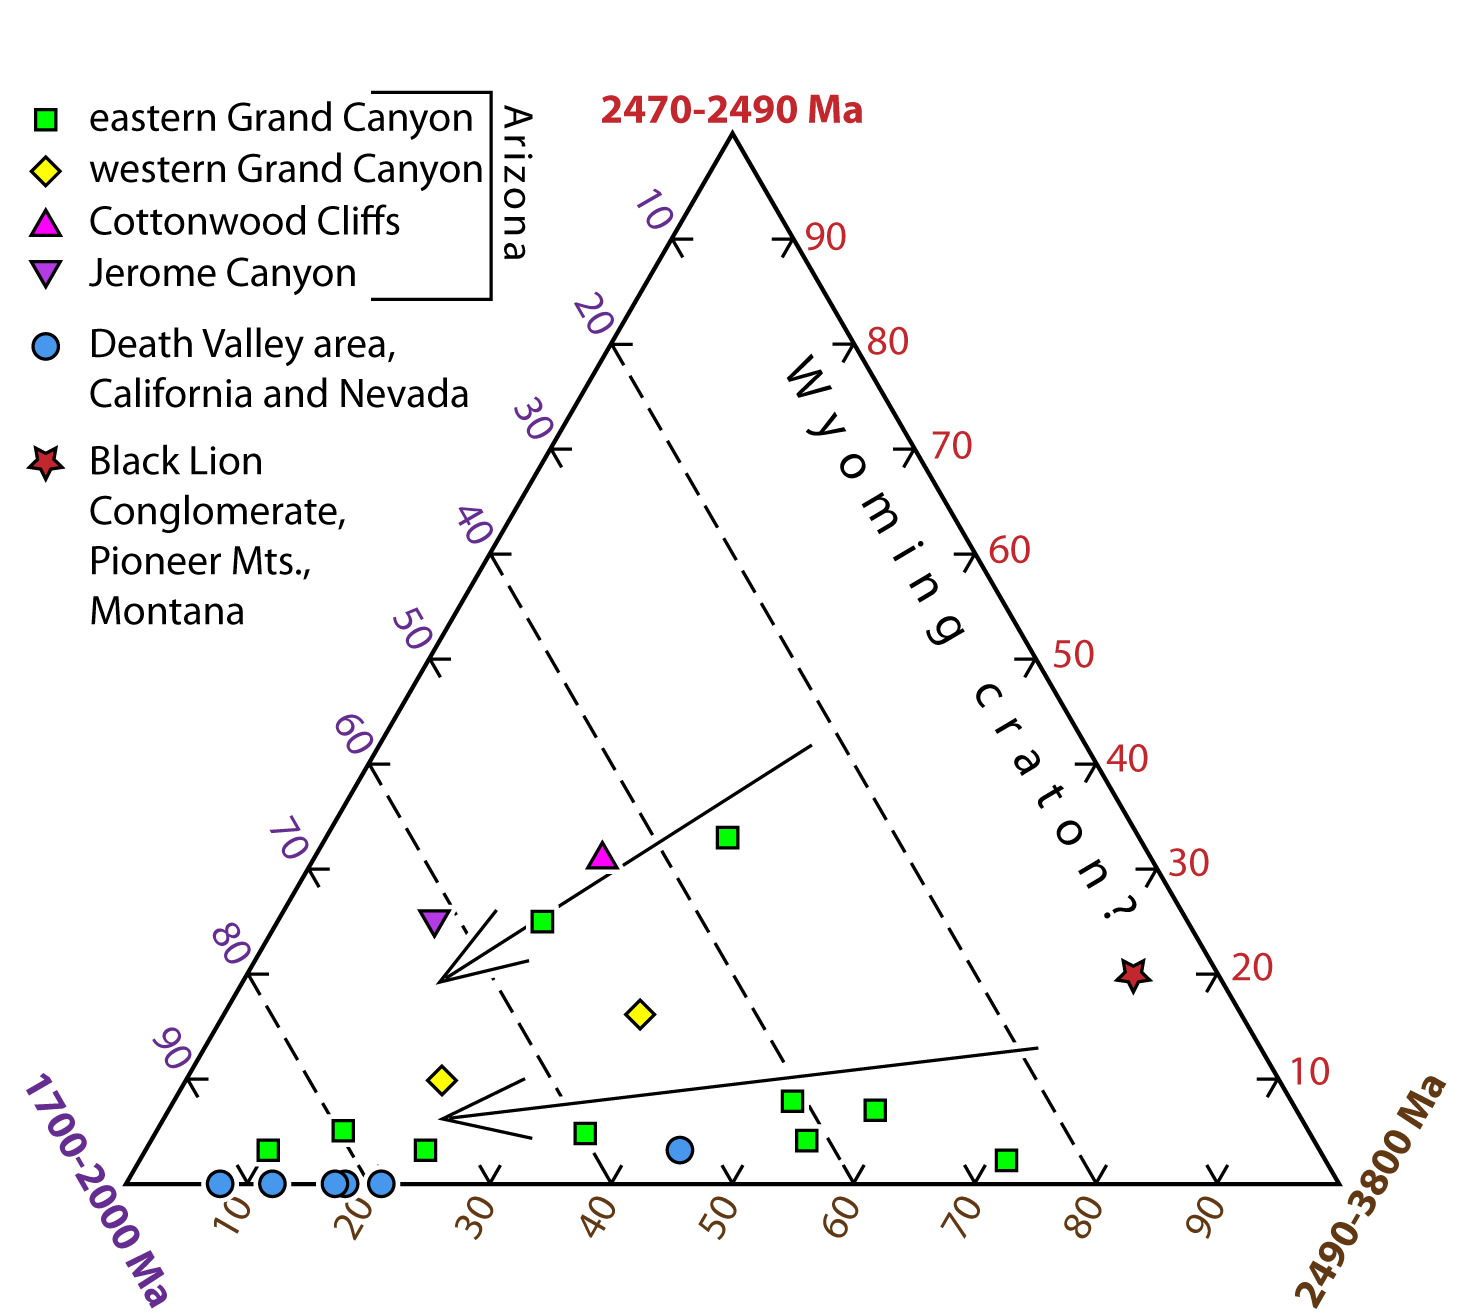
A literature search for detrital-zircon analyses of sedimentary rock units with an ∼2480 Ma age peak identified three quartzose metasedimentary units with similar peaks but only one with appropriate zircon U/Th ratios. That unit, the Mesoproterozoic(?) Black Lion Conglomerate in southwestern Montana, also contains abundant 2500–3500 Ma grains that are broadly similar to the ages of Archean rock units in the adjacent and possibly underlying Archean Wyoming craton (Mogk et al., 2023). A ternary diagram of detrital-zircon populations from Vishnu and related metasedimentary units reveals what appears to be a mixing trend between (1) a mix of Archean and 2480 Ma grains that is represented by the one analysis of the Black Lion Conglomerate (Link et al., 2016) and (2) Paleoproterozoic zircon grains with abundant 1700–2000 Ma zircons as is characteristic of the Mojave and Yavapai tectonic provinces (fig. 13). At least two arrows are necessary to show this mixing trend, suggesting multiple sand-dispersal pathways from the Wyoming craton to the greater Vishnu basin area in southwestern Laurentia. The association of 2480 zircon grains with Archean zircon grains in the Black Lion Conglomerate leads to our inference that the 2480 Ma zircon source was in the Wyoming craton. Although 2480 Ma igneous units have not been identified in the Wyoming craton, most of it is covered by younger strata, its lateral extent beneath the cover is poorly constrained, and parts of it could have been displaced or destroyed by Proterozoic tectonic processes.
6.2. A batholithic source
The large volume of the igneous source of the 2480 Ma zircons is indicated by the ∼40,000 km2 area containing the scattered exposures of Vishnu Schist and related units in northwestern Arizona (fig. 1). If protolith clastic sediments were deposited over a comparable area and averaged 1 km in thickness, and 5–20% of the zircons in the sediments were 2480 Ma zircons, then at least 2,000–8,000 km3 of clastic debris were derived from this 2480 Ma igneous source. This is a very crude estimate given the sparse and highly discontinuous exposures and strongly deformed nature of the schist. Furthermore, a smaller volume of clastic debris would be sufficient if the igneous source contained an unusually high abundance of zircon grains, as with Grenville and 1.4 Ga Laurentian granitic rocks (Dickinson, 2008). The 2480 Ma zircon source was unlikely to have been a sheet-like ignimbrite at Earth’s surface as it was >600 m.y. older than the depositional age of the Vishnu Schist protolith and was likely affected by multiple geologic processes over that time including erosion, burial, and deformation. A thick batholithic source is more likely to provide such a large volume of debris after hundreds of millions of years.
6.3. Zircon geochemical and geochronologic homogeneity
The low uncertainty in 207Pb/206Pb dates of the 2480 Ma Vishnu zircons indicate complete dissolution of xenocrystic zircon, which requires zirconium undersaturation in the primary intruding magma and, probably, high magma temperatures to promote xenocryst dissolution. During LA-ICP-MS analysis of a single crystal, pulsed laser vaporization at the ablation spot excavates through growth layers of the crystal. Variations in Pb isotopic composition reflecting gradual or intermittent crystal growth, or post-crystallization addition or removal of U or Pb near zircon margins, would result in greater uncertainty for each analysis (Gehrels et al., 2008). Complex zircon growth histories, leading to older cores and younger rims, increase analytical uncertainty if laser ablation crosses an age boundary in the zircon grain during progressive laser pulses (e.g., Guitreau et al., 2018). Zircon dates from older core regions were not recognized in 2480 Ma Vishnu zircons, however, and distinctive zircon cores and rims are not apparent in cathodoluminescence images. The consistency of U-Pb isotopic composition and U/Th ratios support the interpretation that the 2480 Ma Vishnu grains were derived from a single igneous rock unit, or an assemblage of igneous rock units of similar age and chemistry, that did not contain inherited zircon cores at the time of crystallization.
Numerous studies of mid-Cenozoic volcanic fields in the southern Rocky Mountains indicate that many large ignimbrites and other caldera-related igneous rock units contain few or no xenocrystic zircons (Bachmann et al., 2007; Lipman & Bachmann, 2015; Rosera et al., 2013; Tappa et al., 2011; Zimmerer & McIntosh, 2012, 2013). The absence of older zircon cores in these rock units is consistent with igneous processes in which inherited zircons are resorbed during multiple injections of magma, with injections of zirconium-undersaturated magma leading to zircon dissolution. Distal intrusions not within the central batholith for major volcanic provinces contain higher proportions of inherited zircon, but igneous units within or above a batholith-scale intrusive complex are largely to entirely devoid of pre-batholithic xenocrystic zircons or zircon cores (Lipman & Bachmann, 2015). We infer that the 2480 zircons were derived from a batholithic source formed by similar igneous processes, although not necessarily from subduction-related magmatism as with mid-Cenozoic magmatism in the southern Rocky Mountains.
6.4. Hotspot magmatism
Most of the features that characterize the 2480 Ma zircon population can be accommodated by hotspot magmatism within continental crust, as at Yellowstone. Nb/Yb, Sc/Yb, and Nb/Sc ratios in 2480 Ma zircons and high temperatures of crystallization indicated by Ti-in-zircon thermometry are both consistent with hotspot-type magmatism. The calderas along the Yellowstone hotspot track are associated with rhyolites with a variety of facies indicating unusually high eruptive temperatures, including intense welding, large-volume rhyolitic lava flows and lava lakes, and rheomorphic flows where voluminous ignimbrites were emplaced at high temperatures and then flowed like lavas (Branney et al., 2008). Similar rheomorphic tuffs and other evidence of high-temperature silicic eruptions characterize other areas of hotspot-type magmatism and rifting (e.g., Green & Fitz, 1993; Milner et al., 1992). High magmatic temperatures leading to melting and assimilation of Archean crust and dissolution of older zircons are inferred for the batholithic source of the 2480 Ma zircons, consistent with hotspot magmatism within continental crust.
Of the 16 ∼2480 Ma zircon grains that were scanned with an electron microprobe, five contain quartz inclusions, one of which is associated with biotite (fig. 5). The biotite in this inclusion suggests crystallization at moderate temperatures from a hydrous magma, unlike the generally anhydrous and mica-absent lavas and tuffs derived from high-T hotspot magmatism such as at Yellowstone (Christiansen, 2001). The biotite crystal possibly reflects hydrothermal alteration near the top or side of the magma chamber (e.g., Troch et al., 2018) or assimilation of hydrous crust. Partial or complete melting of pelitic sediments generally produce muscovite-bearing peraluminous granites with complex zircon ages due to incomplete digestion of pre-existing zircons, zircon overgrowths related to hydrous fluid movement, and new zircon growth associated with muscovitic and pegmatitic magmatism (e.g., G. H. Davis et al., 2019). The geochronologic homogeneity of the 2480 Ma zircons, however, indicates entirely different processes.
7. DERIVATION FROM THE MATACHEWAN LARGE IGNEOUS PROVINCE?
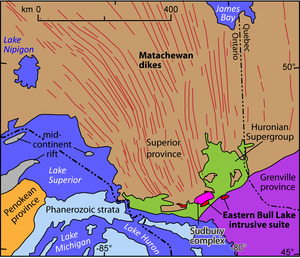
Magmatism represented by the 2.45–2.48 Ga Matachewan Large Igneous Province (LIP) in the Superior craton has been proposed as the trigger for initial, incomplete rifting of the Superia protocontinent and separation of the Wyoming and Superior cratons (Ernst & Bleeker, 2010; Kilian, Bleeker, et al., 2016; Kilian, Chamberlain, et al., 2016). Igneous rocks of the Matachewan LIP are represented primarily by the Matachewan and Hearst mafic dike swarms and the gabbroic East Bull Lake intrusive suite in central Ontario (fig. 14). Thousands of generally north- to northwest-striking, mafic dikes over ∼300,000 km2 within the Superior craton form a slightly radiating pattern north of Lake Huron and northeast of Lake Superior (Ernst & Halls, 1984; Fahrig & West, 1986). The dikes consist of iron-rich tholeiitic basalt with Ca-rich (An80-85) plagioclase megacrysts and groundmass microphenocrysts of clinopyroxene and plagioclase (Ciborowski et al., 2015; Halls & Palmer, 1990; Heaman, 1997; Walsh, 2015). The East Bull Lake intrusive suite, located near Sudbury, Ontario, consists of about 10 gabbroic intrusions described primarily as gabbronorite and leucogabbronorite with a high-alumina tholeiitic composition (James et al., 2002). The East Bull Lake intrusion yielded a weighted mean 207Pb/206Pb age of 2472.2 ± 0.8 Ma from zircon and baddeleyite (Clough & Hamilton, 2017), whereas 10 of 11 U-Pb baddeleyite dates from Matachewan mafic dikes indicate emplacement at 2450–2462 Ma (Hamilton et al., 2017). Heaman (1997) dated baddeleyite from two Matachewan dikes at 2473 Ma (+16, −9 Ma, upper intercept on a 4-point concordia plot). The 2480 ± 6 Ma (2SE) Blue Draw intrusion in the Black Hills uplift of southwestern South Dakota (fig. 10) has been interpreted as a member of the Matachewan LIP (Dahl et al., 2006) but arc-type geochemistry does not support association with Matachewan magmatism (Van Boening & Nabelek, 2008).

The Matachewan dike swarm is truncated at the southern margin of the Superior craton. The Huronian Supergroup, deposited on the Superior craton along and near this margin (fig. 14), consists of a southward-thickening wedge of siliciclastic strata up to ∼12 km thick in western exposures north of Lake Huron (Craddock et al., 2013; Young et al., 2001). Primarily basaltic volcanic rocks near the base include a rhyolite dated at 2452.5 ± 6.2 Ma (Ketchum et al., 2013). Deposition of the Huronian Supergroup has been attributed to incipient rifting and breakup of the Superia protocontinent, with continued sedimentation over the following 250 m.y. within the rift (Craddock et al., 2013). The Wyoming craton, Hearne craton of northern Canada, and Karelian craton of the Baltic shield contain mafic dikes and/or passive-margin strata that roughly match the ages of the Matachewan LIP and the Huronian Supergroup. These cratons are inferred to have been adjacent to the (now) southern margin of the Superior province before initial rifting associated with hot-spot magmatism that produced the Matachewan LIP (Ernst & Bleeker, 2010; Heaman, 1997; Kilian, Bleeker, et al., 2016; Kilian, Chamberlain, et al., 2016; Mammone et al., 2022).
The Snowy Pass Group in the Sierra Madre Mountains and the Snowy Pass Supergroup in the Medicine Bow Mountains form part of the southern margin of the Wyoming craton (fig. 10). These strata consist of faulted sequences up to 10 km thick of metamorphosed and penetratively deformed diamictite, conglomerate, quartzite, shale, and metavolcanic rocks, with dolomite marble near the top of the sequences (Houston et al., 1992; Karlstrom et al., 1983). A rift environment leading to eventual open-marine conditions is suggested by the stratigraphic facies sequence and by paleocurrent indicators (Bekker & Eriksson, 2003; Karlstrom et al., 1983). U-Pb geochronologic analysis of detrital zircons from five units in the basal Phantom Lake Metamorphic Suite all indicate a maximum depositional age of 2.45 Ga (Mammone et al., 2022). Similar analyses of 14 units that make up all but the very top of the two Snowy Pass sequences indicate a dominant age peak at ∼2700 Ma, a peak that is essentially identical to the dominant age peaks in four correlated units in the Huronian Supergroup (Mammone et al., 2022). Similarities in detrital-zircon age spectra and stratigraphy between the Snowy Pass strata and the Huronian Supergroup are so numerous that deposition in close proximity seems nearly certain.
Restoration of the Snowy Pass Group and Supergroup to a position opposite the Huronian Supergroup would require an ∼2000 km translation and ∼130° rotation (Aspler & Chiarenzelli, 1998; Ernst & Bleeker, 2010; Kilian, Bleeker, et al., 2016; Kilian, Chamberlain, et al., 2016; Roscoe & Card, 1993), a restoration that is consistent with paleomagnetic data (Kilian, Bleeker, et al., 2016). The complete absence of Matachewan dikes in the Wyoming craton, however, is unsupportive of a reconstruction in which the Snowy Pass Group and Supergroup were deposited on strike with the Matachewan dike swarm. Regardless of details of reconstruction, magmatism in the Matachewan LIP was approximately coincident with initial breakup of the Superia protocontinent and initial deposition of thick continental margin strata in both the southern Wyoming craton and the southern Superior craton.
We suggest that Matachewan LIP magmatism that is associated with fragmentation of the Superia protocontinent included more than the exposed mafic dike swarms and intrusions in the Superior craton. Voluminous mafic volcanic rocks forming new crust during continent breakup must have been intruded and erupted at every rifted Superia margin but are now almost entirely concealed or destroyed. Intrusion of voluminous, hot, mafic magmas into Archean continental crust, leading to melting within continental crust and hotspot magmatism as along the Yellowstone hotspot track, could have been an important part of Matachewan LIP activity and breakup of Superia. We propose that the 2480 Ma zircons were derived from such felsic igneous intrusions in the Wyoming craton or emplaced along its developing margins.
7.1. Hf isotopes
The Nd and Hf isotopic composition of silicic volcanic rocks erupted along the Yellowstone hotspot track indicate genesis from a mixture of crustal and mantle sources, with voluminous basalts of the Snake River Plain reflecting the composition of melts derived from the mantle. From west to east along the hotspot track, εNd and εHf in silicic volcanic rocks decline over a short distance at the tectonic boundary between accreted oceanic terranes and Proterozoic to Cenozoic North American crust, and then rise and fall slightly over ∼500 km to the Yellowstone caldera (Nash et al., 2006). Mixing models based on εNd in silicic volcanic rocks estimate ∼20–70% for the mantle contribution to silicic magmas along the hotspot track (Nash et al., 2006).
If the 2480 Ma detrital zircons in Vishnu Schist and related units were derived from igneous rocks produced by a Yellowstone-like hotspot, then the zircons crystallized from a magma that was derived from a mix of crustal and deep mantle sources. The significant range of initial εHf in 2480 Ma zircons identified by Holland et al. (2015) indicates partial derivation from crustal sources with diverse Hf isotopic compositions and/or different mixing ratios of magmas derived from mantle and crustal sources. In either case, Hf isotopes were not homogenized in a single large magma chamber during melting and assimilation of host rocks. Neoarchean and earliest Paleoproterozoic zircons in the Vishnu Schist have a slightly larger range of initial εHf than do the 2480 Ma zircons in this age group (fig. 15). It seems likely that these 2400–2800 Ma zircons represent crustal materials like those that were melted and assimilated by 2480 Ma magmatism. The green arrows in figure 15B represent the evolutionary pathways of Archean crustal rocks after derivation from depleted mantle at ∼3.2–2.6 Ga and before melting and zircon crystallization at 2480 Ma. The slope of these arrows is unknown, however, as the Lu/Hf ratios of the Archean crustal components are poorly constrained as is the εHf composition of the inferred 2480 Ma, mantle-derived hotspot magma. We suggest that diverse initial εHf in 2480 Ma zircons, along with the narrow age peak for 2480 Ma magmatism, resulted from a large aerial extent of crustal melting associated with a mantle plume head impinging on deep crust (e.g., Coffin & Eldholm, 1994), with resulting ascent of multiple magma bodies that did not mix in a single large magma chamber but each rose and crystallized at about the same time.
__hf__and__nd__isotopic_composition_of_modern_oceanic_island_basalt_(oib)_and_mid-oc.tif)
8. CONCLUSION
Most of the characteristics of the 2480 Ma zircon population support, or are consistent with, crystallization in a magmatic system associated with intra-continental hotspot-type magmatism. These characteristics include the following: (1) The source must have been voluminous, probably many thousands of cubic kilometers, as the 2480 Ma detrital zircons are abundant in widely spaced samples of siliciclastic strata deposited hundreds of millions of years after zircon crystallization. (2) The narrow range of 207Pb/206Pb dates, the linear array of U vs Th content, and a range of εNd values indicate derivation from a closely related set of magmas with no xenocrystic zircons. (3) Nb/Yb, Sc/Yb, and Nb/Sc ratios support the interpretation that the 2480 Ma zircons were derived, at least partially, from an oceanic-island-type magma. (4) Average titanium content in 2480 zircons indicates minimum crystallization temperatures of ∼740–800 °C, which is unusually hot for crystallization in most felsic magmas but consistent with elevated temperatures in hot-spot-related, intracontinental silicic magmatism, especially with higher temperatures of early Earth’s mantle (Grove & Parman, 2004).
The high level of europium depletion in the analyzed 2480 Ma zircon grains indicates that plagioclase crystallization had removed most of the europium in the host magma before zircon crystallization and suggests that zircon crystallization occurred within continental crust that was ∼30–40 km thick. Quartz and one biotite crystal that form inclusions in 2480 Ma zircon grains indicate zircon crystallization in a felsic magma. The presence of biotite in one inclusion suggests crystallization from a hydrous magma, which is unlike essentially anhydrous Yellowstone hot-spot magmatism but perhaps feasible if anhydrous hotspot magma intruded and melted much hydrated crust.
Evaluation of other Proterozoic sandstone and quartzite units in North America, Australia, and East Antarctica that potentially contain 2480 Ma zircons identified three similar-age populations, but only the Black Lion Conglomerate in southwestern Montana contains 2480 Ma zircon grains with Th/U ratios like the northwestern Arizona population. The Black Lion Conglomerate contains almost exclusively Archean and 2480 Ma zircon grains, as would be expected for derivation from the nearby Wyoming craton if it contained the 2480 Ma zircon source. We infer that the 2480 Ma zircon source was within the Wyoming craton and that zircon dispersal across the Yavapai and Mojave tectonic provinces resulted in increasing dilution by Paleoproterozoic zircon grains with greater distance to the southwest toward the Mojave province. Breakup of the Wyoming and Superior cratons during initial Matachewan LIP magmatism provides a plausible tectonic setting and appropriate timing for magmatism that produced the 2480 Ma zircon source.
ACKNOWLEDGMENT
Trace- and rare-earth-element analyses were done at the Arizona Laserchron Center (ALC) at the University of Arizona, with support to the ALC from NSF grant #EAR-2050246. We thank George Gehrels for access to the ALC laboratory and for useful comments on an earlier draft. National Science Foundation grant EAR-1145247 to Karl Karlstrom helped fund detrital-zircon geochronologic analyses reported in Mike Doe’s Ph.D. dissertation and discussed and evaluated here. We thank Karl Karlstrom and Daniel T. Brennan for constructive and thoughtful reviews, and AJS Editor Mark Brandon for helpful comments. We also thank Associate Editor Tony Kemp and two anonymous reviewers for constructive comments on an earlier draft that was rejected by Precambrian Research. We declare that we have no competing interests regarding the content and publication of this manuscript.
AUTHOR CONTRIBUTIONS
Trace- and rare-earth-element analyses were done by M. Doe at the Arizona Laserchron Center at the University of Arizona. Electron-microprobe scans and mineral identification by energy-dispersive x-ray spectroscopy was done by K. Domanik at the Lunar and Planetary Laboratory at the University of Arizona. The paper was conceived by Spencer and Doe and written by Spencer.
Supplementary Data
https://doi.org/10.5061/dryad.6djh9w189
Editor: Mark T. Brandon