1. Introduction
The quantitative characterization of faulting and folding in sedimentary basins is an essential field in structural geology and several other geoscience subdisciplines, such as seismology, geomorphology, petroleum geology and Quaternary geology. In this field, fault-related folding, which describes fold evolution not only geometrically but also temporally, as linked to fault movement (Suppe & Medwedeff, 1990), is a significant deformation mechanism. Fault-related folding plays a dominant role at upper crustal levels, including contractional (e.g., Biju-Duval et al., 1982; Boyer, 1986; Bump, 2003; Burbank et al., 1999; Calamita et al., 2012; Corredor et al., 2005; Delcaillau et al., 1998; Erslev & Mayborn, 1997; Ford et al., 1997; Gulick et al., 2004; Homza & Wallace, 1997; McClay, 2011; Morley et al., 2011; Tozer et al., 2002; Vann et al., 1986), extensional (Ferrill et al., 2012; Howard & John, 1997; Sharp et al., 2000), and even a few strike-slip regimes (e.g., Tindall & Davis, 1999). Since the first kinematic model of contractional fault-bend folds was introduced by Suppe (1983), based on the concept of constant-dip kink-band migration, several types of quantitative relationships between fold geometry and fault movement have been revealed (e.g., Epard & Groshong, 1995; Mitra, 2003; Poblet & McClay, 1996; Suppe & Medwedeff, 1990), leading to the rise of the kinematic approach. Correspondingly, growth strata (syntectonic strata) deposited during deformation provide a complete, decipherable record of deformation because their geometry is controlled primarily by the folding mechanism and the relative rates of sedimentation and uplift (Shaw et al., 2005; Suppe et al., 1992). Therefore, the geometry of the growth strata plays an important role in determining the amount and rate of deformation, helping to understand the detailed folding and faulting processes (Allmendinger, 1998; Poblet et al., 1997; Shaw et al., 2005; Suppe et al., 1992).
1.1 Motivation of this work
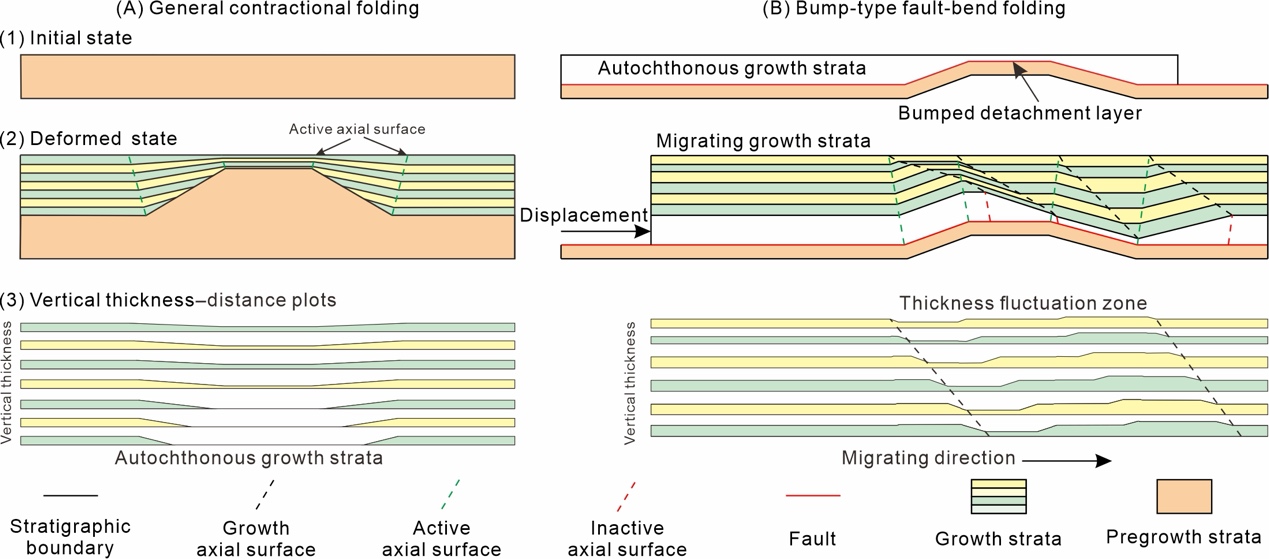
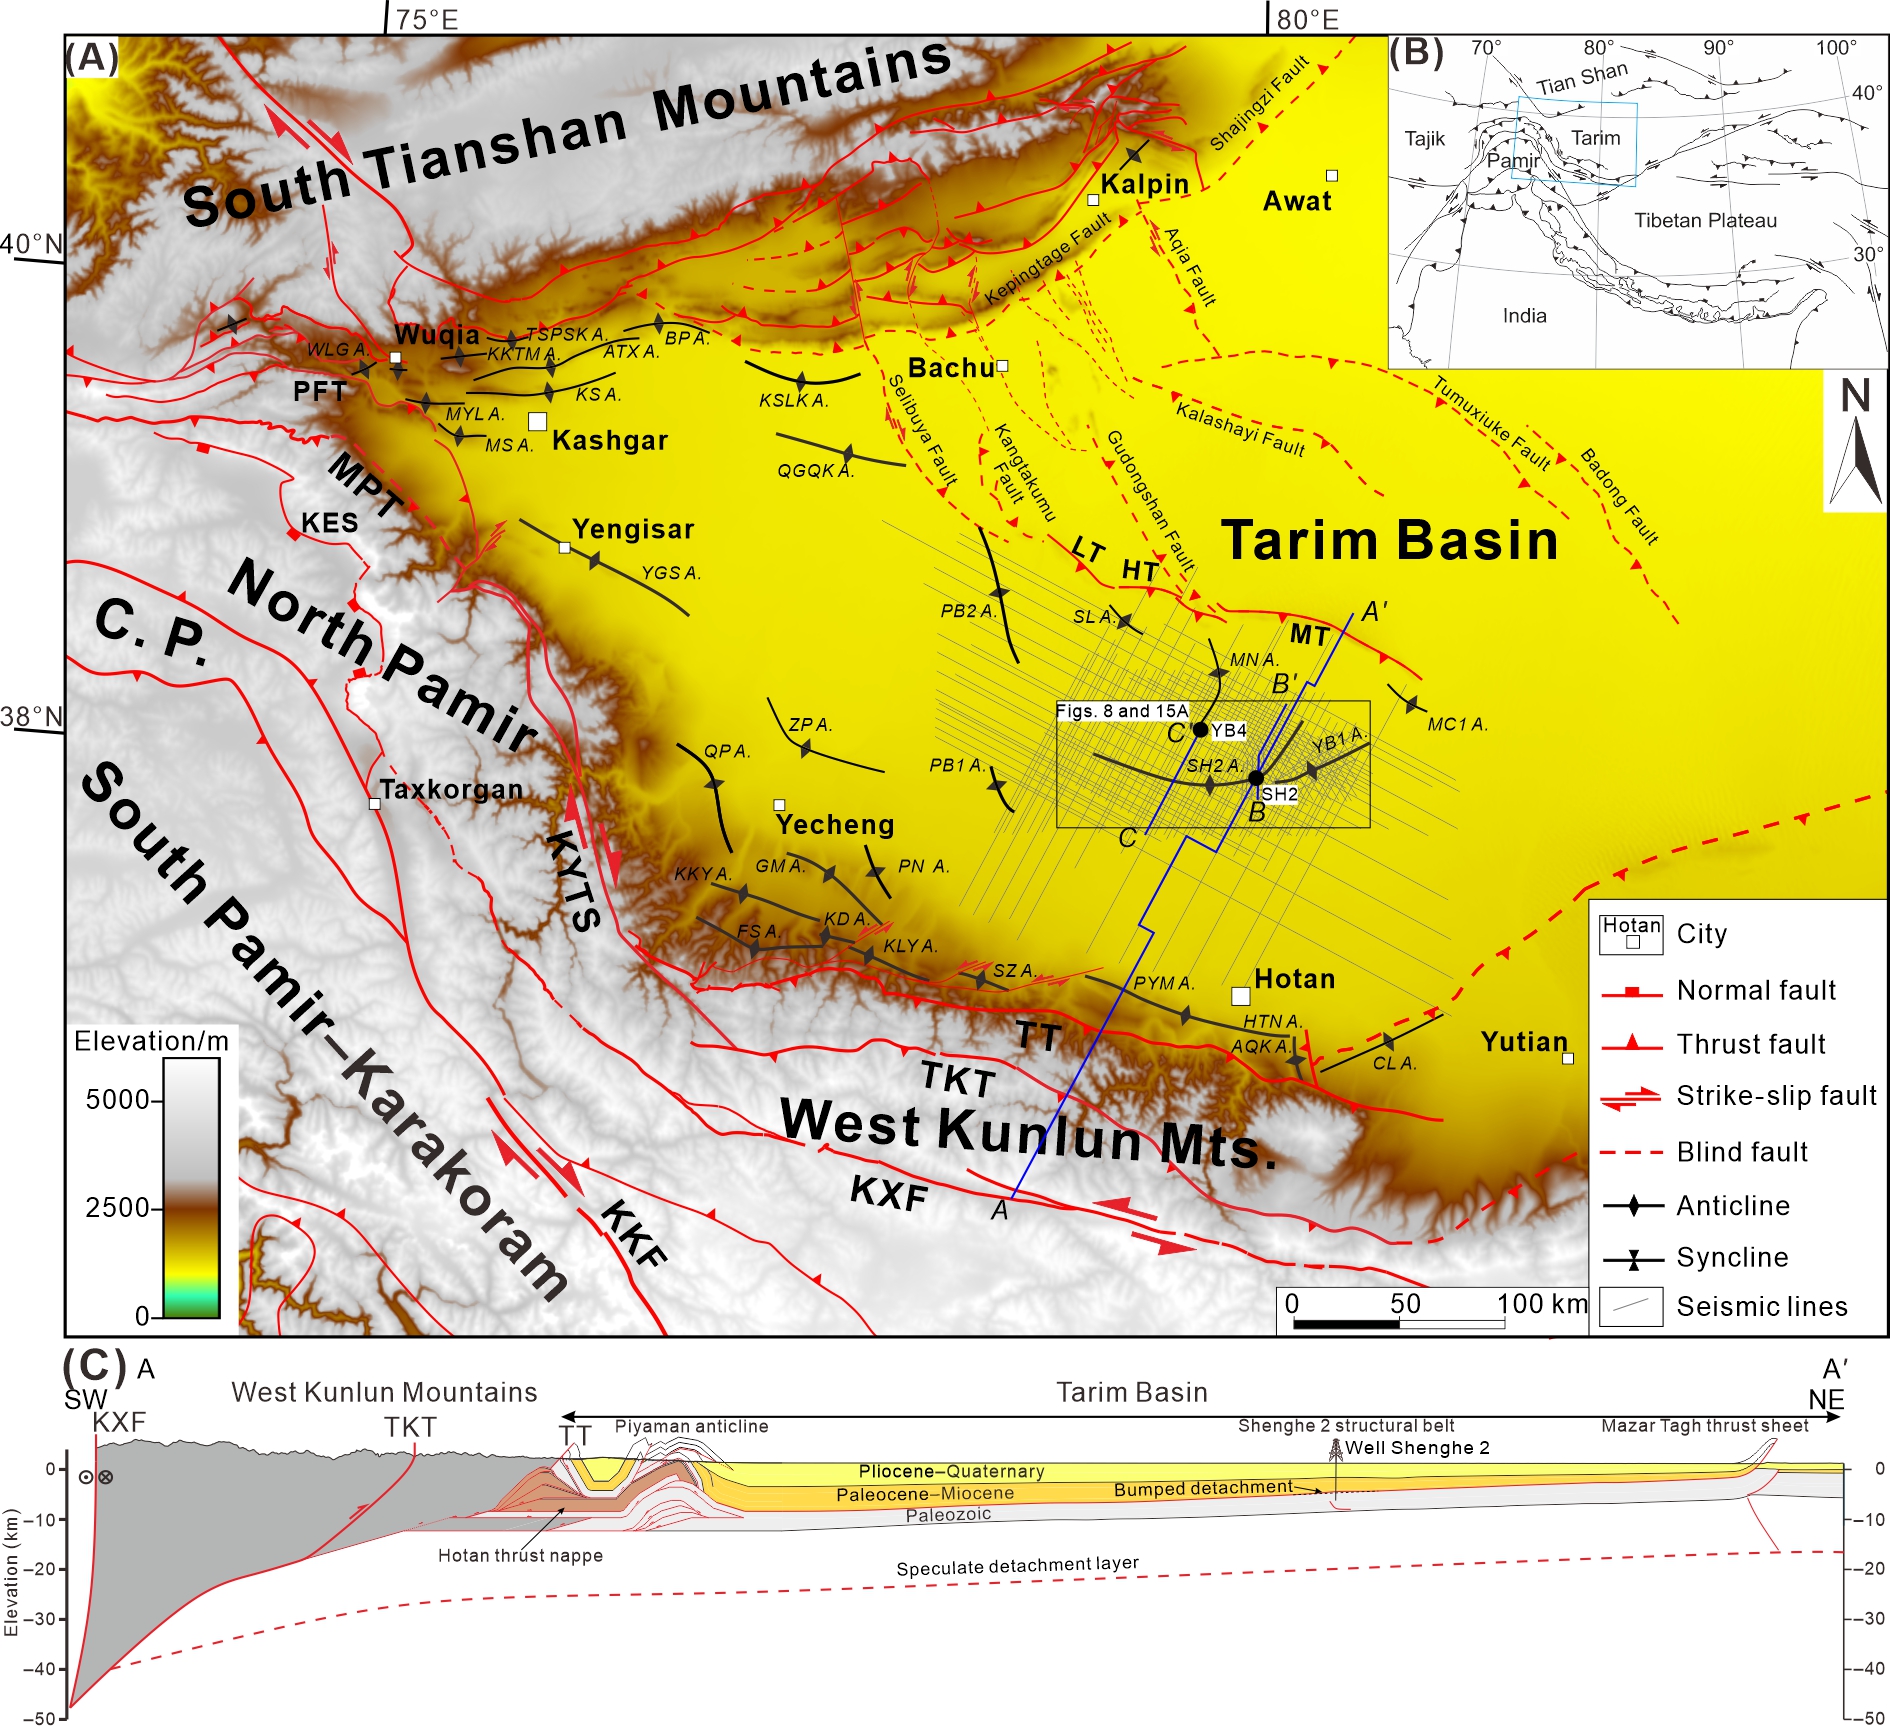
For basic (simplest) types of contractional fault-related folds, growth strata are typically thin across fold limbs toward structural highs, such as fault-bend folds, fault-propagation folds, and detachment folds. In the vertical thickness–distance plot, the thinning positions of these growth sequences are the same (no migration), which are referred to here as ‘autochthonous growth strata’ (fig. 1A; Shaw et al., 2005). In contrast, a recently defined type of growth strata is inconsistent with this general thickness pattern. It is termed the ‘migrating growth strata (MGS)’ (H. Chen et al., 2022) and developed between the Hotan thrust nappe and ~230 km to the north of the Mazar Tagh Cenozoic thrust sheet within the West Kunlun Cenozoic foreland thrust system (H. Chen et al., 2022; Guilbaud et al., 2017; Laborde et al., 2019; Liang et al., 2012; Suppe et al., 2015; X. Wang et al., 2014) on the northwestern margin of the Qinghai–Tibetan Plateau (fig. 2A and B). Developed on the Shenghe 2 structural belt, the MGS are a product of material transport along a folded detachment layer, which is characterized by a rootless syncline (a syncline that exists above an undeformed, flat layer) beyond the forelimb of an anticline (e.g., fig. 1B; H. Chen et al., 2022). Studying the MGS not only determines the timing of the initiation of the underlying anticline and total northeastward slip of the Cenozoic thrust sheet, but also provides key evidence to confirm the kinematic linkage between the Hotan and Mazar Tagh structural belts (fig. 2C).
_general_contractional_folding_and_(b)_bump-type_fault-bend_f.jpeg)
_digital_elevation_model_image_showing_the_structural_elements_of_the_west_kunlun_cen.jpg)
However, there are still unsolved problems, such as the detailed slip history of the Cenozoic thrust sheet. Since the complete growth strata in the southwestern Tarim Basin are well preserved, the different slip increments during each time interval should be determined (e.g., J. Chen & He, 2022; Suppe et al., 1992), which is crucial for understanding the spatiotemporal strain partitioning of the West Kunlun Cenozoic foreland thrust system. Furthermore, because of the restricted two-dimensional cross-sections, the accurate slip orientation of the Cenozoic thrust sheet is unknown. Does the slip orientation exhibit along-strike variation? Since the MGS are identified as a sensitive indicator of material migration, the slip orientation can also be determined.
The growth stratal geometry allows for the reconstruction of the kinematic history, and a complex fault or detachment geometry can lead to complex growth stratal patterns. To evaluate the growth stratal geometry in terms of both temporal and spatial (i.e., along-strike) variability, we need to extend the sectional growth structure into a three-dimensional framework and establish a quantitative kinematic model of the folding process. Therefore, the aim and scope of this work are to 1) identify and characterize the new pattern of growth strata (interpretation of the growth stratal architecture follows the same principles established for fault-bend folds but has added complexity due to movement over a folded detachment layer); 2) propose a forward kinematic model to simulate the folding process and to determine the quantitative relationship between the geometry of growth strata and fault movement; and 3) analyze the structural trend in map view to determine the slip orientation and estimate the along-strike variation.
1.2. Defining bump-type fault-bend folding
Genetically, all fault-related folds are caused by changes in fault parameters (as summarized by Brandes & Tanner, 2014). In particular, fault-bend folds are formed due to changes in the dip of layer-cutting fault surfaces, causing a change in direction of the material transport (Rich, 1934; Suppe, 1983). Detachment folds are formed when the slip decreases along the length of a detachment fault (Poblet & McClay, 1996). Fault-propagation folds are also formed due to the decrease in slip along the length of a fault, but the fault cuts sedimentary layers (Suppe & Medwedeff, 1990). Here, we suggest that a new pattern of folds is formed due to material transport along a bumped (antiformal geometry) detachment layer (fig. 1B). When used as a noun, the word ‘bump’ is defined as a part of an otherwise flat surface that is not even but raised above the flat surface (a protuberance on an otherwise level surface). Thus, we define the folding mechanism of the migrating growth strata as bump-type fault-bend folding. Compared with classic fault-bend folding, bump-type fault-bend folds are also caused by changes in the fault dip, but the faults do not cut the neighboring layers (i.e., folded detachments).
The Shenghe 2 structural belt in the southwestern Tarim Basin provides an example for introducing a quantitative kinematic model of bump-type fault-bend folding (fig. 2). In this paper, we use borehole and 2D seismic reflection data to establish a comprehensive structural framework for this case. After characterizing the essential features of this type of folding, we simulate three initial models with different geometries of the bumped detachment layer. Structural trend analysis is also adapted to identify the slip orientation. Finally, we determine the quantitative relationship between growth strata geometry and basal Cenozoic detachment and provide an effective way to estimate slip via upward-narrowing kink bands in growth strata. With this quantitative relationship, we can identify pregrowth or growth strata by observing whether a layer has lateral thickness fluctuations. The stratigraphic age of the oldest growth sequence represents the timing of folding for bumped detachment. Furthermore, the migrating distances of the lateral thickness fluctuation zone in different growth sequences represent their experienced detachment fault displacements. This established kinematic model of bump-type fault-bend folding is useful for dating the folding age (folding of detachment) and quantifying the slip history and slip field of the detachment layer, which may be widely used in other thrust sheets that have experienced bump-type fault-bend folding.
2. Geological setting
Located in the southwestern Tarim Basin, the Shenghe 2 structural belt is characterized by a blind, curved anticline that developed in the Paleozoic tectonostratigraphic unit (SH2 A. in fig. 2A). This anticline is overlain by approximately 4 km of Cenozoic strata. Its western segment strikes northwest, while its eastern segment strikes northeast. The length of the Shenghe 2 anticline is ~81 km, and the maximum width is ~13 km.
2.1. Tectonics
The present-day basement of the Tarim Basin was formed in the early Neoproterozoic, indicating the final assembly of Rodinia (P. Zhao et al., 2021). During the Neoproterozoic, the Tarim Basin successively experienced rifting, a transition from rifting to depression, and a post-rifting depression from the Tonian to the Ediacaran (Shi et al., 2018). In addition, the Bolong and Yutang tillites (Cryogenian period) indicate two stages of glacial events (Shi et al., 2018). During the early Paleozoic, the southwestern Tarim Basin remained a passive margin due to the opening of the Proto-Tethys Ocean (Dong et al., 2016; D. He et al., 2005; Li et al., 1996; Liu et al., 2016; Tang et al., 2014; C.-L. Zhang et al., 2013). From the Middle Ordovician to Middle Devonian, a contractional regime developed due to the closure of the Proto-Tethys Ocean and subsequent collision between the northern and southern Kunlun terranes (Matte et al., 1996). From the Late Devonian to middle Permian, the southwestern margin of the Tarim Basin became a passive margin due to the opening of the Paleo-Tethys Ocean (D. He et al., 2005). From the late Permian to Early Triassic, a foreland basin system formed in the southwestern Tarim Basin (D. He et al., 2005), indicating the closure of the Paleo-Tethys Ocean and subsequent collisional orogeny (Xu et al., 2007). During the Neo-Tethys Ocean evolutionary stage (Jurassic and Cretaceous), the study area experienced several phases of extension (D. He et al., 2005). Since the Cenozoic, the India–Eurasia collision has significantly influenced the southwestern margin of the Tarim Basin, causing the rejuvenation of the West Kunlun Mountains and thin-skinned thrusting from the Hotan to Mazar Tagh structural belts in the southwestern Tarim Basin (Sobel & Dumitru, 1997).
2.2. Stratigraphy
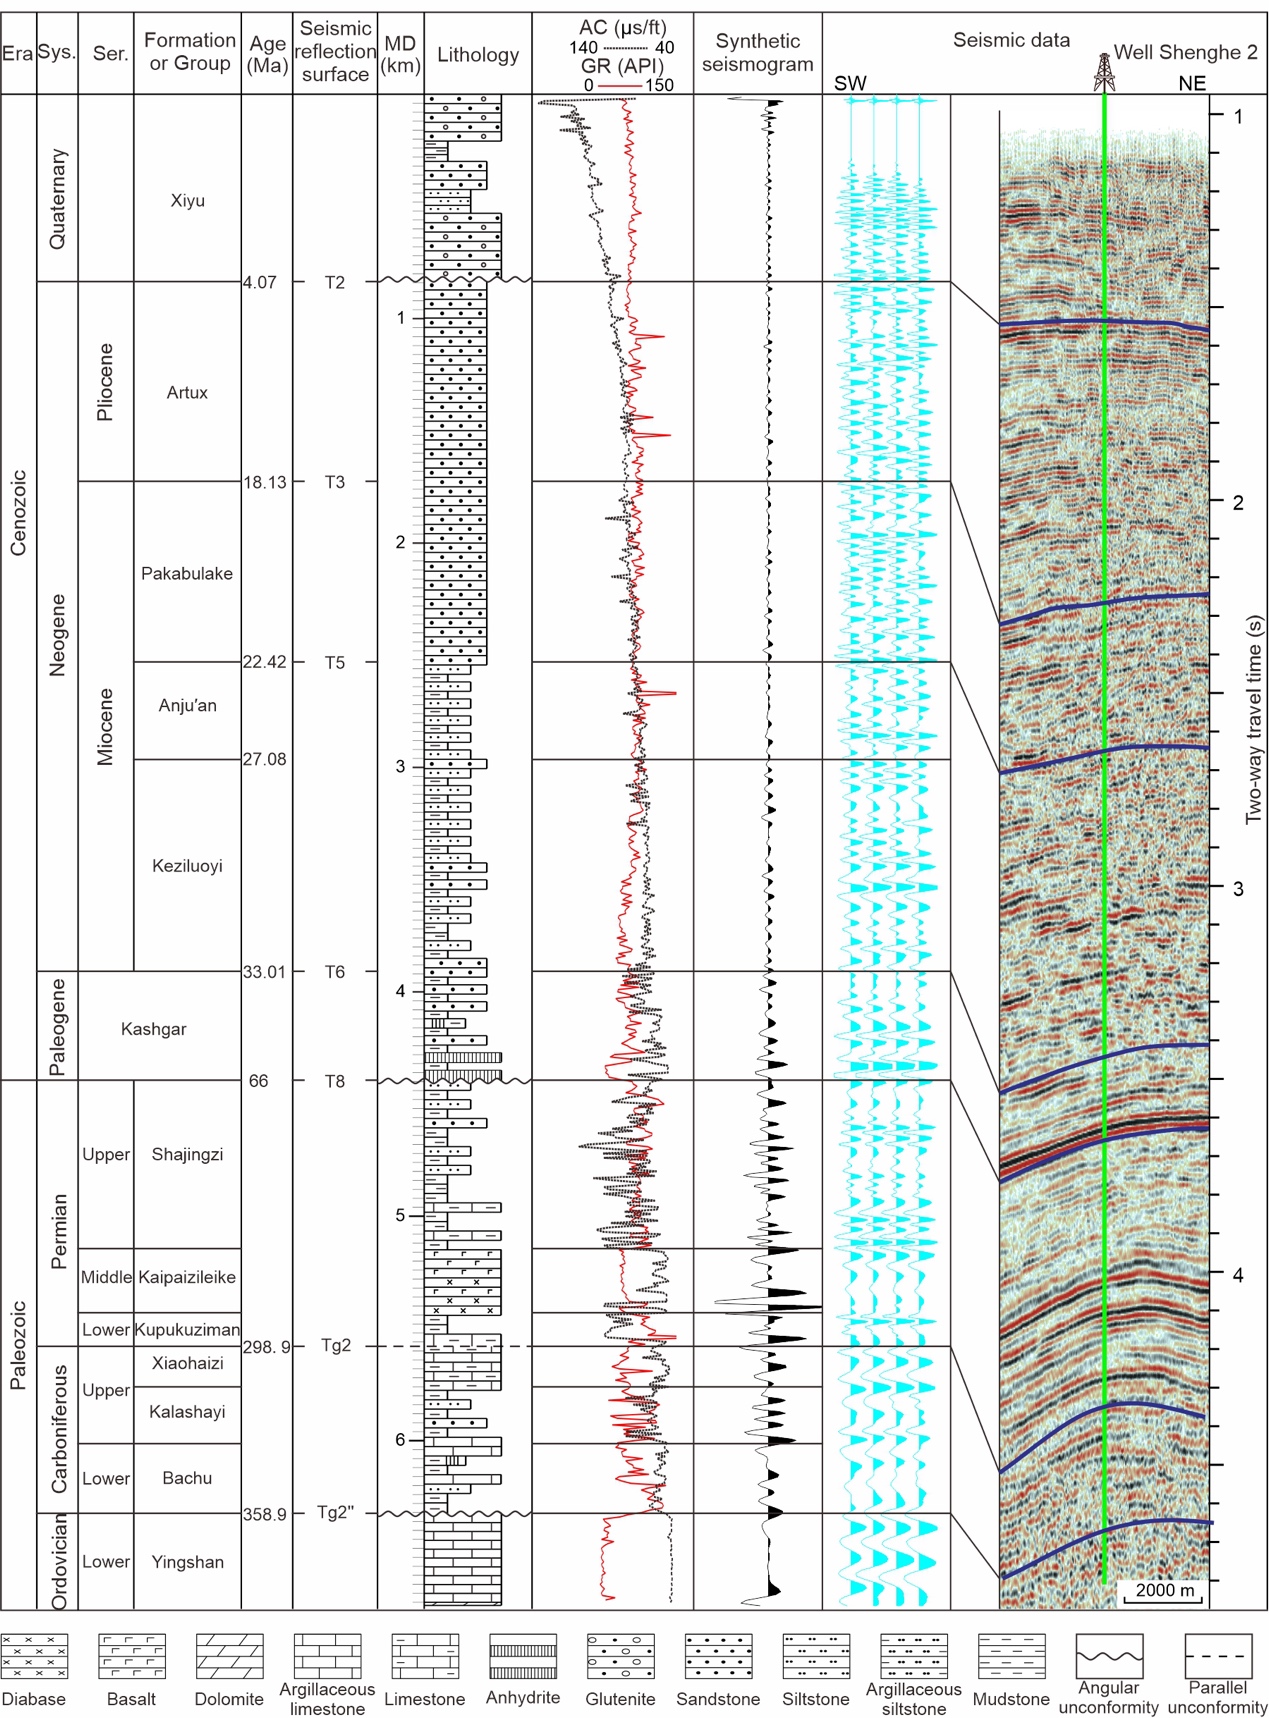
Paleontological, well-logging, and regional geological survey data provide detailed stratigraphic information on the Shenghe 2 structural belt. There are three major tectonostratigraphic units above the basement: lower Paleozoic (Cambrian and Ordovician), upper Paleozoic (Carboniferous and Permian), and Cenozoic units (fig. 3). The lower Paleozoic unit is characterized by shallow-marine carbonate and a middle Cambrian evaporite sequence. This evaporite sequence is a regionally weak layer, which is characterized by salt-related deformation (J. Chen, 2022). The upper Paleozoic unit is characterized by marine-terrestrial transitional deposits (limestones and clastic rocks). Specifically, the lower and middle Permian rocks are mainly composed of igneous rocks, indicating the Tarim Large Igneous Province (Yang et al., 2013). The Cenozoic unit consists of a complete and continuous sedimentary sequence from marine sediments to continental sediments. Due to the high content of gypsum, the lower part of the Paleogene Kashgar Group became a regional detachment layer, transporting the Cenozoic unit from southwest to northeast (Laborde et al., 2019; Suppe et al., 2015; X. Wang et al., 2014). This detachment layer, as well as the Paleozoic unit, was folded, exhibiting a bumped shape (fig. 2C). In cross-section, the upper Cenozoic sequences that thin to the northeast are typical of syntectonic sedimentation. The Neogene (Keziluoyi, Anju’an, Pakabulake, and Artux Formations) and Quaternary (Xiyu conglomerate) sedimentary sequences are characterized by terrestrial deposition and their lithology coarsens upward. For bump-type fault bend folding, the pregrowth strata contain Paleozoic stratigraphic units, the Paleogene (Kashgar Group), and the lower part of the Miocene layers (Keziluoyi Formation), while the growth strata are the upper part of the Miocene to Quaternary layers, which are characterized by the occurrence of a rootless syncline (H. Chen et al., 2022).

3. Data and methods
3.1. Seismic interpretation
We used 115 lines (~11174.3 km) of 2D seismic reflection profiles collected from 1996 to 2013 from the China National Petroleum Corporation (CNPC) and China Petrochemical Corporation (Sinopec). The seismic reflection data were processed using prestack time migration. Electronic logs and core-constrained formation tops from two wells (Shenghe 2 and Yubei 4) provided lithological information for interpreting and correlating the seismic reflection surfaces that mark the stratigraphic horizons. This calibration was achieved by generating a synthetic seismogram (fig. 3). Eight key horizons were interpreted, including the Quaternary base (T2), Artux Formation base (T3), Pakabulake Formation base (T5), Keziluoyi Formation base (T6), Cenozoic base (T8), Carboniferous base, upper Cambrian base, and Cambrian base. Because these data are in the time domain, not the depth domain, horizons were then depth-converted using a checkshot-derived time–depth relationship.
3.2. Axial surface mapping
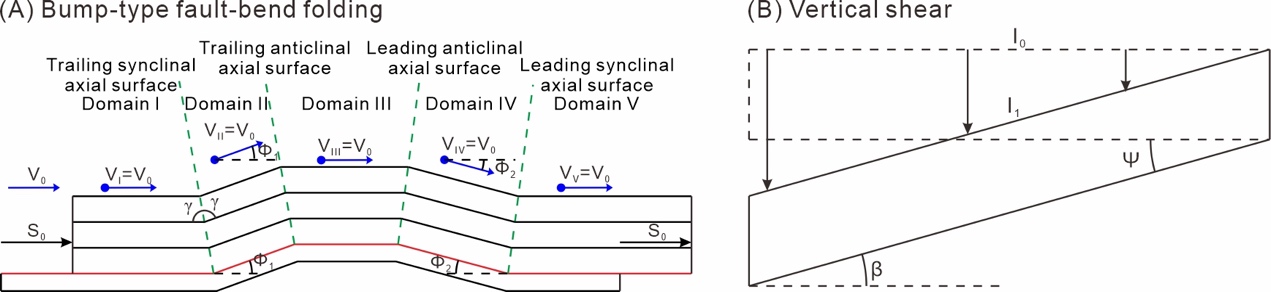
Structural trend analysis is vital for distinguishing along-strike variations and determining the transport orientation of growth strata. Axial surface mapping, which was introduced by Shaw et al. (1994), is one of the most effective methods for structural trend analysis. This method (1) defines fold trends, lateral terminations, and closure in structures; (2) constrains underlying fault geometry and slip; and (3) highlights and connects regions that can be interpreted by a series of balanced cross-sections. In this paper, the vertical projection of axial surfaces is utilized to show the horizontal displacement of the detachment layer. We vertically project the hinge lines (both the anticline and syncline of the growth strata) to estimate both the amount and direction of slip.
3.3. Velocity description for forward kinematic simulation
A velocity model describes the velocity vectors (including the values and direction) of all the material nodes in a kinematic model. Therefore, a velocity description is essential for developing a kinematic algorithm for forward simulation of the established model, such as fault-bend folding (Connors et al., 2021; Hardy & Poblet, 1995; Johnson & Berger, 1989), fault propagation folding (Hardy & Poblet, 1995; Suppe & Medwedeff, 1990), and trishear (Allmendinger, 1998; Erslev, 1991; Hardy & Allmendinger, 2011; Zehnder & Allmendinger, 2000). In bump-type fault-bend folding, the folded, migrating pregrowth strata preserve their layer thickness; thus, they are a type of parallel fold, and the folding mechanism is flexural slip (Shaw et al., 2005). The material nodes are transported parallel to the fault surface, reflecting a typical feature of fault-bend folding (fig. 4A). Specifically, the detachment layer did not cut off the overlying layers but experienced antiformal folding. Thus, all the hanging wall cutoff angles before the fault bends are zero, which means that the slip value after a fault bend is equal to that before the fault bends. In this situation, detachment fault movement has a constant slip value in all dip domains (Connors et al., 2021; Suppe, 1983).
Within the West Kunlun Cenozoic foreland basin system, the growth strata between the Hotan thrust nappe and Mazar Tagh thrust sheet show wedge-shaped sequences, reflecting foreland flexure subsidence (fig. 2C). According to the effects of a moving load system on the deflection of an elastic foreland plate (Jordan, 1981; Schedl & Wiltschko, 1984), the plate subsidence evolution is characterized by the vertical descent of the basement. Similarly, inclined shear is a suitable algorithm that describes the material nodes experiencing a unified direction of simple shear (fig. 4B). Given a 90° shear angle (vertical shear), we can both forward and backward simulate the foreland subsidence process.
_velocity_model_for_bump-type_fault-bend_folds_(modified_after__b_422969_)._the_general.jpeg)
4. Identification and characterization of bump-type fault-bend folding
4.1. Structural framework: the Shenghe 2 structural belt
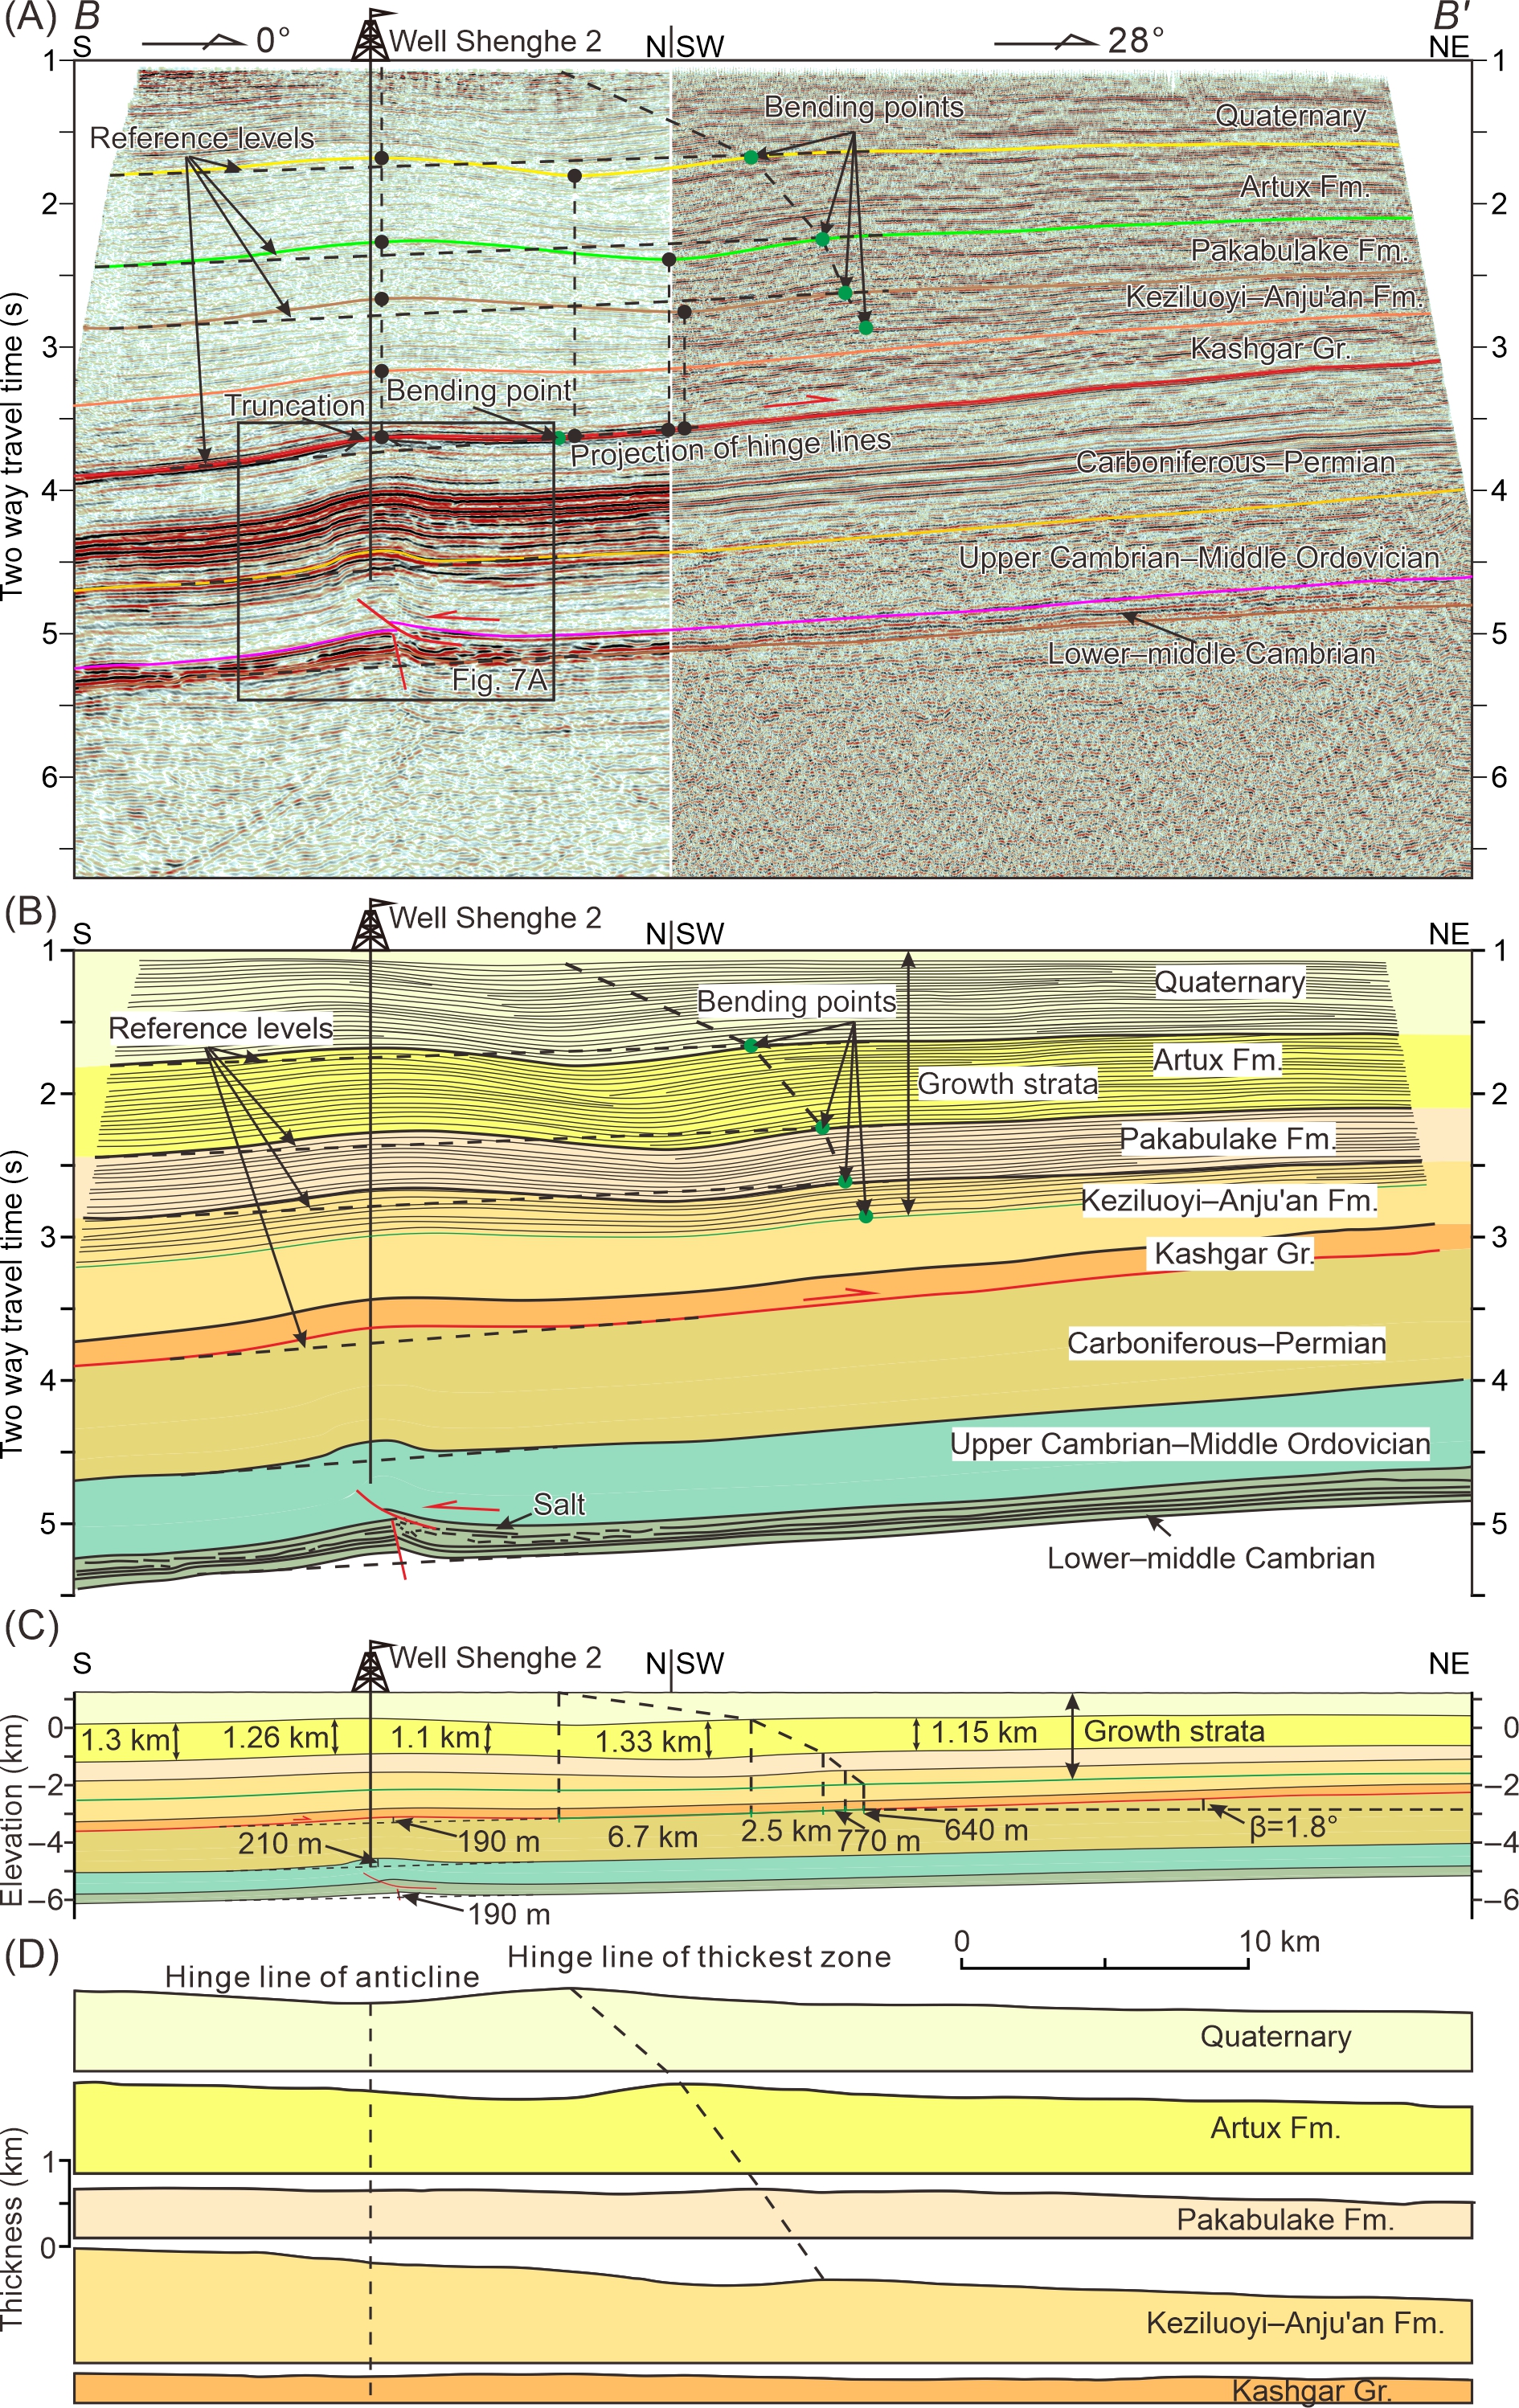
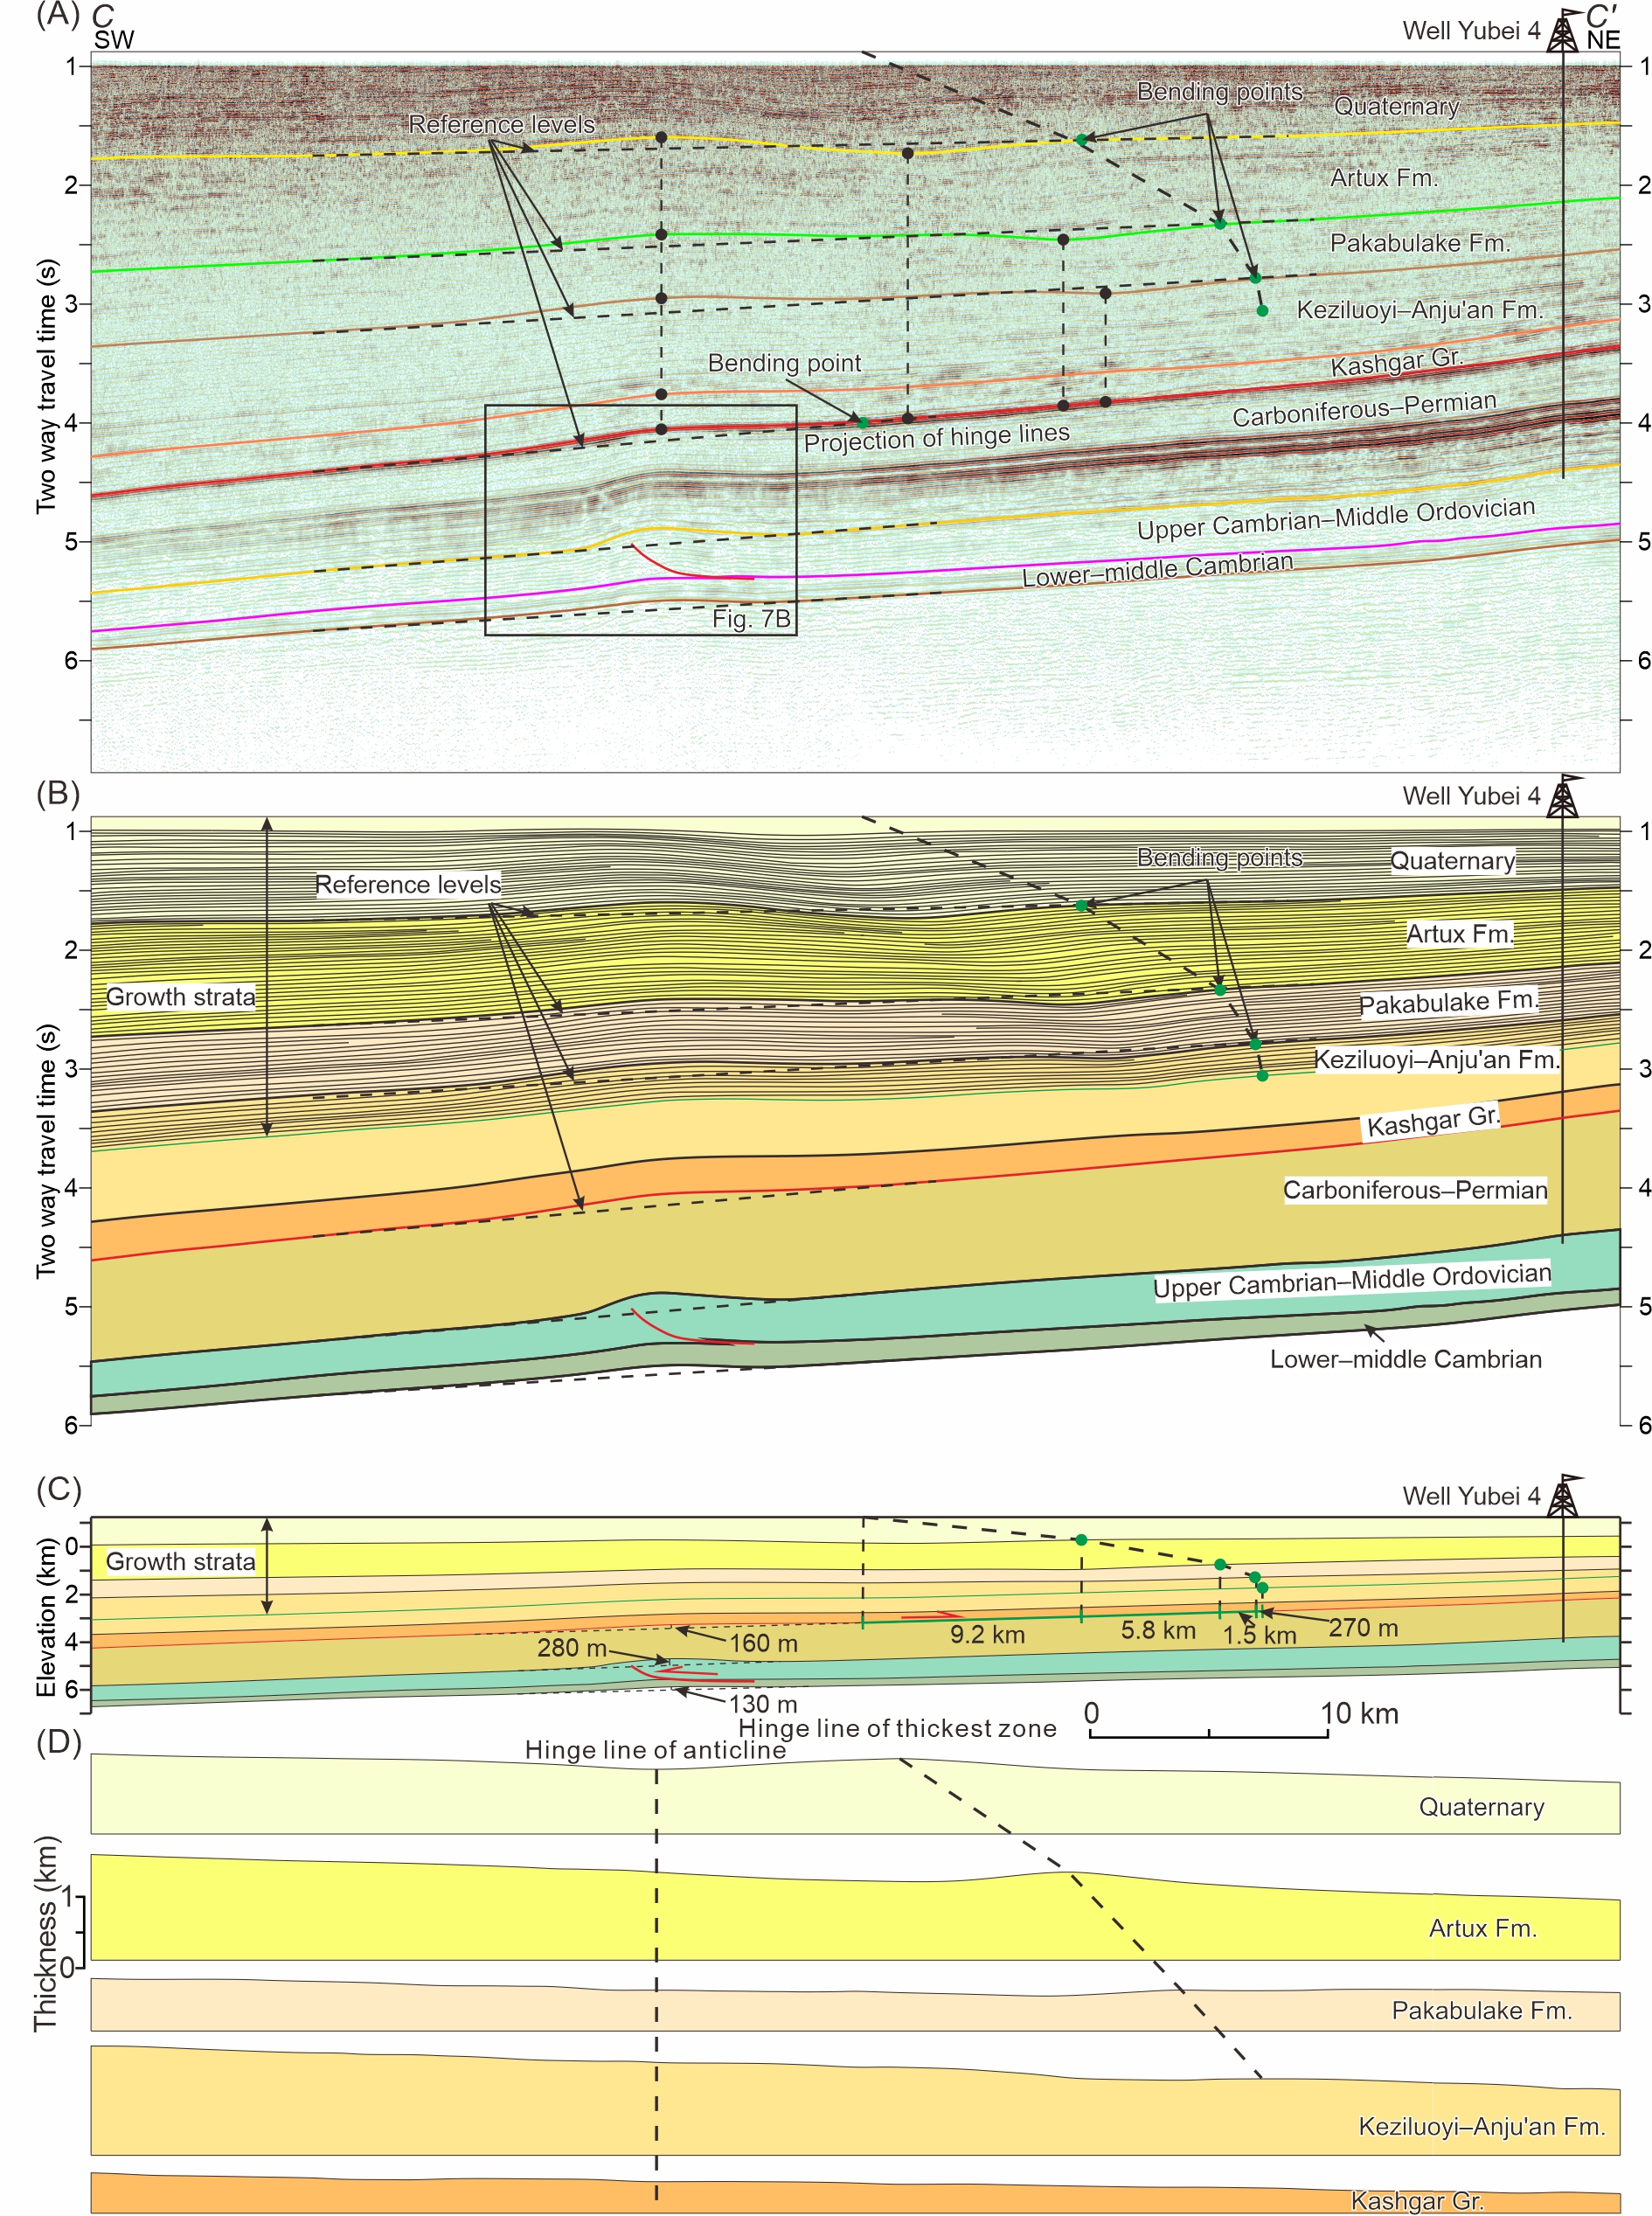
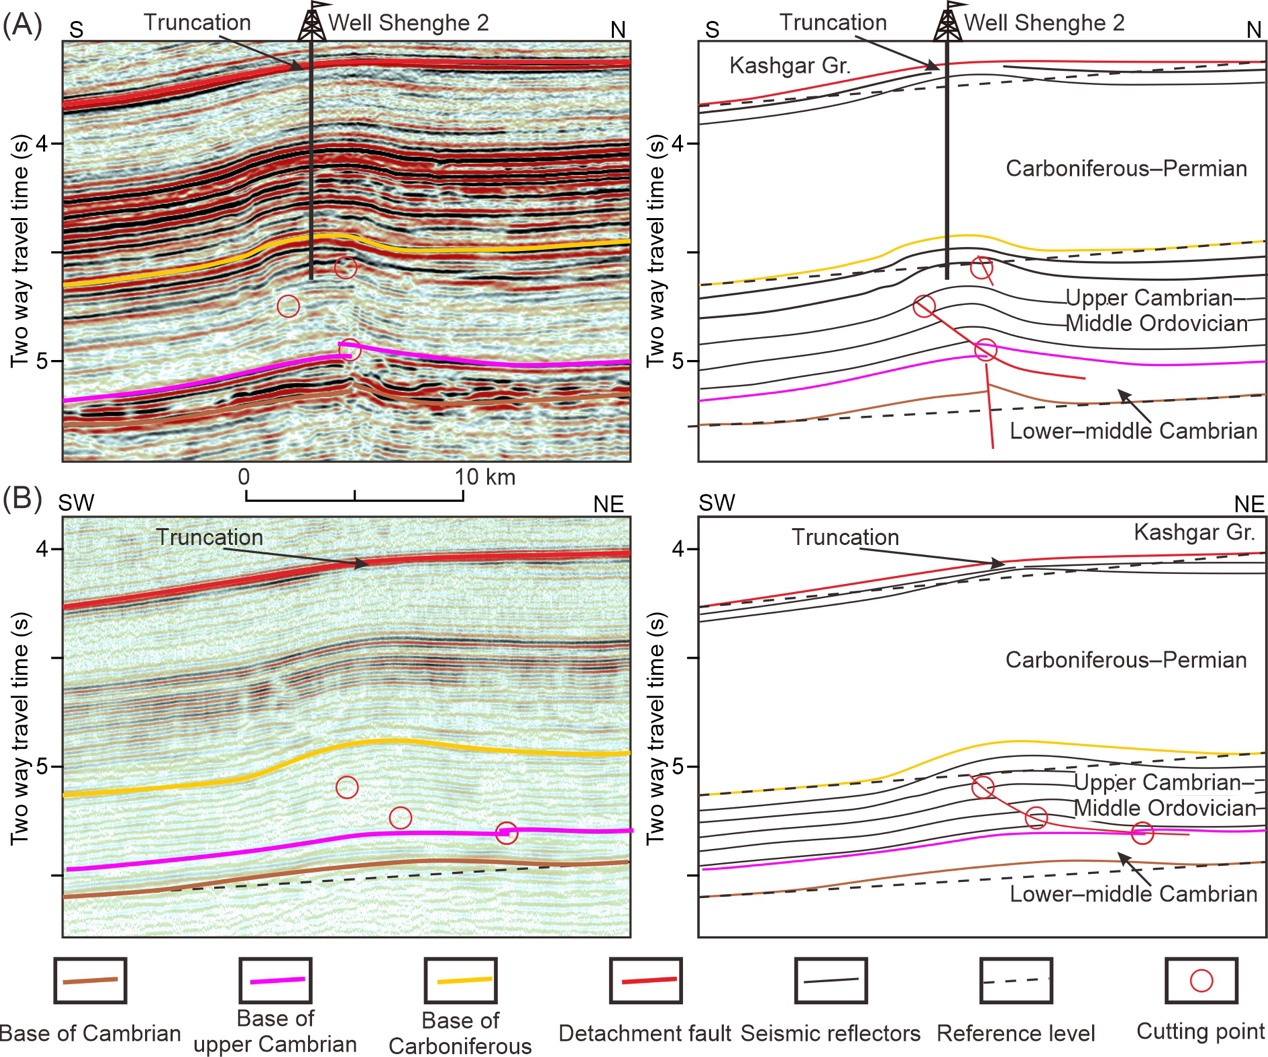
The interpretation of two seismic reflection profiles shows that both the basement and sedimentary cover in the Shenghe 2 structural belt were deformed (figs. 5 and 6). The basement exhibits a low-amplitude anticline with a range of 100–200 m (error range of 0–53 m; see Appendix C for measurement uncertainty, Supplementary Material) and is partly faulted at the fold core (fig. 5). The lateral thickness change in the middle Cambrian (salt) strata is identified at the core of the anticline, showing chaotic seismic reflections. In the upper Cambrian–Middle Ordovician sequence, a series of offsets in seismic reflectors indicate a northeast-dipping fault surface (figs. 5A, 6A, and 7). This fault, with a total slip of ~1.4 km, ramps up from the middle Cambrian salt layer and ends in the Middle Ordovician strata. Furthermore, the fold geometry has a relatively steeper southwest limb, reflecting slight asymmetry. There are two interpretation models to explain this deformation, i.e., fault-bend folding and fault-propagation folding. The fault-bend folding model requires another detachment layer in the Middle Ordovician layer to accommodate displacement from the fault ramp. However, the Middle Ordovician layer consists of hundreds of meters of limestone (Yingshan Formation in fig. 3; relatively competent layer). There is no reliable evidence that this thick carbonate sequence could have experienced such bed-parallel slip (~1.4 km). Therefore, we interpreted it as a fault-propagation fold, which is similar to previous studies (H. Chen et al., 2022; J. He et al., 2016; Y. Zhang et al., 2023). In the Carboniferous–Permian sequence (figs. 5A, 6A, and 7), the truncation of seismic reflectors and thickness thinning at the core of the Shenghe 2 anticline are identified, indicating pre-Cenozoic deformation (fig. 6). Overall, the structural reliefs of the base of the lower Cambrian, base of the Carboniferous, and base of the Cenozoic in cross-section BB′ are ~190 m, ~210 m, and ~190 m, respectively. While in cross-section CC′, the structural reliefs of three key horizons are ~130 m, ~280 m, and ~160 m (their differences are greater than the error range [0~53 m]), varying considerably. This feature indicates a stratigraphically decoupled deformation due to the presence of a middle Cambrian salt layer and two stage folding of the Shenghe 2 anticline. Within the Cenozoic sequence, the growth strata are folded and exhibit lateral thickness fluctuations (figs. 5D and 6D). The geometry of the growth strata above the Shenghe 2 anticline is parallel to the bumped basal Cenozoic detachment, while on the northeastern side of the anticline, a rootless syncline is identified (figs. 5 and 6).
_interpreted_seismic_reflection_profile_in_the_time_domain_(bb)__geological_cross-sect.jpg)
_interpreted_seismic_reflection_profiles_in_the_time_domain_(cc)__geological_cross-sec.jpg)
_and_interpretation_results_(right_column)_sho.jpeg)
In summary, the Shenghe 2 structural belt features three layers of contractional deformation separated by middle Cambrian and basal Cenozoic detachments. The Shenghe 2 anticline (fault-propagation fold) in the Paleozoic tectonostratigraphic unit experienced pre-Cenozoic deformation and reactivation during the Cenozoic.
4.2. Geometry of the upper Cenozoic growth strata
The Cenozoic strata are characterized by a series of seismic reflectors with good continuity (figs. 5A and 6A). From a regional view, this package of strata has tilted southwestward (basal slope angle β=1.8°), and the dip angles of the upper Cenozoic sequences increase with stratigraphic age. Taking cross-section BB′ as an example, the slope angles (β) of the Keziluoyi Formation base (T6), Pakabulake Formation base (T5), Artux Formation base (T3), and Quaternary base (T2) are 1.6°, 0.9°, 0.7°, and 0.4°, respectively. This series of sequences recorded postdepositional deformation; thus, the progressive dip angles reflect progressive foreland subsidence. Specifically, the geometries of the Kashgar Group and Keziluoyi Formation (figs. 5B and 6B; we treat the top of the pregrowth strata as the boundary between the Keziluoyi and Anju’an Formations) exhibit no thickness fluctuations (figs. 5D and 6D), corresponding to the pregrowth strata for bump-type fault-bend folding. Unlike the autochthonous growth strata (fig. 1A), the growth sequences (Anju’an Formation to Quaternary strata) are characterized by an anticline and a syncline with fluctuations in lateral thickness. For instance, the Artux Formation in cross-section BB′ is ~1.30 km thick on the southwestern side of the anticline, ~1.26 km thick at the core of the anticline, ~1.10 km thick on the northeastern limb of the anticline, ~1.33 km thick in the syncline, and ~1.15 km thick on the northeastern side of the syncline (fig. 5C). The bending points at four key horizons are generally the frontal boundaries of the thickness fluctuation zone (figs. 5A and 6A). As shown in the thickness–distance plots, the thickness of the growth strata regionally thins northeastward. Locally, the growth strata first thin on the northeastern limb of the anticline, then thicken in the syncline, and finally thin to a normal thickness (figs. 5D and 6D). Furthermore, both the thinning and thickening zones along the SW‒NE cross-sections gradually migrate southwestward from bottom to top.
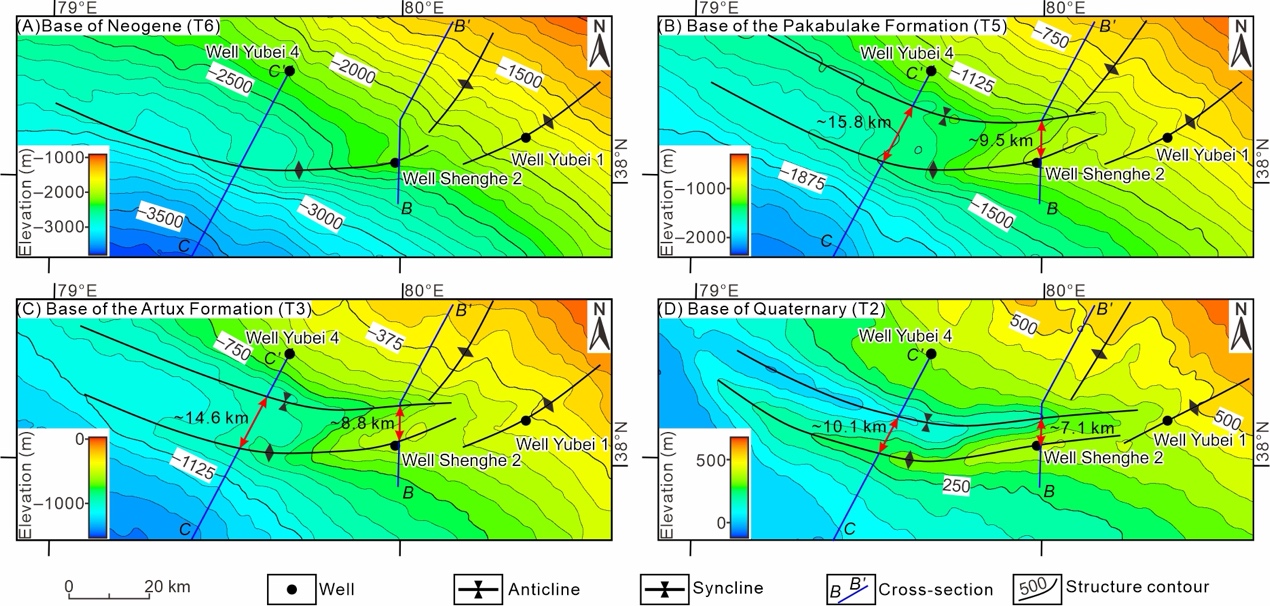
The abovementioned rootless syncline is not only well imaged in the cross-section but is also present on the structural map of the growth sequences (fig. 8). The depth map of the base of the Neogene strata (T6; pregrowth strata) exhibits only three anticlines within a southwest-dipping slope (fig. 8A). On the depth structure-contour maps of the three growth sequences, a nearly west–east-striking syncline is identified, corresponding to the rootless syncline in cross-sections (fig. 8B‒D). Notably, the distance between the hinges of the anticline and syncline decreases not only eastward at the same depth map but also from bottom to top (from the base of the Pakabulake Formation to the base of the Quaternary strata). The distances between the hinges of the anticline and syncline measured in cross-sections BB′ and CC′ are ~10 km and ~15.8 km, respectively, at the base of the Pakabulake Formation; ~8.8 km and ~14.6 km, respectively, at the base of the Artux Formation; and ~7.1 km and ~10.1 km, respectively, at the base of the Quaternary.
__the_pakabulake_.jpeg)
5. Kinematic model of bump-type fault-bend folding
H. Chen et al. (2022) provided a reasonable hypothesis to explain the occurrence of a syncline in front of the anticline and the lateral thickness change. For basic (simplest) types of contractional folding, the syntectonic sediment is thinned at the core of the anticline. When the original thinned syntectonic sediment moves forward onto the planar fault surface, it forms a concave-up geometry at the top of this growth sequence (syncline). Subsequently, a relatively thicker growth sequence compensates above the concave-up geometry. This hypothesis is also consistent with its regional Cenozoic thin-skinned thrust model, which transmits displacement from the Hotan thrust nappe to the Mazar Tagh (fig. 2C; H. Chen et al., 2022; Guilbaud et al., 2017; Laborde et al., 2019; Liang et al., 2012; Suppe et al., 2015; X. Wang et al., 2014).
Since the formation mechanism of migrating growth strata was shown to be a product of mass transport along a bumped detachment layer, future work should consider the possible quantitative kinematics of this type of folding. Forward kinematic simulation of bump-type fault-bend folding provides comprehensive insight into the quantitative relationship between the growth strata geometry and fault movement. Due to the low amplitude of bumped detachment and the special pattern of growth strata, the accurate slip increment of each time interval can hardly be determined. Thus, we first simulated several basic types of bumped detachments with relatively high amplitudes and several given slip amounts, which is also helpful for establishing some general principles that could be applied in other similar situations. After establishing the quantitative relationship based on these schematic models, we determined each slip increment through the measurement of a typical cross-section (BB′), and verified our conclusions on late Cenozoic evolution of the Shenghe 2 structural belt by combining forward and backward kinematic simulations (Section 6.2).
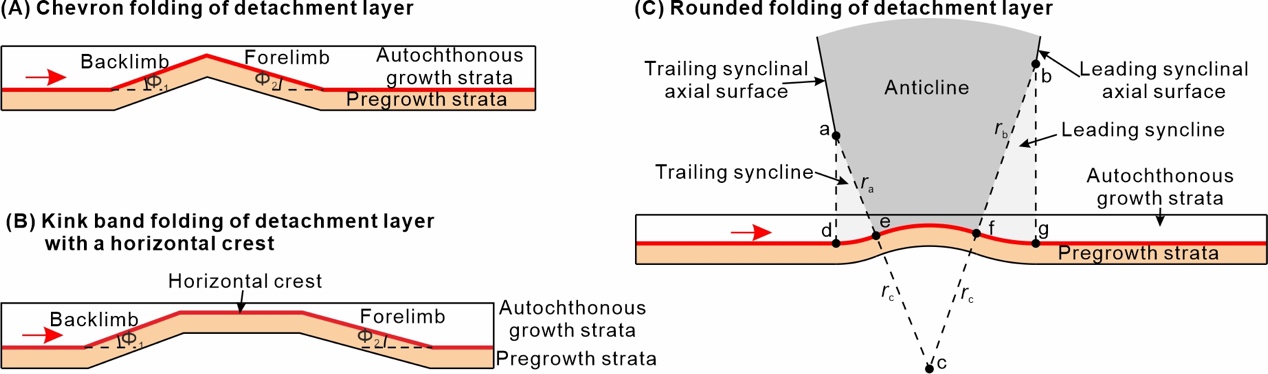
In cross-sectional view, folds may be characterized by domains of uniform dip, by a uniform variation in the dip around a single center of curvature, or by a combination of regions of both styles (Groshong, 2006). Therefore, kink band folds and rounded folds are two basic geometric types of bumped detachment. For kink band folds, the simplest geometry consists of a forelimb and a backlimb (i.e., chevron fold; fig. 9A). In general, a kink band fold with a forelimb, a backlimb, and a horizontal or quasi-horizontal crest is a more common type of geometry used to reflect natural cases (fig. 9B). For rounded folds, the simplest bumped detachment consists of a trailing syncline, central anticline and leading syncline in sequence along the mass transport direction (fig. 9C; Supplementary Material, Appendix D). A rounded-hinge kinematic formulation without changes in layer thickness or line length, but with a leading-edge loose-line, was likewise developed by Tavani et al. (2005). However, for a unified framework of a general fault-bend folding solution, we modeled the rounded fold geometry as multi-bend kink band fold. Because the abovementioned three types of fold geometries are widespread in the natural world, bump-type fault-bend folding with these fold geometries of detachment is theoretically possible. Therefore, we modeled these types of folded detachments to not only compare what they have in common but to also provide more possible patterns of growth strata for better identification and application of bump-type fault-bend folds in other similar cases. In three groups of kinematic simulations, the relative sedimentation rate and uplift rates were considered, but erosion was not considered.
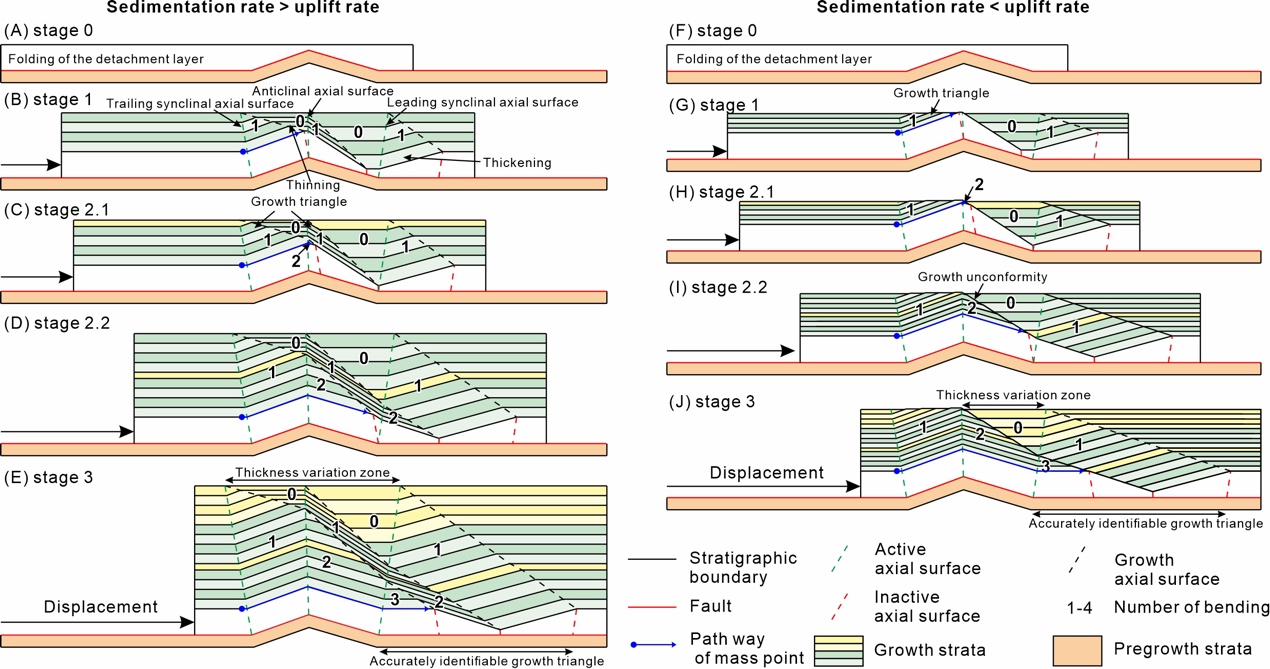
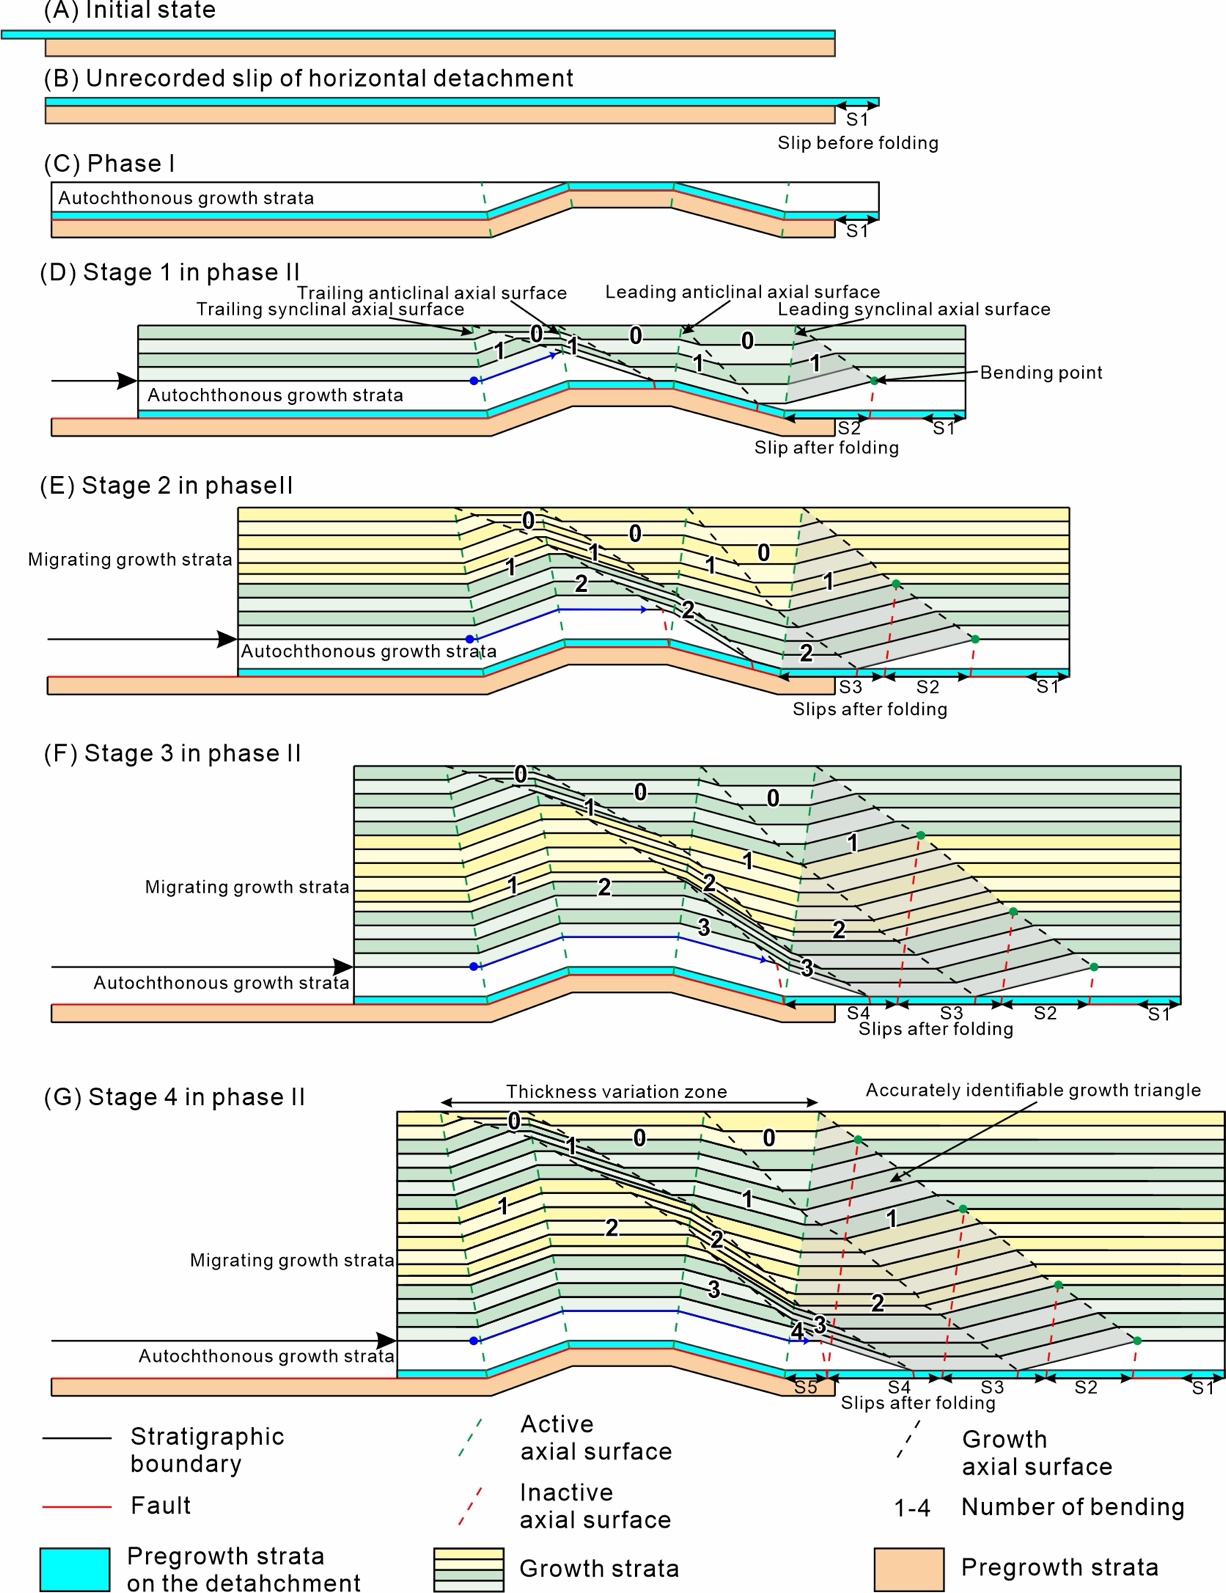
5.1. Chevron folding of detachment
Chevron folding may be symmetric (Φ1=Φ2) or asymmetric (Φ1≠Φ2) (fig. 10A). Here, we provide an asymmetric fold geometry (Φ1>Φ2; length of backlimb < forelimb) to illustrate the complete kinematic evolution of bump-type fault-bend folding. According to the bend number of the transport direction, we subdivide the bump-type fault-bend folding of this detachment geometry into three main stages (fig. 10). During Stage 1, the mass points of the left side, backlimb, and forelimb of the bumped detachment move across the trailing synclinal, anticlinal, and leading synclinal axial surfaces, respectively. The mass points within the growth triangles indicate changes in the transport direction one time (parallel to the fault bend). There are three growth triangles under the situation in which the sedimentation rate > uplift rate but two growth triangles under the situation in which the sedimentation rate < uplift rate (absence of the one derived by the anticlinal axial surface) (fig. 10B and G). In particular, the thickness between the growth axial surface derived from the trailing synclinal axial surface and the growth axial surface derived from the anticlinal axial surface is relatively smaller (fig. 10B). The thickness between the growth axial surface derived from anticlinal axial surface and growth axial surface derived from leading synclinal axial surface is relatively greater, forming a syncline in front of the anticline (fig. 10B).
When mass points change the transport direction a second time, it indicates a transformation into Stage 2 (fig. 10C and H). When the limb length of the forelimb > that of the backlimb (Φ1>Φ2), the mass points from the left side of the bumped detachment first experience a second change in the transport direction, defined as ‘Stage 2.1’. Once the mass points from the backlimb of the bumped detachment move across the leading synclinal axial surface, experiencing the second bend in the transport direction, they transform into ‘Stage 2.2’ (fig. 10D and I). When the sedimentation rate < the uplift rate, the growth triangle derived by the trailing synclinal axial surface is covered by onlapping growth strata, forming a time-transgressive unconformity (growth unconformity) (fig. 10I). During Stage 3, the mass points from the left side of the bumped detachment experience the third bend in the transport direction, after which the geometry of the bump-type fault-bend fold no longer changes (fig. 10E).
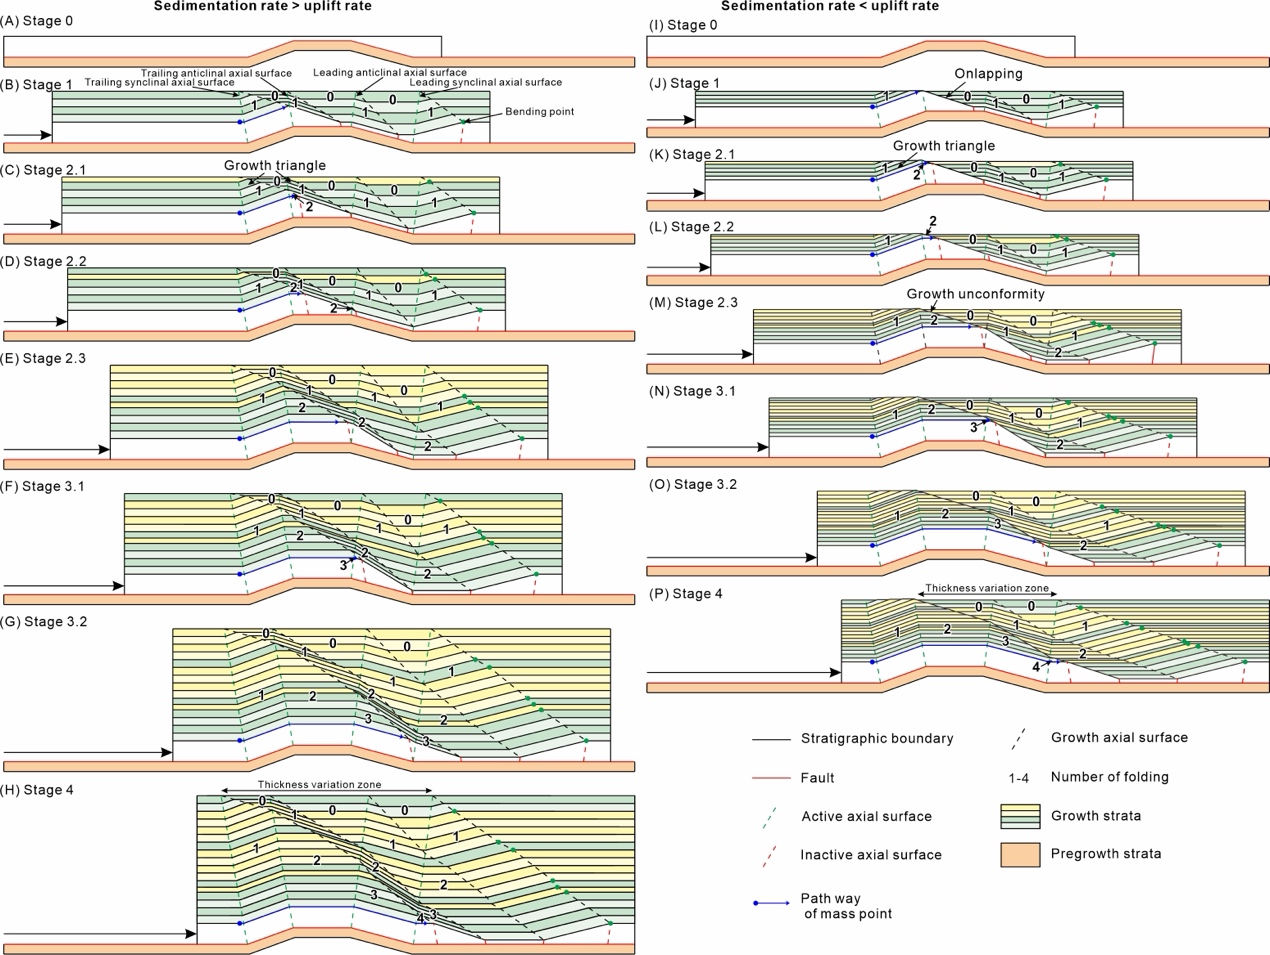
5.2. General kink band folding of detachment with a horizontal crest
In comparison with chevron folding, this type of fold geometry adds a horizontal crest between the trailing and leading limbs (fig. 11A and I). Here, we provide an asymmetric fold geometry (length of the backlimb < crest < forelimb) to illustrate the four main stages of kinematic evolution. When the mass points move along the bumped detachment zone, there are four active axial surfaces, forming four growth triangles under the situation in which the sedimentation rate > the uplift rate (Stage 1 in fig. 11B). Similarly, the growth triangle derived from the trailing anticlinal surface is absent under the situation in which the sedimentation rate < the uplift rate (replaced by onlapping growth strata) (fig. 11J). For the lateral thickness change, the growth strata between the growth axial surfaces derived from the trailing synclinal surface and trailing anticlinal surface are relatively thinned, while the thickness between the leading anticlinal axial surface and leading synclinal axial surface is relatively thickened. Therefore, the thickness–distance pattern first thins, then changes back to normal, then thickens, and finally changes back to normal, exhibiting a lateral fluctuation in thickness.

Due to the various lengths of the two limbs and a horizontal crest, the mass points from these domains successively move across the second active axial surfaces (three times in total); thus, Stage 2 should be subdivided into three secondary stages (fig. 11C‒E and K‒M). In the present model, Stages 2.1, 2.2, and 2.3 indicate that the mass points from the left side, backlimb, and horizontal crest of the bumped detachment move across the trailing anticlinal, leading anticlinal, and leading synclinal axial surfaces, respectively. After Stage 2.2, the onlapping growth strata overlie the growth strata transported from the left side of the bumped detachment, forming a growth unconformity (fig. 11L)
Subsequently, in Stages 3.1 and 3.2, the mass points from the left side and the backlimb of the bumped detachment move across the leading anticlinal axial surface and leading synclinal axial surface, respectively (fig. 11F, G, N, and O). As the mass points from the left side move across the leading synclinal axial surface, the folding process enters Stage 4, and the geometry of the bump-type fault-bend fold no longer changes (fig. 11H and P).
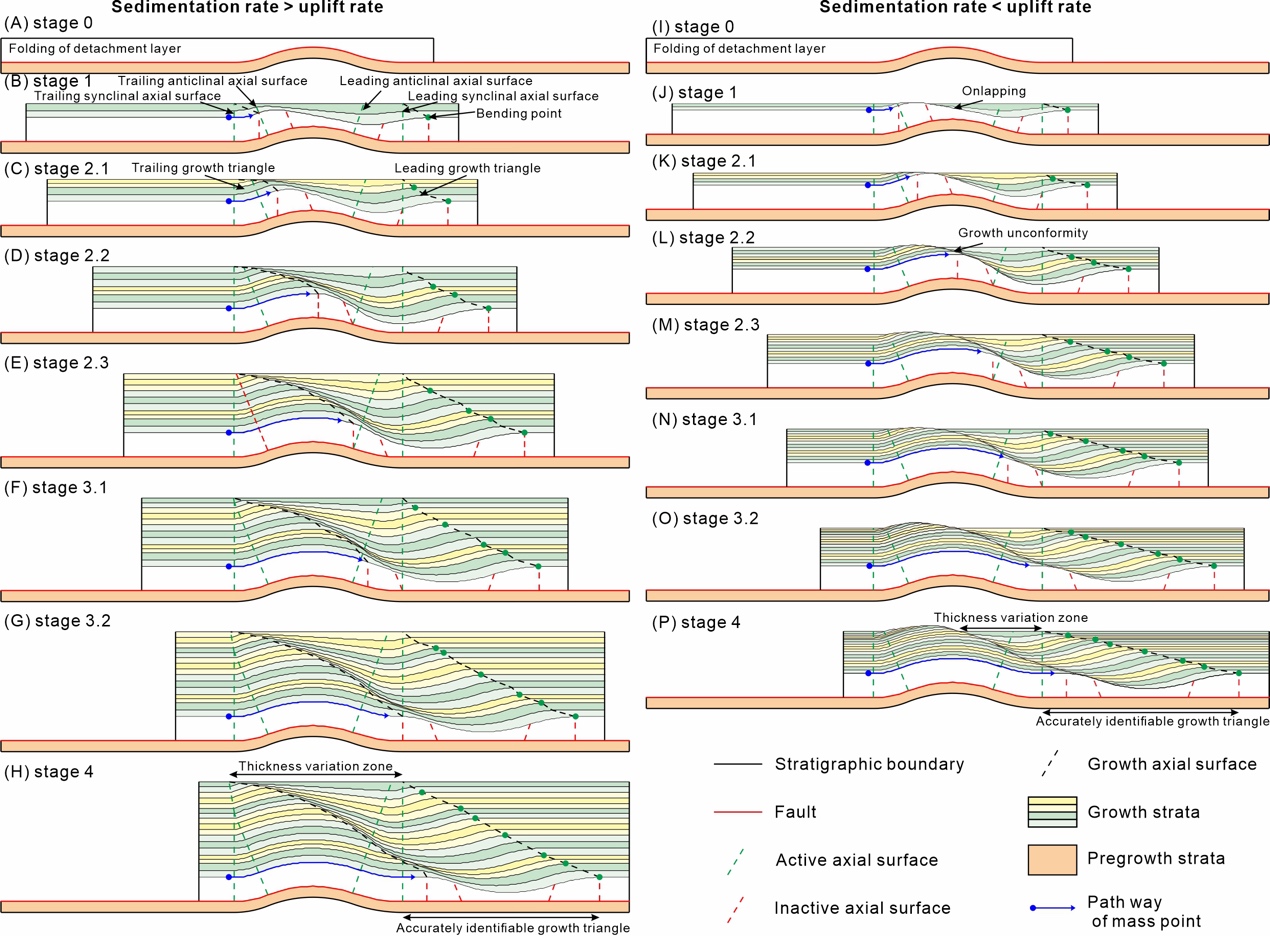
5.3. Rounded folding of detachment
In contrast to kink band folding, the rounded fold geometry consists of multiple synclinal and anticlinal hinge zones without distinguishing axial surfaces. Here, we provide a general asymmetric fold geometry (Arc de<ef<fg) to illustrate the four main stages of kinematic evolution (figs. 9C and 12A). In Stage 1, the mass points from the left side of the bumped detachment move into the synclinal hinge zone (fig. 12B and J). Similarly, bounded by the growth axial surfaces, the lateral thickness gradually and continuously thins, thickens, and changes back to the normal thickness in sequence (along the transport direction). When the sedimentation rate is less than the uplift rate, onlapping growth strata develop in the anticlinal hinge zone (fig. 12L).

In Stage 2.1, the mass points from the left side of the bumped detachment move into the anticlinal hinge zones (fig. 12C and K); in Stage 2.2, the mass points from the trailing synclinal hinge zone move into the leading synclinal hinge zone (fig. 12D and L); and in Stage 2.3, the mass points from the anticlinal hinge zone move into the right side of the bumped detachment (fig. 12E and M). When the onlapping growth strata overlie the growth strata transported from the backlimb of the bumped detachment, a growth unconformity forms. Subsequently, in Stage 3.1, the mass points from the left side of the bumped detachment move into the leading synclinal hinge zone (fig. 12F and N); in Stage 3.2, the mass points from the trailing synclinal hinge zone move into the right side of the bumped detachment (fig. 12G and O). Finally, the geometry of the growth strata no longer changes since the mass points from the left side move to the right side of the bumped detachment (fig. 12H and P).
6. Discussion
Based on the kinematic forward simulation of three models, we reproduce the deformation process of bump-type fault-bend folding, providing a genetic explanation of the special geometry of the growth strata. A general bumped detachment layer can be subdivided into three dip domains, namely, the backlimb, crest, and forelimb geometries (e.g., figs. 9B and 11). With the mass moving forward, the growth strata deposited in the domain of the backlimb geometry are thinner, the growth strata deposited in the domain of the crest geometry are normally thick, and growth strata deposited in the forelimb geometry are thicker. Therefore, each growth sequence shows lateral thickness fluctuations, i.e., thinning, maintaining normal thickness, and thickening from the trialing backlimb to the leading forelimb geometry in sequence. Because the displacement of the detachment is greater in the older growth sequence than in the younger one, the thickness fluctuation zone in the older growth sequence slips to a greater extent, explaining why the lateral thickness fluctuation zone is not autochthonous with time. Moreover, we still need to simulate the late Cenozoic evolution of the Shenghe 2 structural belt backward to verify our interpretation. In this section, we backward simulate the late Cenozoic evolution (structural restoration to the state before bump-type fault-bend folding) to obtain a geologically reasonable model for subsequent forward simulation. Then, we forward simulate bump-type fault-bend folding with the obtained modeling parameters, including foreland subsidence and detachment slipping. Furthermore, we examine a more widely used method for quantitatively describing faulting and folding via the characteristics of migrating growth strata, including the complete displacement history in sectional view and the slip field in map view.
6.1. Quantitative relationships in bump-type fault-bend folding
For the folding mechanism of kink band migration, the kink band has a constant width within the pregrowth strata, narrows upward through the growth strata, and finally has a zero width at the top of the growth strata (Suppe et al., 1992). The width of the kink band measured in each growth sequence records the magnitude of fault slip, which is also applicable to bump-type fault-bend folding (figs. 10–12). In a previous study, the fault displacement was determined by measuring the projected distance of the hinge of the syncline on the fault surface (figs. 5 and 6), which is also a feasible method indicated by our kinematic model (H. Chen et al., 2022). The displacement can be estimated by measuring any one of the derived growth triangles, such as the growth triangle derived by the trailing (or leading) synclinal axial surface in both the chevron folding and general kink band folding of the detachment (figs. 10 and 11), the central anticlinal axial surface in the chevron folding of the detachment, and the trailing (or leading) anticlinal axial surface in the general kink band folding of the detachment (fig. 11). Although there is no distinguishing kink band for the rounded folding of the detachment, we can still subdivide the fold geometry into several hinge zones that are separated by inflection points with zero curvatures (figs. 9 and 12). The boundaries between neighboring hinge zones are a series of special active axial surfaces; thus, we can recognize the corresponding growth triangles. Similar to the simplest fold with a constant dip of the kink band, the line length of the wave-shaped growth triangle also reflects the experienced fault displacement.
Theoretically, the detailed fault slip history can be estimated by measuring the width of each growth triangle. However, most parts of the thickness fluctuation zone have folded more than one time, making the growth axial surfaces difficult to identify (figs. 10‒12). In this situation, we can still easily recognize the growth triangle derived from the leading synclinal axial surface (e.g., figs. 10E, 11H, 12H). The growth axial surface is the leading boundary of the thickness fluctuation zone, which is also the connecting line of all bend points. For simplicity and effectiveness, measuring the width between the leading synclinal and related growth axial surfaces is a useful way to determine the fault displacement.
In addition, the abovementioned kinematic simulations consider only the fault movement after the detachment has folded. When designing a fault displacement prior to the folding of the detachment, the overlying migrating growth strata are not folded (fig. 13A and B). Therefore, the bump-type fault-bend folding-related growth strata record only the fault displacement after the detachment is folded. In summary, the formation of this type of folding consists of two phases: 1) a detachment folding phase with autochthonous growth strata (fig. 13C) and 2) a bump-type fault-bend folding phase with migrating growth strata (fig. 13D‒G). The evolution of bump-type fault-bend folding can be subdivided into several (equal to the number of kink bands) main stages, which are marked as the number of folds of mass points from the left side of the bumped detachment. An effective way to determine the displacement (after the detachment is folded) is measuring the growth triangle derived from the leading synclinal hinge.

6.2. Verification of the interpretation of Shenghe 2 bump-type fault-bend folding
Another interpretation model may also explain the present features of the Shenghe 2 structural belt: the Keziluoyi‒Anju’an Formation experienced pure shear deformation and the overlying growth strata experienced nonparallel fold (Shaw et al., 2005), causing the migration of the lateral thickness fluctuation zone. This interpretation is theoretically feasible, but requires a relatively thick, much weaker layer in the the Keziluoyi‒Anju’an Formation and multiple weaker layers in the overlying growth strata to provide such mechanical conditions. However, the Keziluoyi‒Anju’an Formation is composed of sandstones interbedded with mudstones (potentially weak layers; fig. 3). The mudstone layers are too thin to compensate for such pure shear deformation. Furthermore, the overlying growth strata are mainly composed of sandstones and conglomerates, and parallel folding is more likely to occur. Here, we combine forward and backward kinematic simulations based on an actual model of the Shenghe 2 structural belt to verify our interpretation (bump-type fault-bend fold).
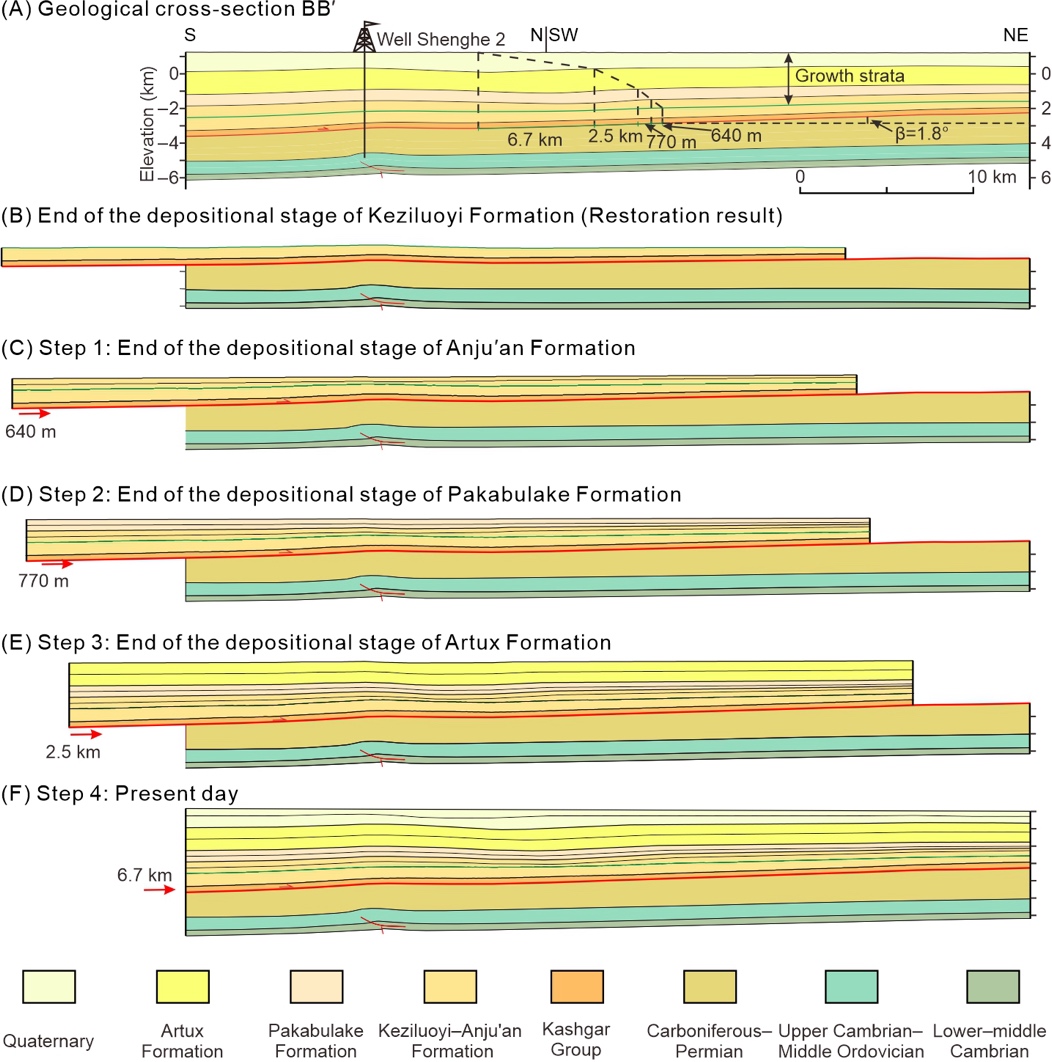
The measured widths of growth triangles in different sequences generally vary, indicating different slip increments during related time intervals (J. Chen & He, 2022; Suppe et al., 1992). In other words, given a constant sedimentation rate, the bend of the axial surface of the growth triangle reflects an inconstant slip rate. Therefore, we recognize that the late Cenozoic evolution of the Shenghe 2 structural belt was similar to the kinematic modeling results in terms of the sedimentation rate> the uplift rate (fig. 12A) and consisted of two phases that developed on a pre-Cenozoic structure. Phase I: the pre-Cenozoic structure was reactivated at the end of the depositional stage of the Keziluoyi Formation, and Phase II: four detachment slip increments occurred during the depositional stages of the Anju’an Formation, Pakabulake Formation, Artux Formation, and Quaternary. By measuring the widths of the growth triangles of different growth sequences (figs. 5 and 6), we determine that the detachment fault slips were 640 m (Anju’an Formation), 770 m (Pakabulake Formation), 2.5 km (Artux Formation), and 6.7 km (Quaternary) in the Section BB’ (10.61 km in total).
To verify our interpretation, we simulate the bump-type fault-bend folding process based on the actual model from the Shenghe 2 structural belt. First, we restore (backward simulation) the present sectional structure to the state before bump-type fault-bend folding (slope angle of 1.4° caused by foreland subsidence and detachment slip of 10.61 km; fig. 14A). The rootless syncline in front of the anticline disappears, indicating that our restoration is geologically reasonable (fig. 14B). With this initial model, we forward simulate the four stages of bump-type fault-bend folding with three types of modeling parameters (section BB′ as an example), including foreland subsidence, detachment fault slip (mentioned before) and syntectonic sedimentary thickness. The slope angle increments due to foreland subsidence are 0.5° (Anju’an Formation), 0.2° (Pakabulake Formation), 0.3° (Artux Formation), and 0.4° (Quaternary), which are simulated by vertical shear. The syntectonic sedimentary thicknesses are 0.67 km (Anju’an Formation), 0.66 km (Pakabulake Formation), 1.33 km (Artux Formation), and 1.13 km (Quaternary) in the thickest area (southwestern margin of the section). Each stage of the simulation is subdivided into two increments to show the internal geometry of each growth sequence.
_typical_geological_cross-section_(bb)_of_the_shenghe_2_structural_belt_within_the_we.jpeg)
The modeling results show the predicted rootless syncline in front of the anticline (fig. 14C‒F). Lateral thickness fluctuation zones in growth sequences are also identifiable, and they exhibit progressive migration from bottom to top. In contrast to our previous modeling results of three geometrical types of bumped detachment, the thinned growth triangle derived by trailing anticlinal axial surfaces (figs. 10‒12) is not clear in the seismic interpretation. This inconsistency is mainly because the tightness of the folded detachment in the three models is much greater than that in the Shenghe 2 structural belt. In bump-type fault-bend folding, the greater the tightness of folded detachment is, the greater the amplitude of lateral thickness fluctuation. Therefore, the quantitative kinematic modeling result here reproduces almost all the key features of the Shenghe 2 structural belt, indicating that our interpretation is acceptable.
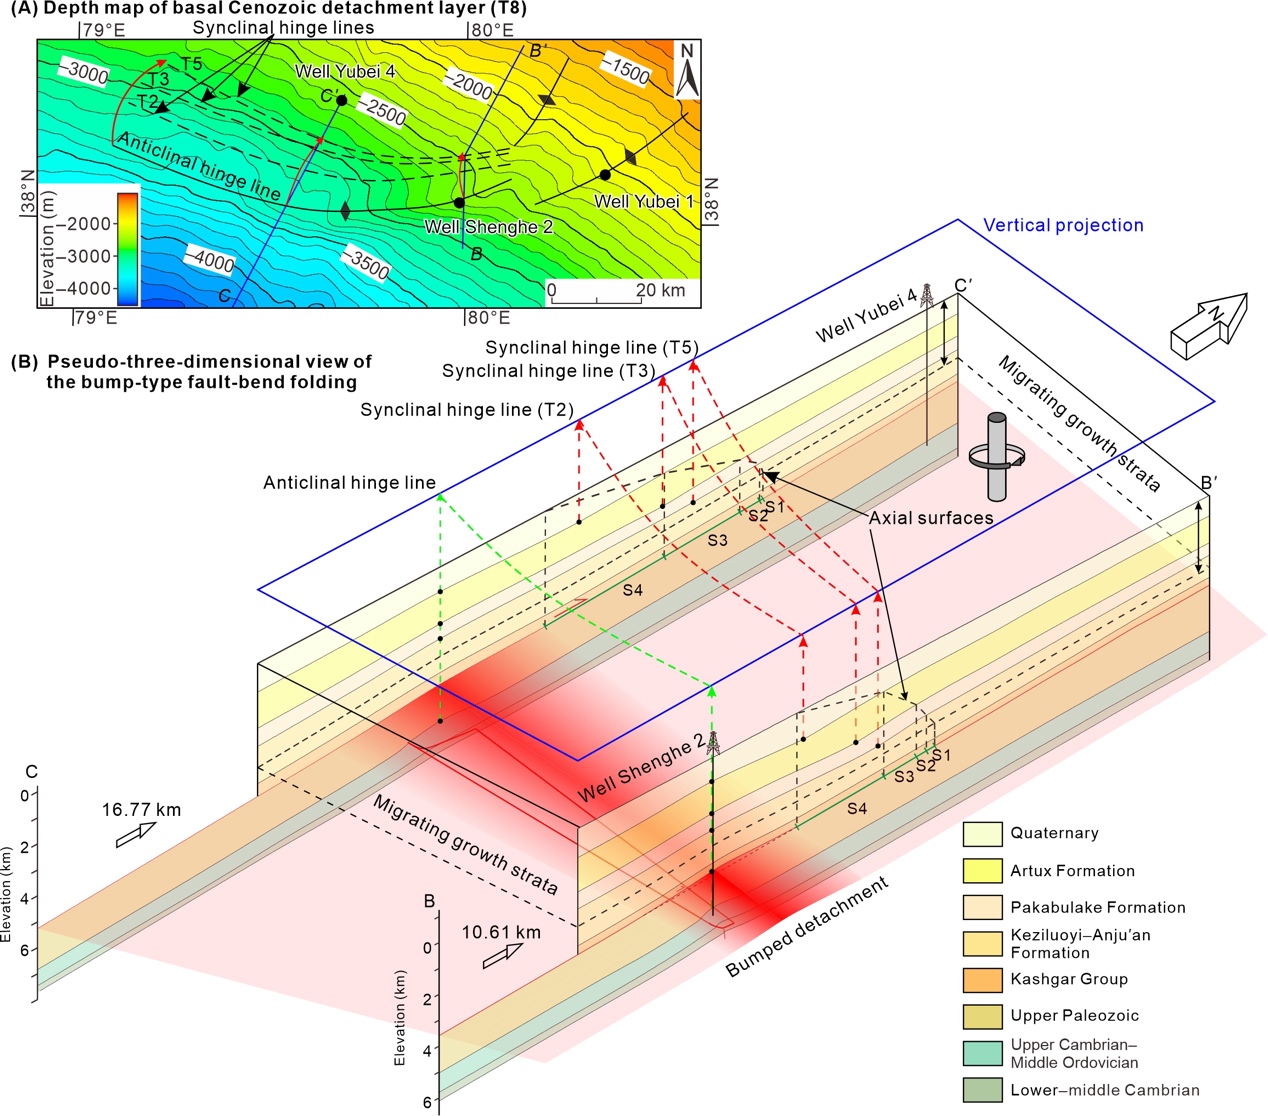
6.3. Clockwise rotation of the Cenozoic thrust sheet
On the western segment of the Shenghe 2 structural belt, seismic reflection profile CC′ shows that the fault slip increments are 270 m (Anju’an Formation), 1.5 km (Pakabulake Formation), 5.8 km (Artux Formation), and 9.2 km (Quaternary), respectively (16.77 km in total), showing along-strike variation in the fault displacement. In the structure-contour maps (fig. 8), the syncline hinge lines of various growth sequences migrate at different distances, which are similar to the widths of the growth triangle derived from the leading synclinal axial surface (indicating fault displacement).
From the map view of the migration path, we determine that the slip orientation is nearly northward on the eastern segment and northeastward on the western segment rather than the orientation shown in the 2D cross-sections (fig. 15). The slip values increase westward, which conforms to the basic features of clockwise rotation. Since the thin-skinned detachment model between the Hotan thrust nappe and Mazar Tagh thrust sheet is documented, the motion of the Cenozoic thrust system is independent of the underlying strata. Surface observations, rather than deep data, may provide an important constraint on the movement of Cenozoic thrust sheets. According to GPS observations, the Cenozoic sheet is experiencing clockwise rotation with an angular velocity of 0.5°/Myr (Abdrakhmatov et al., 1996; Bendick et al., 2000; Molnar & Ghose, 2000; J. Zhao et al., 2019), which is consistent with our deduction. Therefore, we believe that our structural trend analysis of bump-type fault-bend folding may provide key evidence for the clockwise rotation of the Cenozoic thrust sheet during the late Cenozoic.
_depth_structure-contour_map_of_the_base_of_the_cenozoic_(t8)__showing_the_shenghe_2_a.jpeg)
7. Conclusions
Bump-type fault-bend folding describes sedimentary layers that are folded due to material transporting along a bumped detachment layer. Combined with borehole and 2D seismic reflection data, the Shenghe 2 structural belt within the West Kunlun Cenozoic foreland thrust system is taken as an example to illustrate the features of this type of folding. In contrast to general folding, the growth strata formed on the bumped detachment are characterized by lateral thickness fluctuations and a rootless syncline in front of the anticline. The lateral thickness fluctuation zones of various growth sequences are not autochthonous but successively migrate toward the transport direction. The complete deformation process of bump-type fault-bend folding involves two phases of evolution, i.e., folding of the detachment layer (Phase I) and bump-type fault-bend folding (Phase II). The quantitative relationship between the geometry of the growth strata and fault movement is consistent with the previous theory reflected in the upward-narrowing growth triangle (classic fault-bend folding). For simplicity, measuring the change in the width of the growth triangle derived by the leading synclinal hinge can quickly estimate the fault slip history (after the detachment is folded). Furthermore, bump-type fault-bend folding is a sensitive indicator of the slip field of thrust sheets in map view, highlighting its regional tectonic significance. Application to the Shenghe 2 structural belt indicates that the basal Cenozoic detachment initiated in the Miocene, four distinct slip increments of the basal Cenozoic detachment occurred (during the depositional periods of the Anju’an, Pakabulake, Artux, and Quaternary), and clockwise rotation of the Cenozoic thrust sheet occurred.
Acknowledgments
We thank the China National Petroleum Corporation (CNPC) and China Petrochemical Corporation (Sinopec) for providing the seismic and borehole data. We sincerely appreciate the valuable comments and suggestions from our reviewers and associate editor, which have significantly improved the quality of this manuscript.
Author contributions
Jiajun Chen: Methodology, Software, Validation, Formal analysis, Writing-original draft, Writing-review & editing. Dengfa He: Conceptualization, Writing-review & editing, Supervision, Project administration. John Suppe: Conceptualization. Fanglei Tian: Formal analysis, Validation.
Funding Sources
This research was jointly funded by the National Natural Science Foundation (42330810 & U19B6003-01) and the CNPC Scientific Research and Technology Development Project (Grant Nos. 2021DJ1501 & 2024DQ03016).
Conflicts of Interest
The authors declare no conflicts of interest.
Data Availability Statement
All data generated or analyzed during this study are included in this published article (and its Supplementary Material).
Supplementary Information
https://doi.org/10.17605/OSF.IO/98U37.
Editor: Mark Brandon, Associate Editor: Darrel Cowan