
1. Introduction
The idea that landforms and landscapes evolve to facilitate sediment transport is a fundamental concept in geomorphology (e.g., Gilbert, 1877). This concept can be extended to predict that landforms and landscapes can reach stable morphologies—referred to as graded conditions, dynamic equilibria, or steady states—where material fluxes are balanced at specific time and space scales. In these states, average characteristics such as slope, relief, and elevation remain unchanged over time, provided that external forcing remains constant (e.g., Kooi & Beaumont, 1996; Willett, 1999). Dynamical systems analysis of long-term landscape evolution under some conditions demonstrates that the response to a step change in external forcing is an evolution toward a new equilibrium at a rate proportional to the integrated divergence of material fluxes across the system (Kooi & Beaumont, 1996). This means that the system changes rapidly following the change in external conditions and the rate of change slows as the new steady state is approached (e.g. Howard, 1982; Kooi & Beaumont, 1996). We bring these concepts to an observational study of the transition from a continental-scale glaciation to a fluvial landscape and evaluate (1) the extent to which drainage density appears to achieve a stable equilibrium value, (2) the rate of change of drainage density following deglaciation, and (3) the time-variability of this rate.
Drainage density, a measure of the fluvial dissection of a landscape, has been observed to increase through time. Glock (1931) presents a conceptual model for drainage network development in which early development rapidly increases drainage density, while later development reduces the network length slightly until a stable maximum value is reached. The drainage density of a watershed is a function of numerous parameters, including basin slope and relief (Horton, 1945; Schumm, 1956; Tucker et al., 2001), soil texture and infiltration rates (Horton, 1945; Tucker & Bras, 1998), climate (Tucker & Bras, 1998; Tucker & Slingerland, 1997), and lithology (Tucker et al., 2001; Tucker & Bras, 1998). If these factors remain constant through time, the channel network within a basin will develop to a quasi-steady state in which both an average maximum length of channels and an average minimum distance to ridgeline is achieved. If drainage density is measured within the sub-basins of a fully channelized basin, the values of drainage density across the larger basins should converge on a mean value that is a function of available water, local steepness, and local geology (Schumm, 1956; Schumm et al., 1987), while a basin in which the channel network is still expanding will have a wide statistical distribution of sub-basin drainage density values.
Although the dependence of drainage basin morphology on climatic and geologic parameters has been well-studied, study of the development of drainage networks over geologic time is much more limited. One consequence of the limited observational data is that much of our understanding of drainage development comes from numerical models (e.g., Cullen et al., 2022; Lai & Anders, 2018; Tucker & Bras, 1998) and physical experiments (e.g., Hasbargen & Paola, 2000; Schumm et al., 1987; Sockness & Gran, 2022). Field observations of drainage development have been made in un-vegetated and frequently steep landscapes, such as the badlands that developed in former clay mines near Perth Amboy, New Jersey (Schumm, 1956) and the post-eruption flanks of Mt. St. Helens (Major et al., 2019), and a lake floor in Montana uplifted by an earthquake (Morisawa, 1964). In these locations (and in physical experiments) drainage network expansion is initially rapid and slows over time. Morisawa (1964) observed extensive drainage networks one year after the earthquake and little change after an additional year. Schumm’s (1956) findings suggest that the channel networks of Perth Amboy were decreasing in expansion rate and perhaps approaching a steady state after only a few decades, and Major et al. (2019) observe continued adjustment of channel networks ~40 years after the channel-removing eruption. Perth Amboy and Mt. St. Helens are steep landscapes, and most observations of drainage network expansion are from small areas, with the largest consisting of a few thousand square kilometers (Tucker et al., 2001). The Perth Amboy study area was only ~4000 m2 in area (~1 acre), for example. The lack of observations, especially at large spatial scales, long timescales, and for low-relief landscapes is a clear knowledge gap.
We work to fill this gap by presenting observations of drainage density across ~2 million km2 of the Central Lowlands (CL) physiographic province of the United States (Fenneman & Johnson, 1946), which contains the states of North and South Dakota, Minnesota, Wisconsin, Illinois, Indiana, Ohio, Nebraska, and Missouri. The CL has been glaciated multiple times during the Quaternary, leaving behind a “patchwork” (Anders et al., 2018) of terminal moraines, till and outwash plains, and glacial lake plains that have been exposed at the surface between >500 ka and ~10 ka. Each ice advance removed and disrupted existing fluvial networks, both sub-glacially and in the pro-glacial environment. Some large valleys were carved by meltwater, but once ice was gone, surficial fluvial processes begin to act on the entirety of the exposed landscape. Because different portions of the CL were glaciated at different times, a wide range of fluvial development times exists there. Observations of drainage density variations with surface age have been made in the CL: Ruhe (1952) observed a ‘topographic discontinuity’ west of Des Moines, Iowa, where the well-drained landscape and apparently fully integrated networks in Cherokee County abut the poorly drained landscape and unelaborated networks in Pocahontas County. Several glacial moraines cross these counties; where Ruhe observed elaborated networks, their depositional ages span the Pre-Illinois Glacial Episodes (~400 ka), and where he observed unelaborated networks, the moraines were deposited during the Wisconsin Glacial Episode, only 15 ka (e.g., Dalton et al., 2020; McDanel et al., 2022). In our study we investigate drainage density in regions glaciated as recently as the Late Wisconsin Glacial Episode as well as portions of the CL beyond the maximum extent of Pre-Illinois episode glaciations. These older regions serve as potential ‘steady’ endmembers that may have achieved the maximum channel elaboration supported by the conditions of the region. Thus, the CL provides a natural laboratory for study of rates of drainage development over timescales of tens of thousands to hundreds of thousands of years.
To estimate drainage density across this region, we develop a method to approximate the natural pre-agricultural and post-glacial stream networks using a present-day high-resolution national-scale hydrologic dataset. We then measure drainage density across a regular grid with 10 km spacing. We compare drainage density with surface age, constrained by timing of glacial retreat, to estimate the rate of channel network expansion. We further investigate climatic, geologic, and geomorphic controls on this rate, and on the steady-state drainage density supported in this region. Finally, we compare observed drainage density with an independent measure of the fraction of non-contributing area (i.e., closed depressions and their catchments) to establish that drainage network expansion is accompanied by the sequential capture of internally-draining basins.
2. Glaciation and River Network Formation in the Central Lowlands
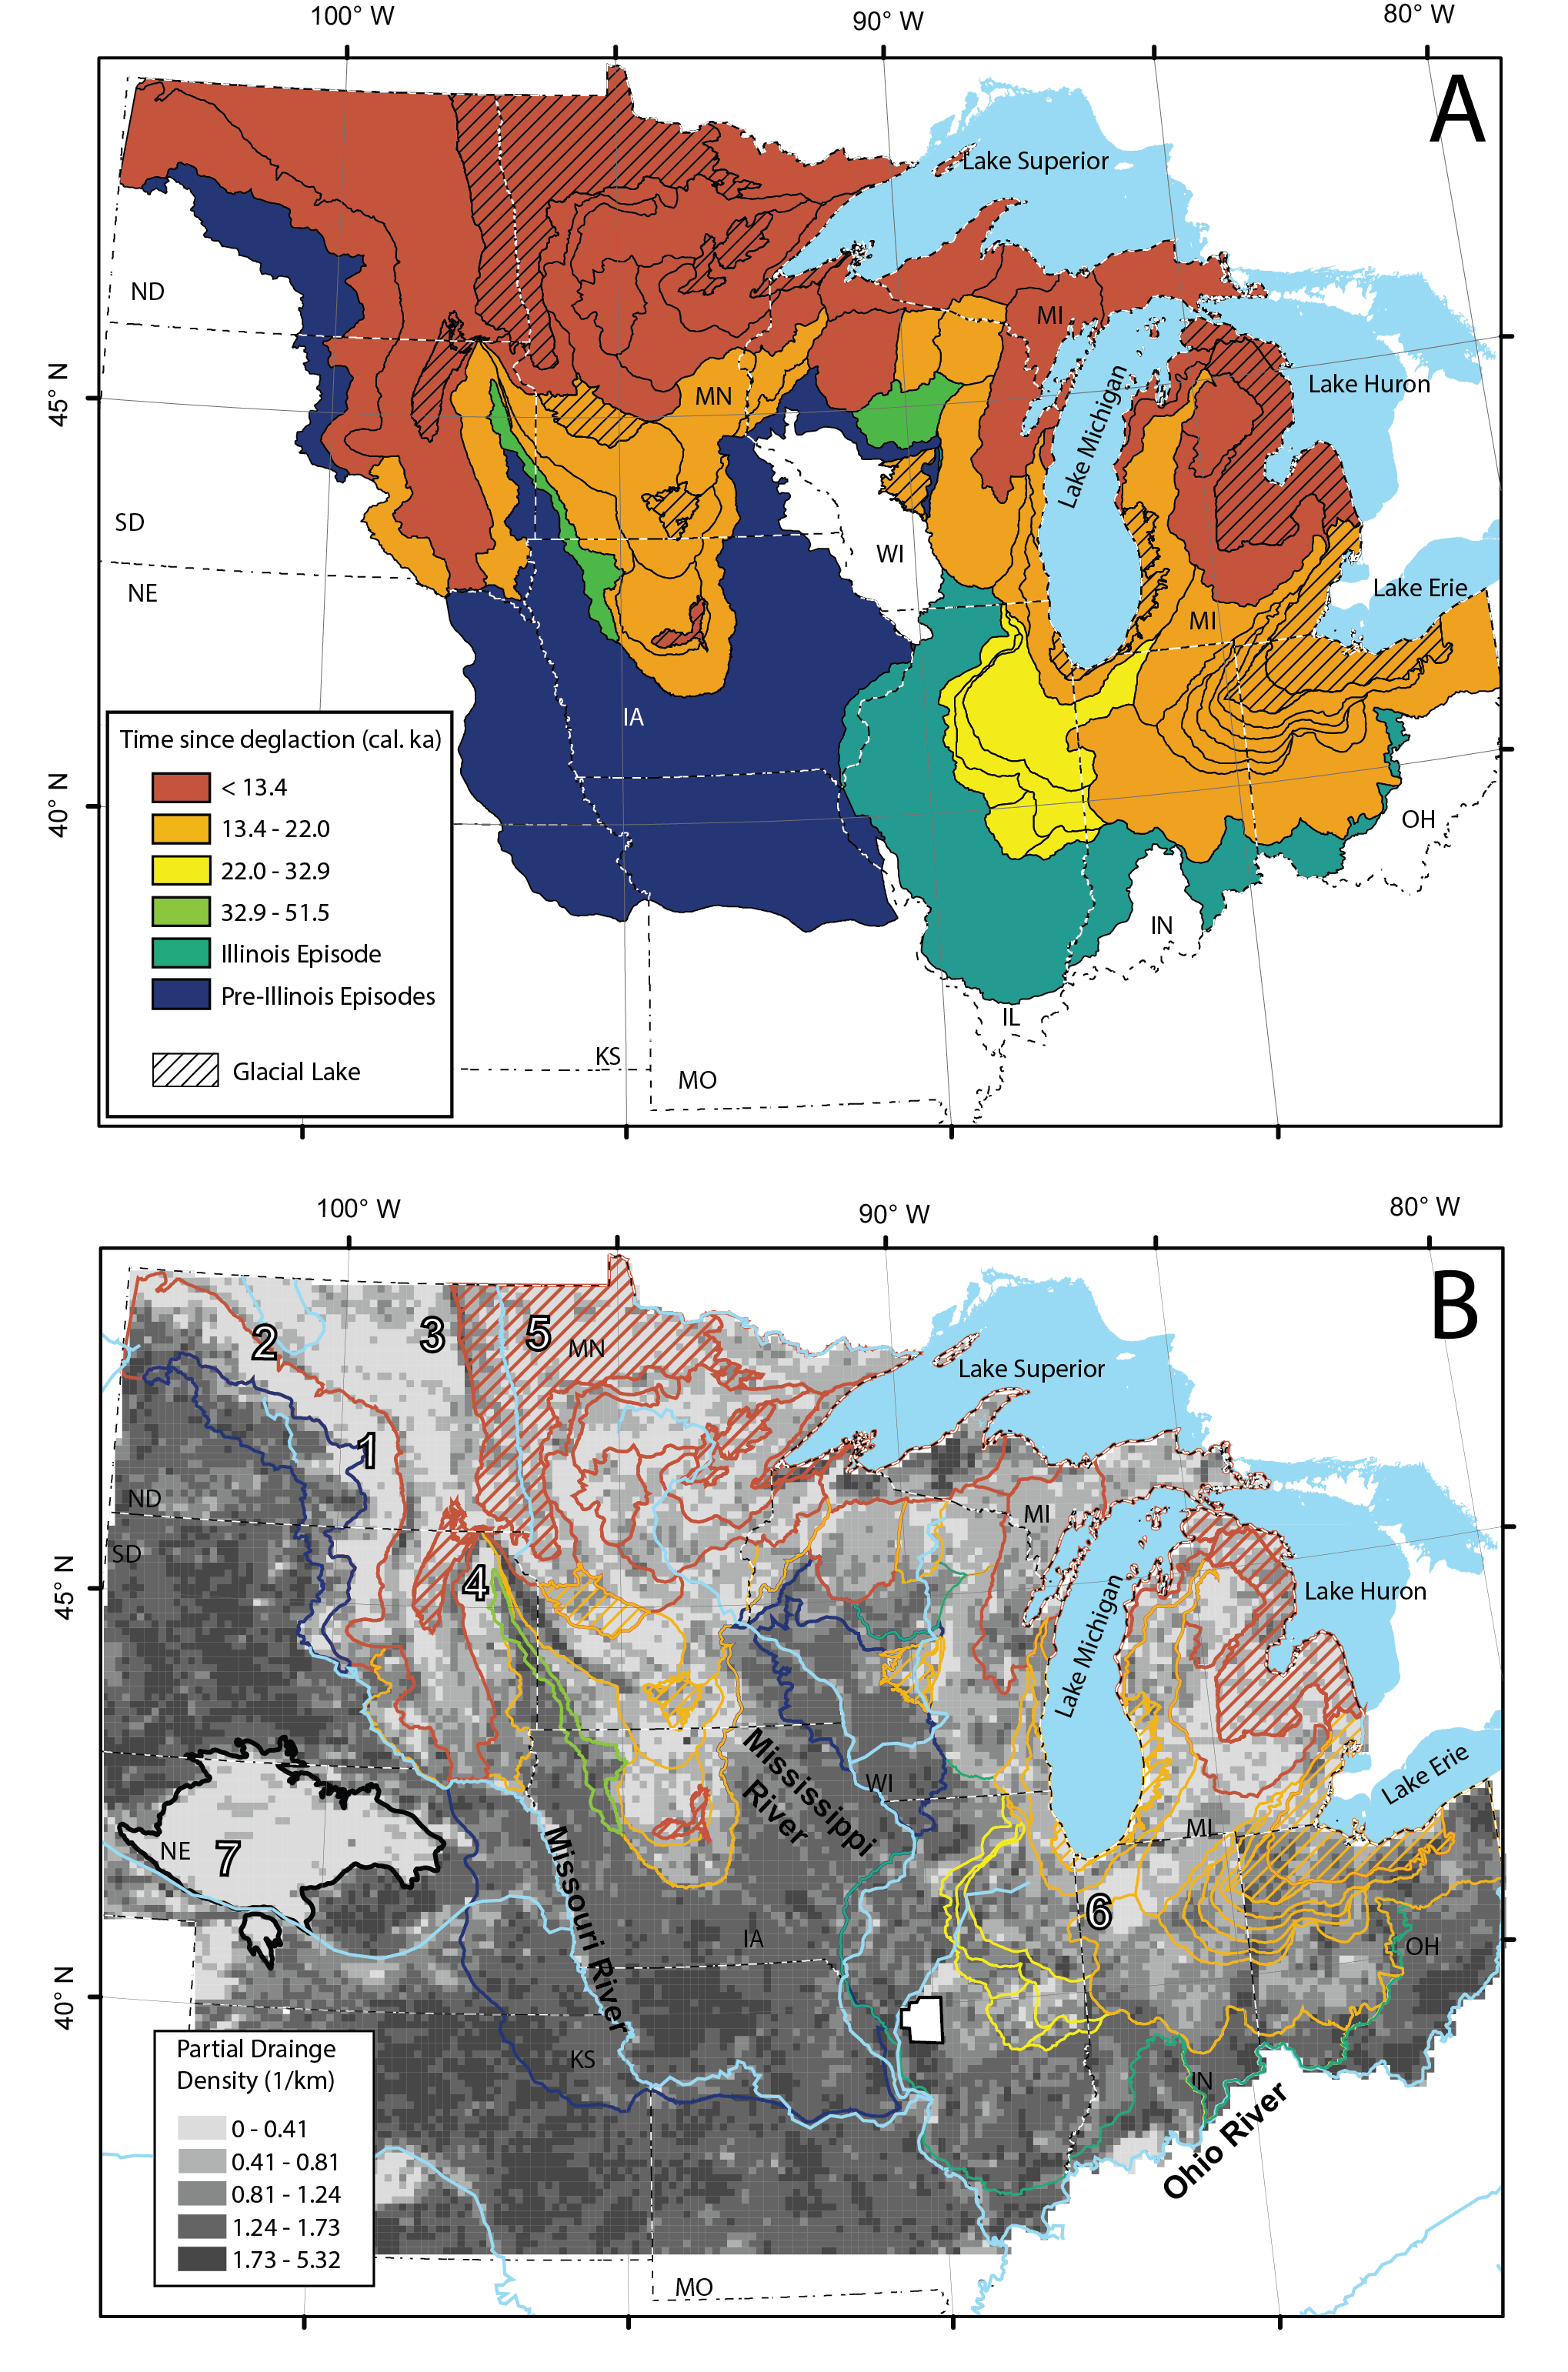
During the Quaternary the CL has been impacted by repeated glaciation. The Laurentide ice sheet grew large enough to flow into the CL multiple times during several Pre-Illinois Episodes (~1.6 million years ago to ~425 thousand years ago), the Illinois Episode, and most recently in the Wisconsin Episode. Age constraints on the deposits and landforms of the Pre-Illinois Episode glaciations are few, and a CL region-wide map of Pre-Illinois Episode material by age is not available. The Illinois Episode took place during Marine Isotope Stage 6 (MIS6, Curry et al., 2018; Martinson et al., 1987): ice advanced as far as southern Illinois ~300 thousand years ago and began retreating ~125 thousand years ago (e.g., Dalton et al., 2020; Grimley et al., 2018). Ice had fully retreated from the CL by 100 thousand years ago (e.g., Dalton et al., 2020). While some areas glaciated during Pre-Illinois Episode glaciations were re-glaciated during the Illinois Episode, some remained ice-free. During the most recent glacial period, the Wisconsin Episode, the Laurentide ice sheet reached its maximum extent ~30 thousand years ago and retreated out of the CL ~10 thousand years ago. Portions of the CL that were ice-covered have, therefore, been developing fluvial networks over a range of timescales from more than 400 thousand years to about 10 thousand years (fig. 1). Positions of glacial moraines from retreat define boundaries of areas that share attributes of depositional process and time since deglaciation (‘age’), and are termed ‘landform regions’ (McDanel et al., 2022).
As a contrasting endmember within the glacial landscape, the Paleozoic Plateau in southwestern Wisconsin and neighboring areas in Minnesota, Iowa, and Illinois is a region defined by a physiography that reflects the variability in resistance to erosion of gently dipping sedimentary bedrock (Hallberg et al., 1984). Portions of this region are referred to as the Driftless Area in reference to a lack of ice-contact glacial deposits at the surface, although early glaciations did cover at least some of the region (e.g., Carson et al., 2018; Knox, 1982; Willman & Frye, 1969). Whatever the glacial history of the Paleozoic Plateau, its current geomorphology is bedrock controlled, in strong contrast to the surrounding areas with more recent glacial sediment at the surface. Glaciation of the CL profoundly impacted topography and disrupted fluvial networks (Naylor et al., 2021): Glaciers were primarily depositional in the southern portion of the study area (e.g., Anders et al., 2018) and filled many pre-existing valleys and channels with till and outwash. Although glacial deposits are significantly less thick in the northern CL, for example, in northern Minnesota bedrock is exposed at the surface (e.g., Lusardi et al., 2019), glaciers still retreated to leave primarily low-relief surfaces that lacked connected channel networks and included numerous closed depressions in the form of lakes and wetlands. Positive topography was created where stable ice margins deposited moraines with tens of meters of relief.

While the dominant impact of glaciation in the CL was to remove fluvial landforms by filling and disrupting fluvial valleys, glacio-fluvial processes continued to act on the landscape during glaciation and glacial retreat. The Laurentide Ice Sheet moved the continental drainage divide far to the north (Wickert, 2016), and meltwater from the ice sheet drove incision of proglacial river valleys during deglaciation. Some valleys were incised by water in sub-glacial tunnel valleys (Moores, 1989), while catastrophic floods like those from glacial Lakes Agassiz (e.g., Fisher, 2020) and glacial Lake Chicago (Kehew, 1993) resulted in oversized valleys that now contain smaller, ‘underfit’, rivers. These meltwater drainage valleys would have provided an initial local base-level from which tributary valleys could grow following deglaciation. On the uplands between meltwater valleys, interpretation of soil parent material indicates that drainage density values were extremely low following glaciation and much of the upland was internally drained (McDanel, 2019; Miller, 2006).
3. Data and Methods
3.1. Pre-agriculture stream lengths
In this work we use ‘pre-agriculture’ to mean ‘pre-European settlement and modern industrial-agriculture’. Native peoples lived in the CL for thousands of years before European settlement and had their own agricultural practices, the impacts of which we do not attempt to reconstruct. We focus on processing available stream data to remove the massive impact of modern agriculture and infrastructure. Determining the length of the natural (as opposed to anthropogenic) channel network in the CL represents a challenge as much of the region’s hydrologic system has been heavily engineered. In addition to straightening existing channels, artificial drainage ditches have been installed where no natural channels existed before. These drainage ditches now comprise a significant fraction of the modern channel length in some watersheds. For example, installation of tile drains in the Upper Sangamon watershed in Illinois required significant ditch construction to provide outlets for the drains. These artificial ditches account for roughly 2/3rds of modern length of channels (Rhoads et al., 2016).
We iteratively developed a method to efficiently remove artificial flow paths from the high-resolution National Hydrography Dataset (NHD, U.S. Geological Survey & EPA, 2019), a digital representation of the channel network, to assess pre-agricultural drainage density. We chose to use the NHD as opposed to routing flow across a DEM because flow routing requires an imposed threshold drainage area for channelization beyond which channels are assumed to exist, however, channel length is the primary variable we wish to investigate. Furthermore, flow routing is compromised in anthropogenically modified areas where roads and highways can truncate channels in a standard flow routing algorithm. In contrast, line features in the National Hydrography Dataset (NHD) are primarily derived from the blue lines from the 1:24,000 scale USGS topographic maps, with additional input from county- and state-level organizations (Simley & Carswell, 2009; U.S. Geological Survey & EPA, 2001), and include observed and engineered routing of water. Because the NHD contains anthropogenic features, we needed to modify it to estimate pre-agricultural drainage density.
Our procedure selected lines from the NHD that are the most likely pre-agricultural surface streams (including ephemeral), excludes fully artificial channels, and was applied to multiple states with geographically consistent results. While geographic consistency does not indicate accuracy, using the same query on each state’s NHD is required for study repeatability. Line segments in the NHD have multiple attributes that make a query-based approach possible, including feature type (e.g., canal, ditch, coastline, pipeline, stream, artificial), information about hydrographic categories (e.g., ephemeral, perennial), and names of reaches, among others. We were particularly concerned with excluding the extensive ditch network installed over the last ~150 years in Central Illinois (Rhoads et al., 2016; Urban, 2005) and across the CL, however, these ditch networks are not always represented in the NHD. We primarily selected likely pre-agriculture streams by feature type and name and not by other attributes because of inconsistencies between states or even counties within the same state (Stanislawski et al., 2015). To accommodate some of these inconsistencies and to use non-destructive data practices we added a column to the NHD attribute table to identify streams that were selected in each query. Ultimately the procedure used a combination of two attributes: feature type (column heading: Ftype) and geographic name (column heading: GNIS_Name). Table 1 shows the results of this procedure on the Illinois NHD, and tables for other states can be found in the supplementary information (table S-1). Based on the results of our queries we gave our added column values to identify likely pre-agriculture streams. In general, we included all lines with flow types of streams or rivers, included all lines with names that have a river-like meaning (e.g., River, Creek, Branch, Run, or Fork), and excluded all lines with names like ditch or lateral. This strategy is simple, effective, and repeatable on multiple NHD state datasets. We accomplished non-destructive data sorting by adding a column to the NHD data that we used to identify segments using queries.
3.2. Partial drainage density distributions
Traditionally, drainage density is measured within a watershed. However, in the glaciated CL, watersheds cut across moraines many thousands of years different in age. In order to assess drainage density within time boundaries, as opposed to watershed boundaries, we calculate a partial drainage density within each 10 by10 km cell of a fishnet grid that covers the study area. We examine the full distribution of ‘partial drainage densities’ (PDD) within a region of interest to consider mechanisms of network integration across large surfaces. The distribution of PDD values provides a measure of spatial variability of drainage density within a watershed or landform region. We expect that spatial variability in drainage density within a watershed will decrease over time as the channel network approaches maturity, and therefore the statistical spread of PDD values should decrease with surface age.
Once the NHD flowlines are filtered to remove drainage ditches, we compute partial drainage density in each box in the fishnet grid. This is accomplished by first cutting stream segments that intersect the fishnet grid. We then give each segment within an individual grid cell an identifying attribute of that grid cell, then sum the length of the streams per grid cell attribute. This value is divided by 100 km2 (the area of each fishnet grid cell) to produce a grid of PDD values. PDD values thus have the same units as drainage density (km−1).
After producing the map of PDD from the NHD we identified regions with anomalously high and low (beyond 3 standard deviations) PDD. Such inconsistencies in the NHD have been identified by others (e.g., Stanislawski et al., 2015). Where extremely high PDD values reflected a high stream density that followed county borders (as opposed to topographic boundaries), the county was excluded from the analysis. These grid cells are identified in the geodatabase with a flag in the attribute table. A total of 25 grid cells were removed from the entire dataset. High and low values that did not follow county borders are included in the analysis.
3.3. Landform regions and ages
We idealize the CL as a patchwork of glacial landforms, with each patch having a uniform age (fig. 1). These ages are equivalent to the time that has elapsed since glacial processes ceased and fluvial processes have operated without direct glacial influence. We use glacial landform regions determined by McDanel et al. (2022) to divide the glaciated CL into patches. Landform-region boundaries are based on surface geology, soil data, and topography, and each region represents an area formed by the same or related processes at approximately the same time. For example, a recessional moraine and the area behind it is an example of a landform region. Similarly, glacial lake plains or outwash plains are landform regions.
Landform region ages are also from McDanel et al. (2022) and are primarily based on Dalton et al.'s (2020) compiled dataset of calibrated 14C dates. Reported ages with sample locations stratigraphically in or above the last till layer were averaged within each landform region. For landform regions without sample points in Dalton et al. (2020) (n = 15), ages from recent publications were used. In the rare instance (n = 2) that an average age was discordant with adjacent chronology, that landform was assigned an age that is geologically feasible. In some instances where glacial retreat formed closely spaced recessional moraines in relatively quick succession (e.g., in southern Indiana), landform regions have been merged and the average age of exposure has been used. More detail on the choice of age data and its relationship to landform regions is presented in McDanel et al. (2022).
Some portions of the study area were not glaciated in the Pleistocene (> 2.5 Ma) including areas beyond the glacial margins in the western Dakotas, Nebraska, Kansas, and Missouri. The Paleozoic Plateau region is another portion of our study area where the present fluvial network does not reflect Quaternary glaciation. Early glaciations did cover at least portions of the Paleozoic Plateau (e.g., Knox, 1982; Willman & Frye, 1969), but their poorly constrained boundaries do not significantly influence the geomorphology. We include these areas to serve as steady-state endmembers and assume that drainage density has a value in these regions that reflects adjustment to local physical and climatic conditions. An exception is the sandhills of Nebraska, part of the Great Plains physiographic province (Fenneman & Johnson, 1946). The sandhills are covered in sand dunes that were active as recently as 17–14 ka (Mason et al., 2011). Muhs and Budahn (2019) found that the dunes are interbedded sand and loess, indicating that the region was glacially influenced during the Holocene, despite not being actively glaciated. For this reason, we do not include results from this area in either the end-member unglaciated dataset or the glaciated dataset.
As we expect that rates of change of drainage density may decrease over time, we evaluate the relationship between PDD and the natural log of surface age in addition to the direct relationship between PDD and age. If the rate of increase in PDD follows an exponential trend with time since deglaciation, then we should observe a linear relationship between PDD and the natural log of surface age.
3.4. Controls on drainage development
In addition to surface age, we compiled data sets of physical factors that may influence rates of channel network expansion and steady values of drainage density in older regions to compare with PDD at the scale of our reconstruction. These factors include soil texture, topographic roughness, and precipitation.
The drainage networks of the glaciated CL are formed in surficial deposits, the physical properties of which influence drainage development in a manner analogous to the way that lithology influences drainage networks in bedrock landscapes. Soil texture, a surrogate for geological substrate that is largely controlled by parent material, influences infiltration rates and sediment mobility, and thus the tendency for channel initiation via overland flow (e.g., Schumm, 1956). The metric of soil texture selected for this study is the percent sand below the plow layer (depth of 1.0 m to 1.5 m) (after Miller, 2006). Soil data from the National Resources Conservation Service (Soil Survey Staff, n.d.) was extracted for the area of interest. Using the Gridded Soil Survey Geographic Database (gSSURGO) mapping toolbox, percent sand was calculated, then the zonal statistics tool in ArcMap 10.8 (ESRI, 2020) was used to average percent sand for each grid cell.
We compute topographic roughness, defined here as the standard deviation of elevation within a grid cell, across the study area. We expect that the variability of elevation within each 100 km2 grid cell should correlate with the likelihood of exceeding the threshold for channelization because greater variability in elevation allows steeper local slopes. While there are many measures of roughness in the earth sciences (discussed in detail in Smith, 2014), we chose standard deviation of elevation within a grid cell because the regional scale of the analyses and the size of each grid cell (100 km2) is much larger than individual streams and valleys (tens of meters to thousands of meters), but smaller than many of the defining glacial features of the region, such as moraines and pro-glacial lakes. This definition of roughness is an objective parameter capable of identifying variability in both channelized and unchannelized landscapes. Topographic roughness was calculated for each grid cell as the standard deviation of elevation values from a 30 m digital elevation model (U.S. Geological Survey, 2021).
Precipitation rates across the CL varied significantly during the Quaternary, including variability within the Holocene (Routson et al., 2019; Shuman & Marsicek, 2016). We do not attempt to reconstruct past patterns of precipitation or account for temporal variability in precipitation but instead compare modern precipitation rates to the distribution of PDD. We suggest that large-scale spatial gradients in modern precipitation are similar to those present following the Wisconsin Episode. Specifically, we assume drier conditions to the north and west relative to the south and east throughout the Holocene, as supported by the finding of significant spatially coherent variability by Shuman and Marsicek (2016). These climate gradients control the availability of surface water to drive channel incision. Additionally, precipitation is a significant control on vegetation type, which may influence stream development. We do not attempt to separate the influence of vegetation from that of precipitation in this study. Annual precipitation normals for the period 1981–2010 gridded at 4-km resolution using the PRISM algorithm were obtained from the PRISM Climate Group (2012). The data set was re-gridded without interpolation to a five times higher resolution so that the average precipitation could be appropriately weighted within the 10 km resolution fishnet. An average annual modern precipitation value was calculated by averaging the re-gridded PRISM values within each fishnet grid cell (approximately 180 values per box).
3.5. Non-contributing area
Finally, we examine an alternative and independent measure of fluvial network development: the percentage of non-contributing area within a landscape. Non-contributing area is defined as the portion of the landscape that lacks continuous paths to ocean-going channels, therefore, NCA represents closed basins rather than simply unchannelized hillslope areas of a watershed. In other words, precipitation that falls within a NCA will not, via overland flow, ultimately arrive at a channel that flows to the ocean.
Non-contributing areas were identified through a soils mapping technique developed by Miller (2006) and mapping of NCA across the CL was accomplished by McDanel (2019). This technique relies on the fact that soils retain characteristics of past environments, particularly in relation to saturation. Despite widespread draining of wetland prairie in the CL during the conversion to agriculture, former wetlands can still be identified. The wetland soils remained saturated for long periods of time prior to agriculture, developing thick accumulations of organic matter and, frequently, gleyed horizons. These and other indicators are captured in the Soil Survey database and were used by McDanel (2019) to delineate the extent of regions that were formerly commonly saturated. McDanel (2019) assumed that these saturated soils in the uplands represented water-sink regions of NCA. Once these areas were identified, they delineated the extent of the watershed that drains into these depressions; the entirety of this area is identified as non-contributing area. NCA is reported as a percentage of cell area.
3.6. Statistical treatment of data
To avoid issues of small sample size we perform a bootstrap on each dataset when distinguishing between populations of PDD. To investigate the possibility that different surface ages have indistinguishable PDD populations we used a Mann Whitney-U test. As we perform multiple pair-wise tests, we also employ a Bonferroni adjustment to the significant p value. As a result, p values must be less than 0.0125 for the null hypothesis to be rejected. We also calculate the Pearson correlation coefficient (r) and the Spearman’s correlation coefficient (ρ) between raw values (not bootstrapped) of PDD and surface age to determine the extent of linear and monotonic relationships between PDD and time since deglaciation at the spatial resolution of our reconstruction of PDD. Due to the timescale of radiocarbon dates and the limited availability of other age data, we focus our analysis on surfaces glaciated during the Wisconsin Episode and Illinois Episode. We nominally assign an age of 120 ka to surfaces glaciated most recently during the Illinois Episode, as representative of the approximate time of glacial retreat from the southern margin. Because northern portions of the Illinois Episode surface were re-glaciated during the Wisconsin Episode, even though the Illinois Episode maximum glacial extent extended further south than the Wisconsin glacial extent, the Illinois Episode surface is not preserved over as large a range of ages as the Wisconsin Episode. As we suspect that the extension of the channel network following glaciation may have been non-linear, we also consider the correlation between PDD and the natural logarithm of age in years. We calculate a Pearson and Spearman’s correlation coefficient matrix for each attribute observed (PDD, surface age, annual mean precipitation, soil sand percentage, roughness, and percent of non-contributing area) for both Illinois Episode and younger surfaces as well as surfaces glaciated before the Illinois Episode or not glaciated. We also assess the covariance of the different attributes with a partial linear correlation. All data manipulation and statistical evaluations were performed in MATLAB using built-in statistics functions (The MathWorks, 2024).
4. Results
4.1. Spatial patterns of PDD across the Central Lowlands
The spatial patterns of reconstructed pre-agriculture PDD reflect the time since most recent glaciation: Most of the area glaciated during the Wisconsin Episode has low drainage density, while regions that were glaciated during the Illinois Episode or earlier - or not glaciated at all - have higher drainage density (fig. 1B). Several linear patterns of high and low PDD are visible; these can be identified as major flood paths, moraines, or topographic features. Major tributaries of the Mississippi River are visible, as are rivers that conveyed glacial lake floodwaters (e.g., the Missouri River, which served as a floodway for Glacial Lake Agassiz), and commonly appear as lines of low PDD within a zone of high PDD. The Missouri Escarpment (fig. 1B-2) is apparent in North Dakota (ND) as a NW-SE trending region of higher drainage density, just east of the low-drainage density Missouri Coteau (fig. 1B-1) and the Wisconsin Episode boundary. East of the Dakotas a similar pattern can be seen with high drainage density along the Pembina Escarpment (fig. 1B-3) and low drainage density in the Prairie Coteau (fig. 1B-4). In recently glaciated regions, some moraines are visible as higher drainage density zones amid the lower drainage density zones of surrounding ground moraines or outwash plains. Glacial lakes are visible as broad regions of low drainage density, such as Glacial Lake Agassiz (fig. 1B-5). Glacial Lake Kankakee is also visible as a low drainage density zone just south of modern Lake Michigan (fig. 1B-6). In the unglaciated regions and Paleozoic Plateau, PDD values are generally high with notable exceptions in the sand hills of western Nebraska (fig. 1B-7) (NE), portions of the high plains of western Kansas (KS), and the Arkansas River lowlands in central Kansas (KS).
4.2. PDD of Wisconsin Episode surfaces compared with older surfaces
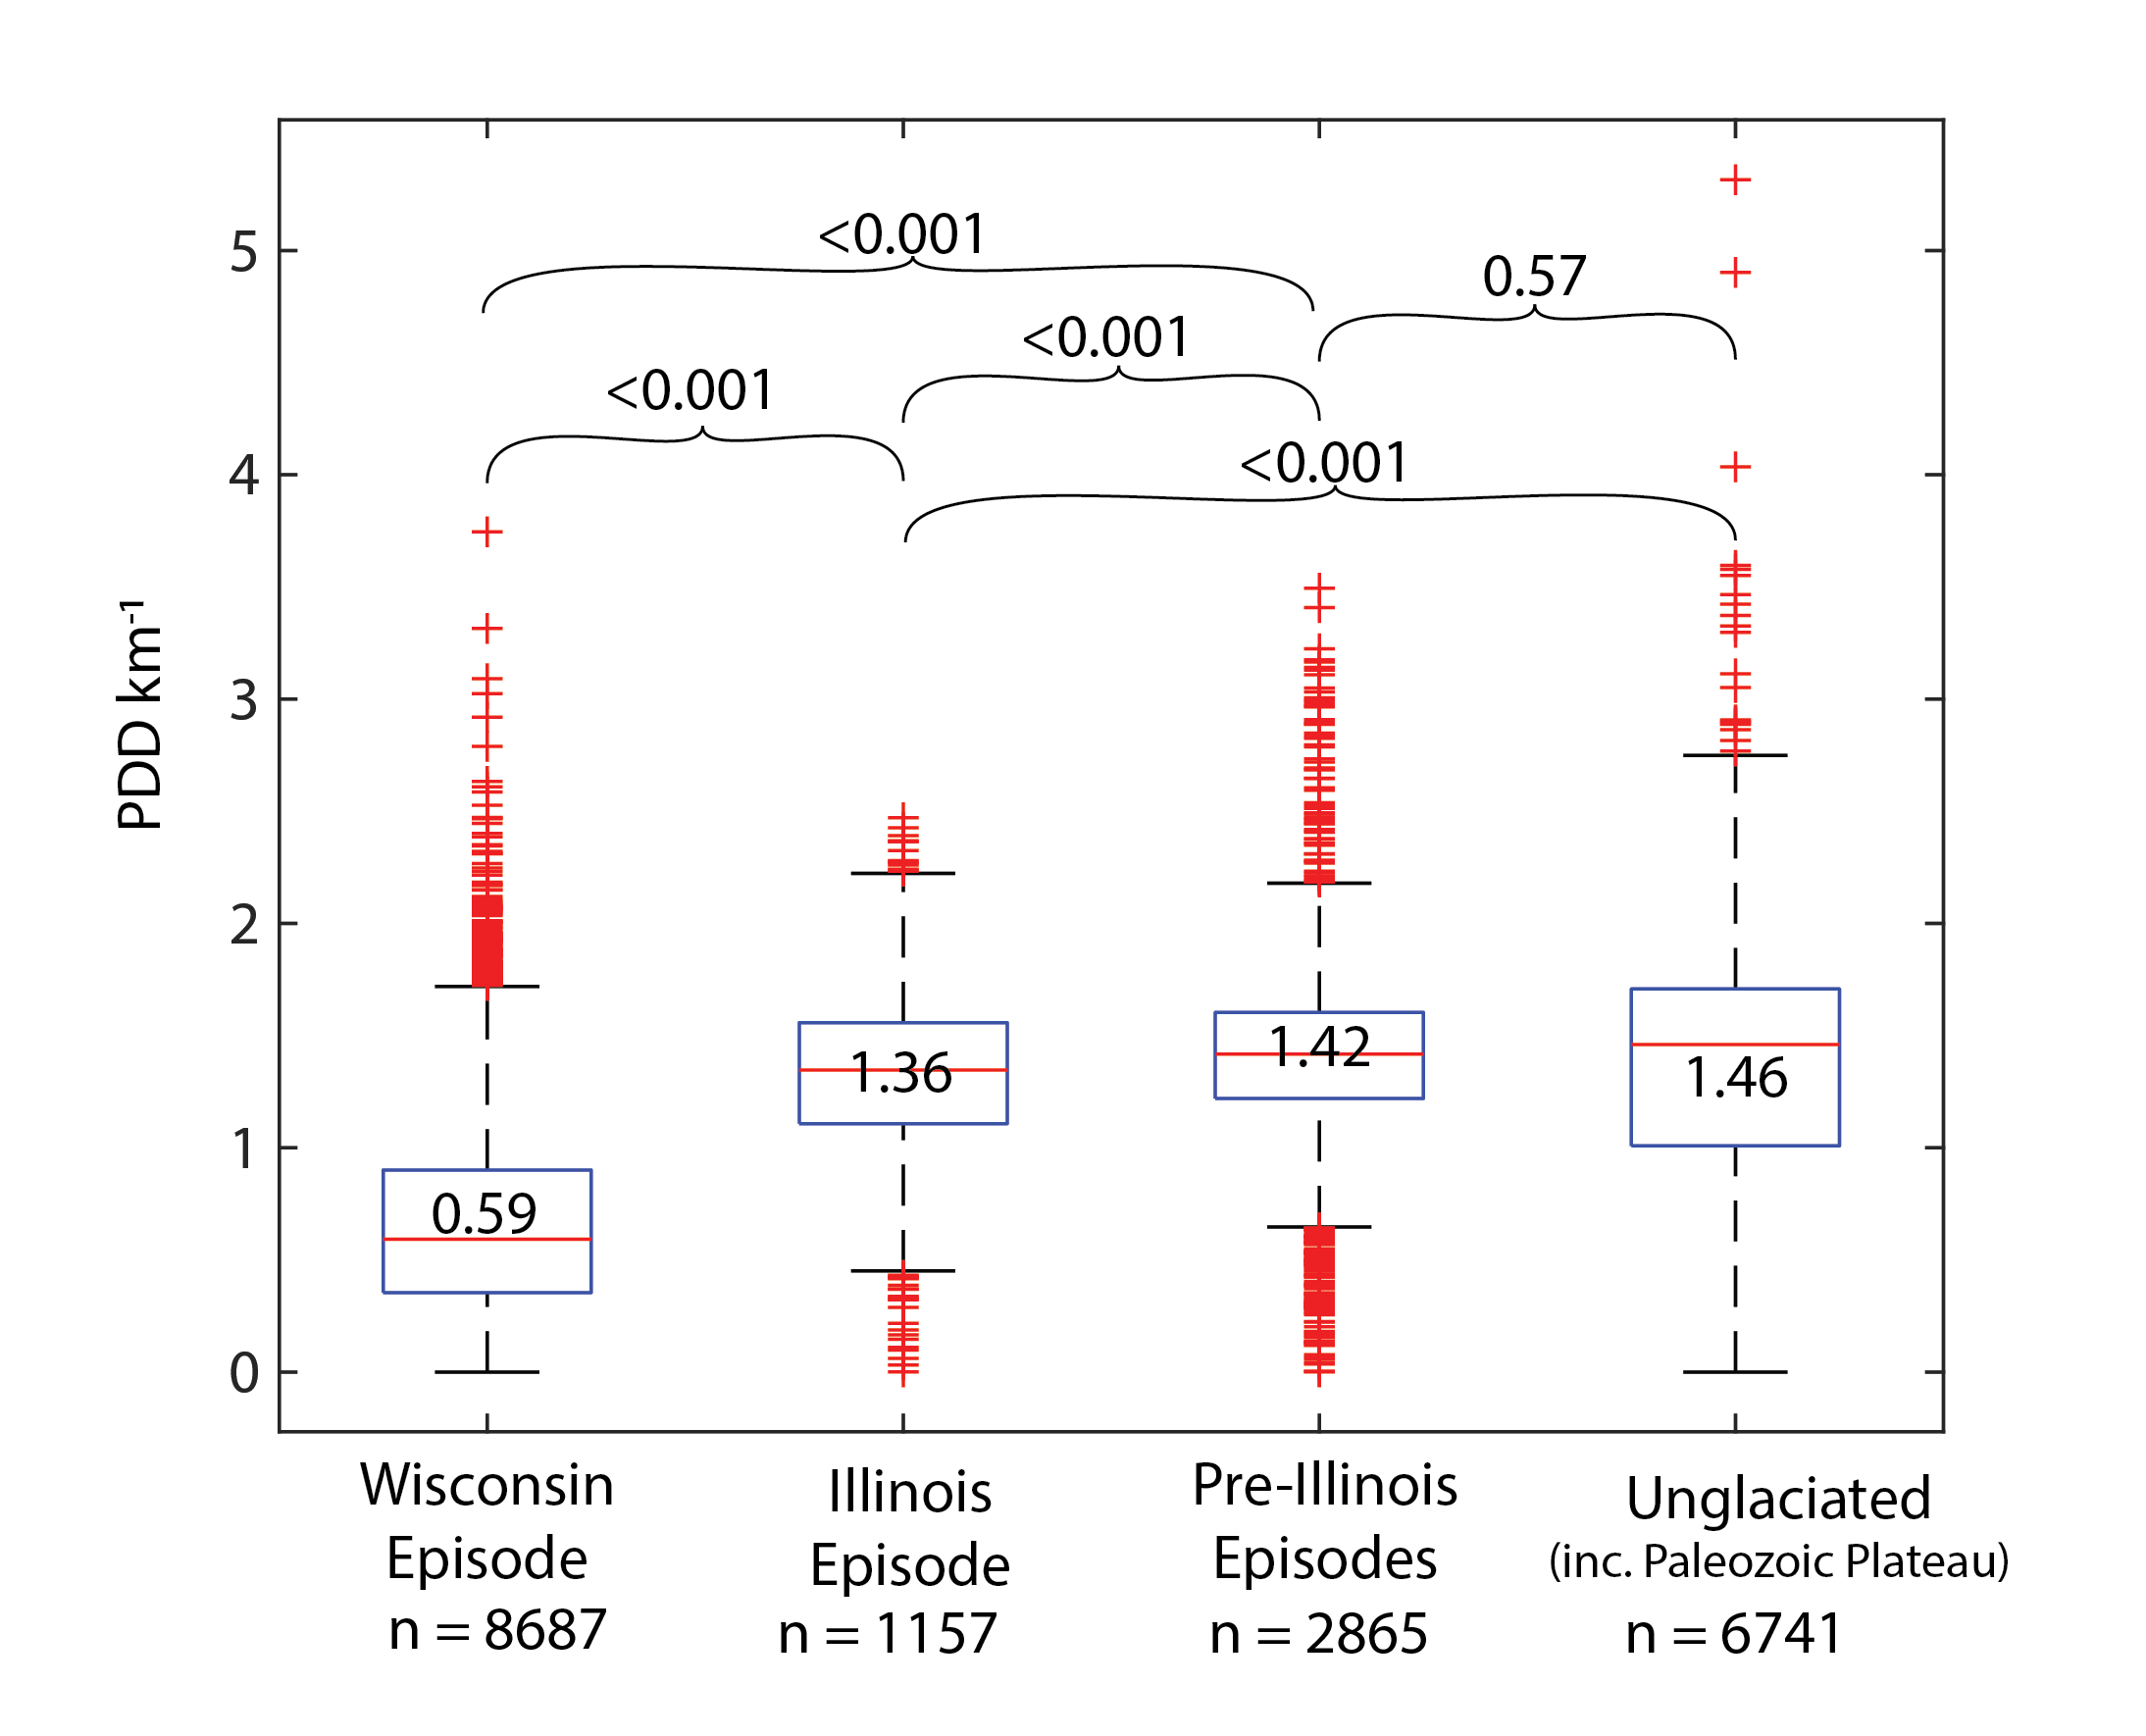
The spatial association of PDD variability with time since most recent glaciation apparent in figure 1 is accompanied by statistically significant differences in PDD between four groups of landform regions: I. Wisconsin Episode surfaces, II. Illinois Episode surfaces, III. Pre-Illinois Episodes surfaces, and IV. Paleozoic Plateau and unglaciated surfaces (fig. 2). PDD values are not normally distributed, so we used a Mann-Whitney U-test. Results of the Mann-Whitney U-test indicate that PDD values from Wisconsin Episode surfaces have a distinct population from the Illinois Episode, Pre-Illinois Episodes, and combined Paleozoic Plateau and unglaciated surfaces. Similarly, the Illinois Episode PDD population can be distinguished from the other groups. In contrast, PDD populations from Pre-Illinois Episode surfaces come from populations with median PDD values indistinguishable from the combined Paleozoic Plateau and unglaciated regions.
._boxes_show_95__confidence_intervals_and_red_lin.png)
4.3. Correlation of PDD and Surface Age
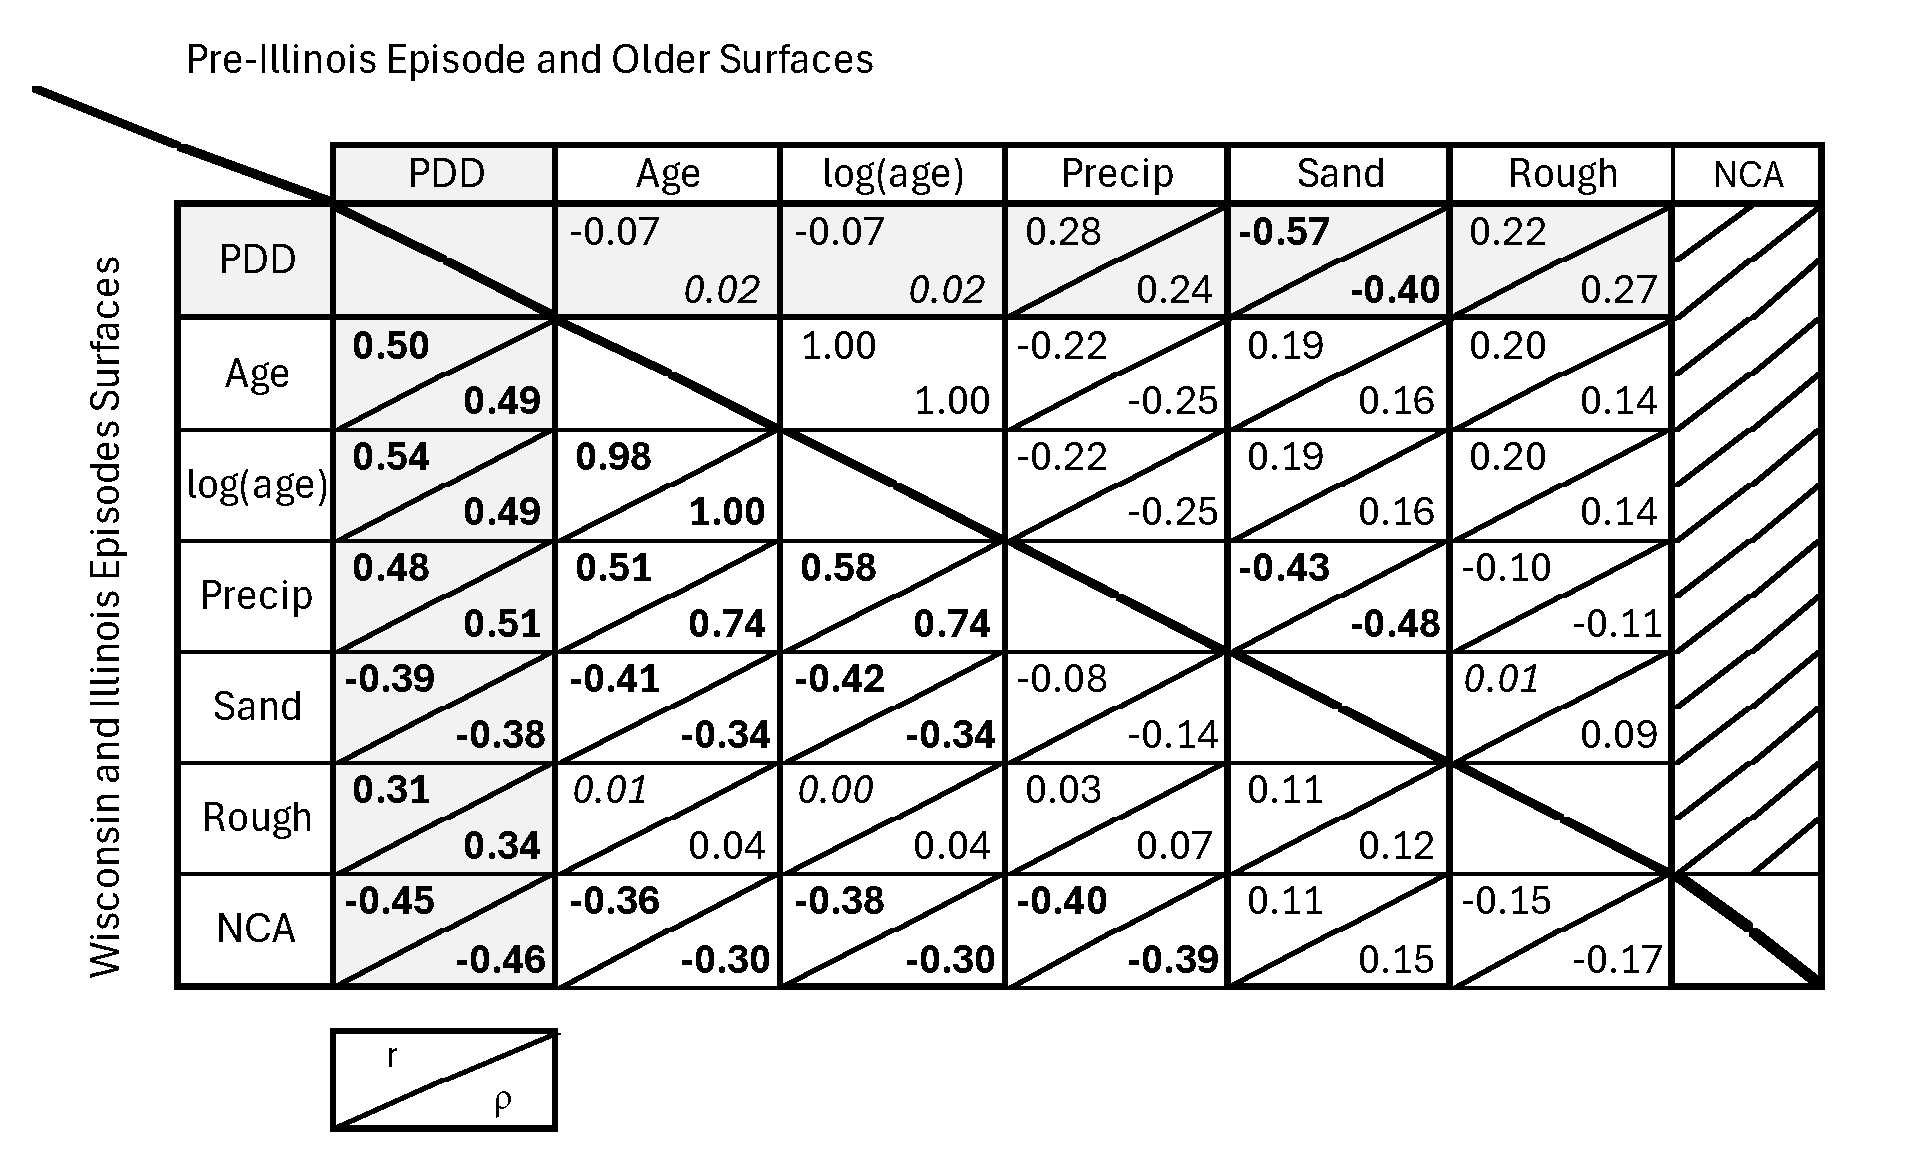
We find a significant positive linear correlation between time since deglaciation for regions that have been deglaciated since the Illinois Episode and PDD with an r-value of 0.50 and also a significant positive monotonic correlation with a Spearman’s ρ value of 0.49 (fig. 3). These values indicate that PDD increases with surface age in the CL. The linear and monotonic relationships between PDD and the natural logarithm of age are also significant with larger r and ρ values of 0.54 and 0.49, respectively. The improved linear relationship between PDD and the natural logarithm of age is consistent with a decreasing rate of expansion of channel networks through time. For surfaces that have been deglaciated for longer than the Illinois Episode we find only a weak relationship between PDD and time, which is also consistent with a decreasing rate of network expansion with time.
_and_monotonic_spearmans_correlation_coeffic.png)
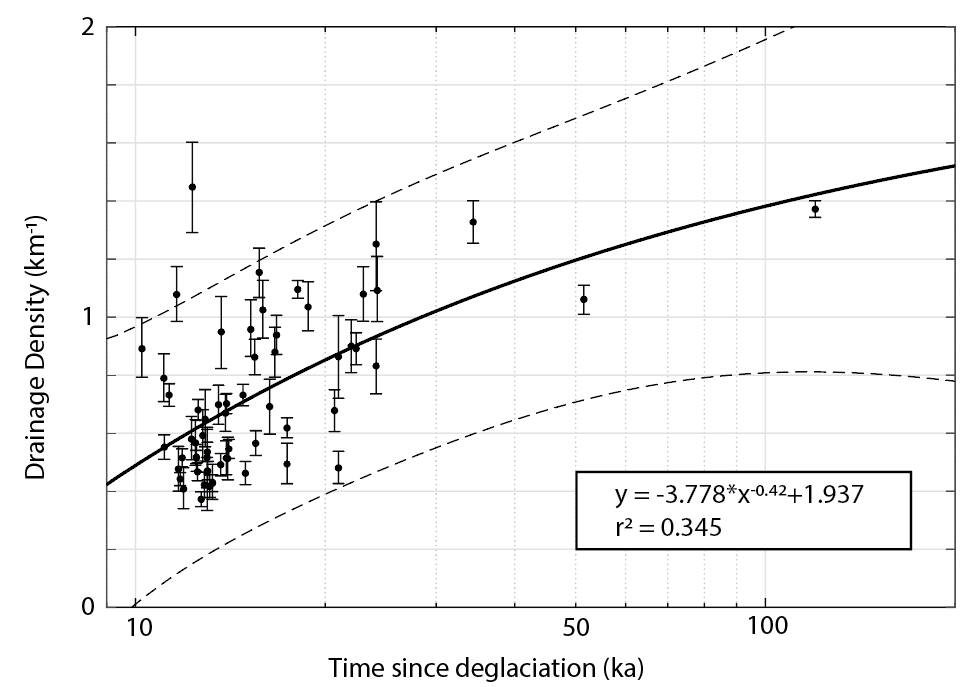
We further visualize the relationship between PDD and age by plotting the mean PDD value of each landform region (n=61) by the time since deglaciation of that region (fig. 4). We also plot the 95% confidence intervals for PDD values of each region and fit a power law to the data to aid in visualization.

We bootstrap the PDD data and show it as histograms (fig. 5). PDD in these histograms is binned by the natural logarithm of age with minor adjustments to group data by glacial Episode. The age groups are defined by breaks at values of 9.0, 9.5, 10.0, 10.4, 11.5 and 12 for the natural logarithm of age in years. These breaks are chosen to provide reasonable sample sizes and to honor the timing of glacial retreat, and because of the slightly improved correlation of log(age) over age with PDD (fig. 3). As the logarithm of age increases, the mean of the distribution of PDD values increases, but at a decreasing rate, suggesting that extension of the channel network slows over time.
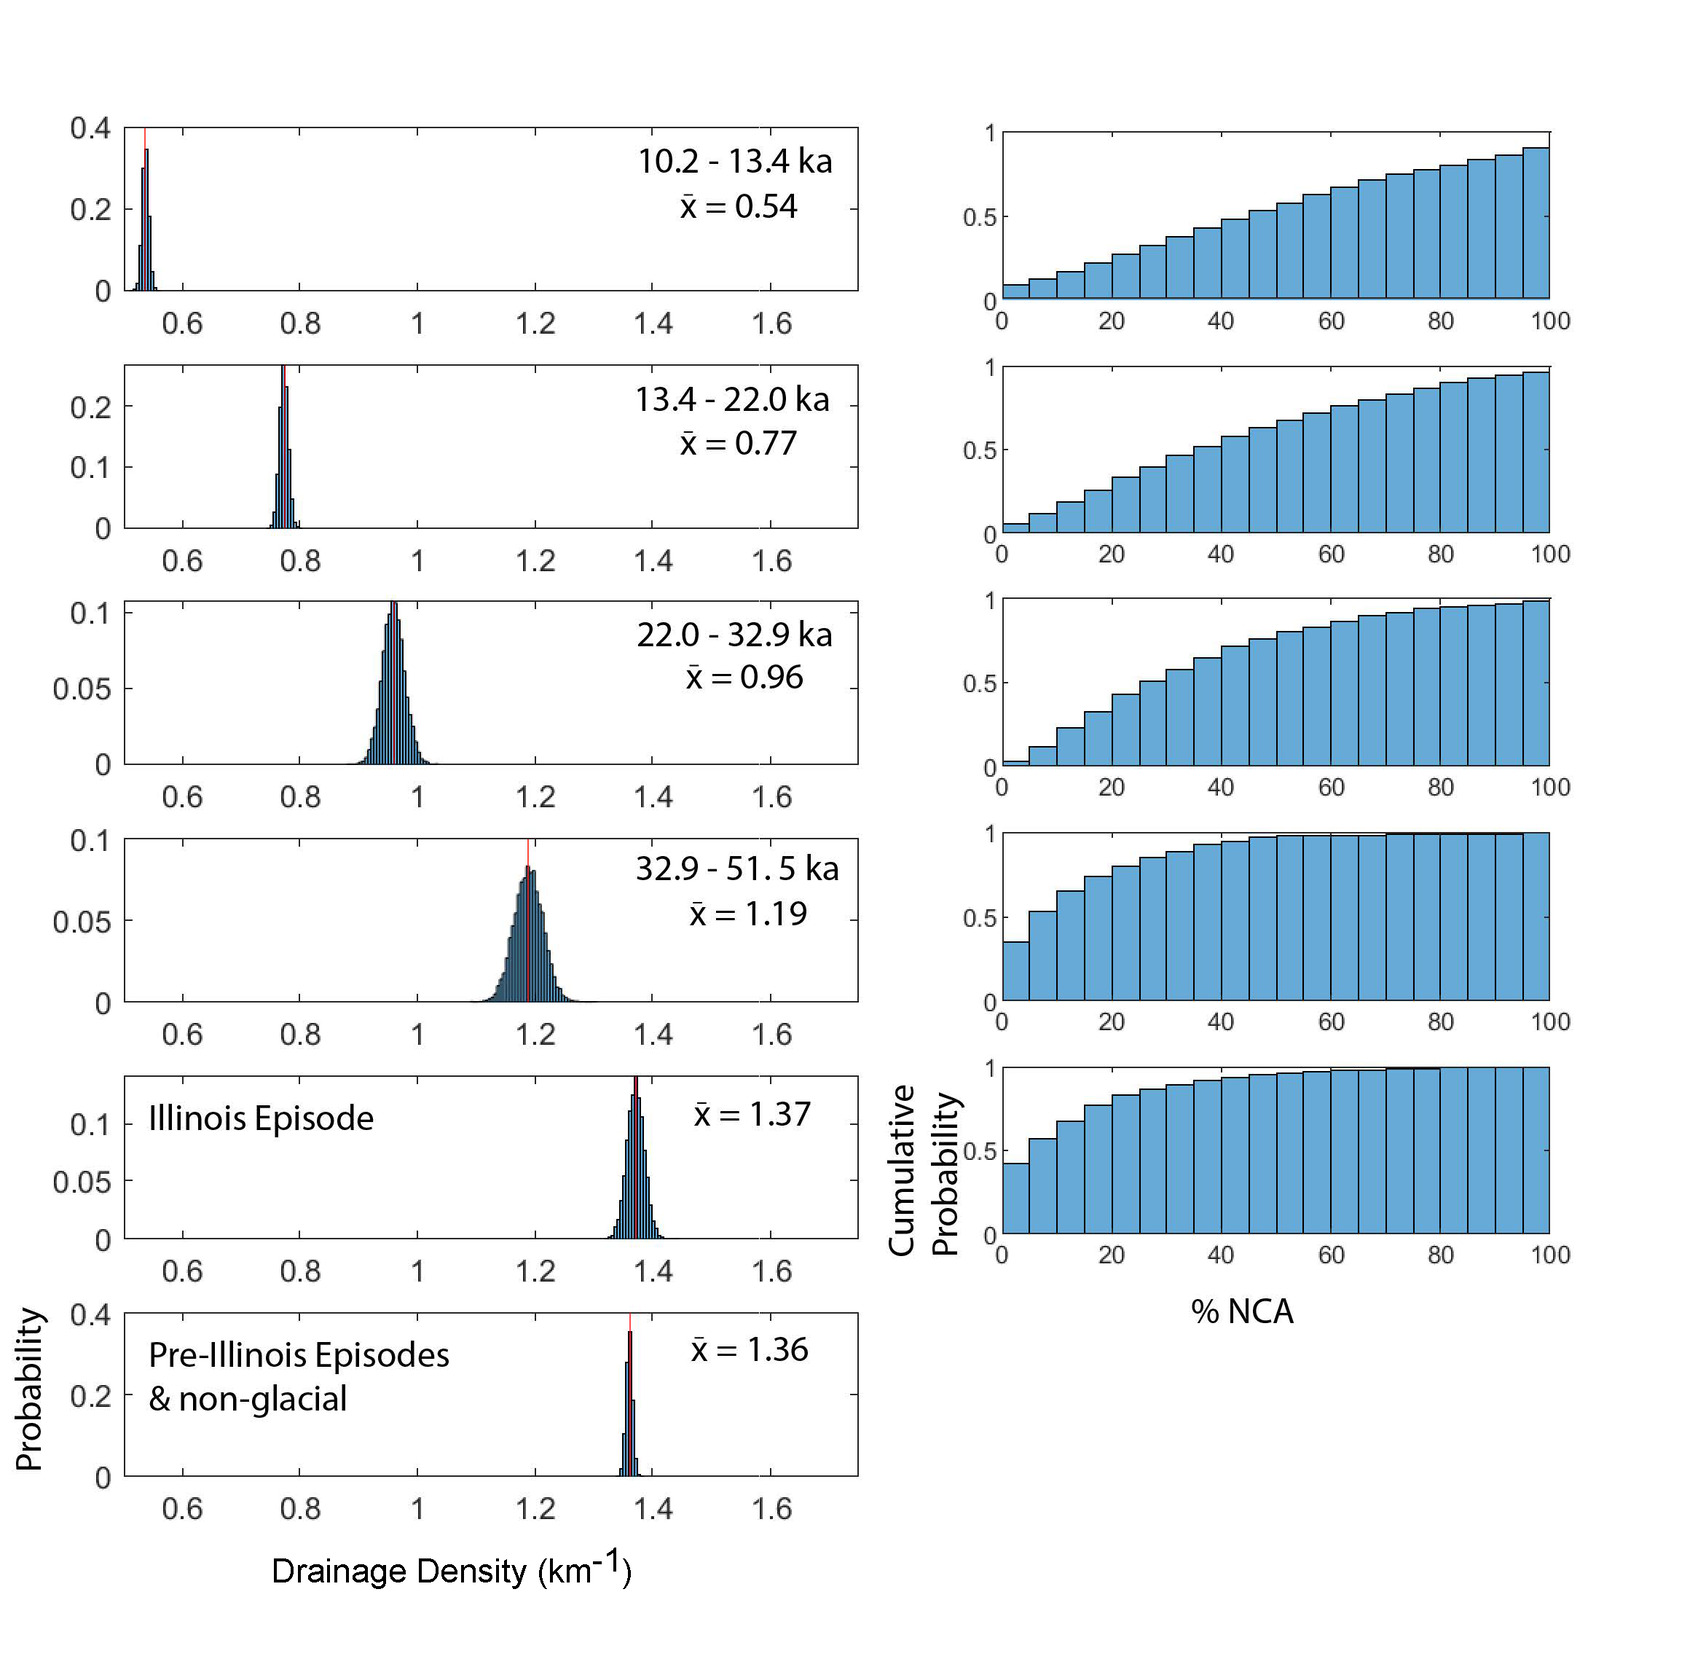
We also find a significant negative correlation between NCA and age (r = −0.035, ρ = −0.038), which we anticipate because of the relationship between NCA and PDD. The monotonic relationship is stronger in the NCA-Age comparison, but the linear relationship strengthens when NCA is compared to the natural log of age (fig. 3). Cumulative probability plots of NCA with the same age groups as PDD (fig. 5) show only minor differences between the first two groups (10.2–13.4 ka and 13.4–22 ka) and rapidly decreasing probabilities of high NCA % in the older groups.
4.4. Correlations of PDD and other factors
We also consider the relationships between PDD and other variables (sandiness, topographic roughness, and modern precipitation) to assess the possible importance of these factors in controlling either the steady value of PDD or the rate of gain in PDD over time. First, we consider surfaces older than the Illinois Episode that we assume to have achieved a steady value of PDD. On these surfaces the only significant correlation with PDD is a negative linear and monotonic relationship between PDD and sand fraction (fig. 3).
On surfaces glaciated during the Wisconsin and Illinois Episodes, PDD is significantly correlated both linearly and monotonically with modern precipitation, sand fraction, and topographic roughness (fig. 3). The strongest correlation between a variable and PDD is a positive one between PDD and precipitation (r = 0.48, ρ = 0.51) which would support an interpretation that greater precipitation rates allow for faster expansion of drainage networks. However, there is also a very strong coincidental correlation between modern precipitation rates and surface age (r = 0.51, ρ = 0.74). When we control for precipitation and calculate the partial linear correlation coefficient between PDD and surface age, the result is still significant (r=0.34). The partial linear correlation between PDD and the natural logarithm of surface age when controlling for precipitation is also significant (r=0.37). The partial linear correlation between PDD and precipitation, when controlling for surface age is also significant (r = 0.30). Together, these correlations suggest that PDD increases over time and that greater amounts of precipitation allow for faster increases in PDD.
We also observe a significant negative correlation between PDD and sand fraction in the Wisconsin and Illinois Episode age surfaces (r = −0.39, ρ = −0.38), which is similar in strength to that observed on old surfaces (fig. 3). Finally, there is a significant positive relationship between topographic roughness and PDD (r = 0.31, ρ = 0.34). Our conceptual model of the nucleation and expansion of drainage networks in the CL emphasizes the progressive capture and integration of the non-contributing area characteristic of the post-glacial landscape. We find a significant negative linear and monotonic relationship between PDD and the fraction of NCA (r = −0.45, ρ = −0.46). The percentage of NCA decreases as PDD increases (fig. 5). This observation supports our proposal that percentage NCA provides an alternative and independent metric of fluvial development in the post-glacial CL.
5. Discussion
By taking advantage of the presence of surfaces of different ages, we document, for the first time, the evolution of drainage density at the regional scale in an area of low relief. We set out to determine if spatial patterns in drainage density across the CL are consistent with the existence of a steady equilibrium drainage density value and if those patterns support a decaying rate of drainage density expansion with time since deglaciation. We find some evidence in support of both.
The existence of an equilibrium stable value of drainage density across the CL is somewhat supported by the data in that the average value of drainage density in unglaciated portions of the CL (1.46 km-1) is much closer to the value of pre-Illinois Episode surfaces (1.42 km-1) than it is to more recently glaciated regions. However, this value is still statistically significantly different from Illinois and Wisconsin episode regions. Additionally, the variability in drainage density across unglaciated portions of the CL, exclusive of the Sand Hills, is larger than the variability of drainage density within glacial surfaces of different ages as seen in figure 2. Therefore, we do not see evidence of a tightening of the distribution of drainage density values over time as expected if there were a regional steady value. Very low PDD is observed in the Sand Hills and PDD values are negatively correlated with sand fraction in both Wisconsin/Illinois Episode surfaces and Pre-Illinois/non-glacial surfaces exclusive of the Sand Hills (fig 3). If there is an equilibrium value of drainage density, soil texture may influence it. Shorter streams appear able to effectively drain sandy regions relative to silty regions an idea consistent with Morisawa’s observations of lower drainage density on sandy areas as compared with silty areas of an uplifted lakebed (1964). More generally, our finding suggests that a single steady value of drainage density for the entire CL may not be a reasonable expectation due to variability in geology, climate, and vegetation.
PDD increases with time since deglaciation and there is a slightly stronger correlation between the natural log of time and PDD (fig. 3), which suggests that the rate of change is variable in time. Strong evidence for a decaying rate of increase in drainage density comes from the comparison of median values of drainage density across three glacial episodes (Wisconsin, Illinois, and Pre-Illinois Episodes) and unglaciated portions of the CL (fig. 2), and from comparing the mean drainage density of landform regions (fig. 4). The very large change in median drainage density from Wisconsin Episode surfaces (0.59 km-1) to Illinois Episode surfaces (1.36 km-1) is in stark contrast to the much smaller difference in the median values of drainage density for the Illinois Episode surfaces (1.36 km-1) versus the pre-Illinois Episode surfaces (1.42 km-1), despite the fact that the difference in time for drainage network expansion between Illinois Episode and pre-Illinois Episode glaciations is at least as long as that between Illinois Episode and Wisconsin Episode, and potentially much longer as the pre-Illinois Episode surfaces include some not glaciated for more than 500,000 years.
While a decreasing rate of change of PDD is supported by our observations, we do not argue that this rate has smoothly varied through time. In particular, the rate of stream network growth in unglaciated regions during glacial episodes may have been significantly different than during interglacial periods as the hydrology, climate, and vegetation in these areas has varied during glacial-interglacial cycles. It is also not reasonable to assume that the initial post-glacial drainage density was zero – meltwater streams carried liquid water away from the ice front throughout all the glacial episodes, and proglacial stream valleys formed or persisted during retreat, providing a finite initial drainage density that is not recoverable from our data. Our observation of a decreasing rate of drainage density expansion over time in the CL is consistent with observations over much shorter timescales in smaller, steeper and unvegetated landscapes (Major et al., 2019; Morisawa, 1964; Schumm, 1956). The timescale over which drainage growth decreases in the CL, however, appears to be on the order of millennia, orders of magnitude longer than those observed in Perth Amboy (Schumm, 1956) and Mt. St. Helens (Major et al., 2019). We propose that the time variability in the rate of drainage network expansion provides some constraint on the mechanisms of drainage development in the CL.
The dominant paradigm for channel network expansion is that of channel head retreat, or ‘bottom-up’ processes (Hilgendorf et al., 2020). In this model, channels extend incrementally at their upstream ends as a steep channel head progressively erodes. The expansion of channels by this mechanism is observed broadly: for example, the retreat of gully headcuts is the main mechanism of gully expansion (Vanmaercke et al., 2016). In steeper landscapes, channel head retreat drives expansion of the channel network in response to base-level fall. The threshold product of slope and discharge needed to drive fluvial incision (Montgomery & Dietrich, 1989) can be achieved for relatively small values of discharge because steep slopes and relatively low resistance to erosion can compensate. In the CL, in contrast, the generally low slopes and reasonable assumption of vegetation cover over the timescales of expansion we observe in this study (Holocene) likely result in small concentrations of water that are unlikely to facilitate channel head retreat individually. For example, numerical landscape evolution models of drainage network evolution in the CL driven by simple, steepest-descent flow routing imply timescales for fluvial network expansion orders of magnitude longer than those we observe (Cullen et al., 2022; Lai & Anders, 2018). We suggest that, in the CL, drainage network expansion is also driven by the concentration of water in closed depressions on the landscape rather than solely dependent on the gravitational energy of steep slopes. This can subsequently lead to the integration of channels developed within closed basins, if those basins are accessed by expansion. We propose that the long timescale for evolution of drainage density in the CL reflects the processes by which discharge concentration occurs: in particular, we propose that the slower evolution of CL drainage networks relative to steep landscapes is due to the intermittent exceedance of water volume thresholds required to concentrate discharge.
In low-relief post-glacial landscapes discharge concentration does not operate in the same manner as in areas with steeper and more connected slopes. Regional slopes in the CL are low and appear to vary with little relationship to river networks due to glacial landforms or glacial isostatic rebound. Much of the landscape is characterized by internally drained basins and closed depressions that exist at a range of spatial scales from meters to hundreds of kilometers. While groundwater sapping can drive channel formation in some portions of the CL (e.g., Sockness & Gran, 2022), groundwater routing is not necessarily driven by the subtle surface topography in the CL (Cullen et al., 2022) and thus cannot be predicted with surficial topography. Furthermore, the glacial stratigraphy of the CL is variable and complex, and frequently includes high conductivity materials in thin layers (e.g., Anders et al., 2018). These characteristics of CL morphology and hydrology need to be considered as controls on drainage network expansion.
Previous numerical models of landscape evolution in the CL have explored two different mechanisms by which discharge is concentrated in these landscapes: 1) closed depressions filling with water and/or sediment to spillover (perhaps intermittently), also called ‘fill and spill’ (Lai & Anders, 2018), and 2) focused emergence of groundwater from beyond surface catchment boundaries, also called ‘seep discharge’ (Cullen et al., 2022). In both cases, more rapid expansion of the channel network in the low-relief CL is observed using these mechanisms than in the simple, steepest-descent case. Our results are most consistent with discharge concentration by connection of closed depressions being the primary driver of drainage network integration and expansion in the CL based on the lack of physical markers of seep discharge and the apparently low initial connectivity of drainage in our landforms. Our conceptual model network expansion in the CL builds on the presence of closed depressions in post-glacial landscapes. We propose that connection of closed depressions to external drainage networks was possibly intermittent, occurring following heavy rain or melting of thick snowpack, or as the result of spillover of a lake or wetland out of the depression boundaries. Channels connected to closed depressions receive increased discharge during periods of connection, which allows for incision of the channel and, potentially, propagation of a channel head through the spillway, thereby capturing the depression. This is in line with DiBiase and Whipple’s (2011) finding that discharge variability, perhaps accomplished by occasional over-topping of these closed depressions, enhances erosion rates.
The observed increase in PDD and corresponding decrease in NCA fraction with surface age (fig. 5) is consistent with a progressive mechanism of drainage expansion that converts NCA into contributing area when topographic divides preventing connectivity are overcome, either through erosion of the divide following a spillover event, or sedimentation within the depression to the spill point. In this way, a large area of NCA may be incorporated with the formation of only a short channel. In the CL, where the hummocky post-glacial topography is initially profoundly disconnected, the integration of NCA into externally-draining river systems may be the limiting step in drainage network expansion. The timescale of integration may indicate that the threshold surface water volume needed to achieve hydrologic connectivity is only intermittently surpassed, and thus periods of channel erosion are episodic. Looking beyond the CL, “top-down” integration of channel networks, such as lake overflow, is increasingly recognized as a driver of river network evolution and drainage reorganization (Hilgendorf et al., 2020).
The hypothesis that discharge concentrated in the subsurface is a dominant mechanism of channelization in the CL is not supported by the results of our soil texture analysis, though the analysis itself is crude. Greater sand fractions will likely favor increased infiltration, decrease the probability of overland flow, and increase the fraction of discharge derived from groundwater. Therefore, we would expect to observe higher PDD in sandier regions if subsurface water routing was the dominant mechanism of discharge concentration. However, we find a negative correlation between PDD and sand fraction, which is consistent with the greater permeability of sand inhibiting overland flow. This suggests either that subsurface discharge is not a significant contributor to drainage network expansion, or that there is a limit to the quantity and depth of sand concentration that we do not capture. This negative correlation may also suggest that sandiness, or infiltration rate, is an important determining factor in the steady value of PDD. Our regional analysis does not capture the details of subsurface stratigraphy, and we acknowledge that groundwater may be a primary driver of channel expansion in some areas. Where this is the case, we expect channel network geometries to express signatures of the influence of groundwater observed in landscapes (de Vries & Simmers, 2002), physical models (Sockness & Gran, 2022) and numerical models (Cullen et al., 2022), such as characteristic branching angles for channels and amphitheater-shaped headwalls. Beyond the integration of closed depressions into externally draining river networks we also propose that other glacial landforms may be repurposed by growing river networks, allowing for more rapid expansion than would otherwise be possible. For example, subglacial features such as tunnel valleys, which typically start and stop abruptly (e.g., Moores, 1989) are not necessarily channelized immediately following glaciation, yet their morphology is easily exploited by a growing river channel. Once connected, tunnel valleys could provide kilometers of channel length without much further work on the part of the fluvial network. Other unchanneled valley forms and organized topographic roughness such as ridged drift and drumlin fields could similarly be co-opted by post-glacial streams.
Future field studies and numerical and physical experiments could expand our understanding of the processes of drainage network expansion in the CL and further constrain the rates of that expansion. Specifically, we propose that study of the relationships between former glacial lake beds and channels including dating of lake capture events, documentation of valley change resulting from capture, and assessment of stream long profiles could provide additional evidence as to the importance and timing of glacial lake drainage events as drivers of drainage network expansion. We document continued expansion of channel networks throughout the Holocene and if this expansion was driven by fill-and-spill of closed depressions we expect that spillover events continued for thousands of years following deglaciation. Another target of future research is a more complete understanding of the extent of inheritance of river channels present during glaciation that could be local nucleation points for drainage initiation and expansion. Our observation of progressive increase in drainage density with age indicates that the entire channel network was not inherited. However, a more detailed investigation could reveal that more of the landscape is inherited – or incorporated – than we assume. If inherited channels are derived from sub-glacial water flow, we might expect valley geometries to approximate those of tunnel valleys with steep valley walls and valley floor gradients in opposing orientation to modern river gradients, or channel length-width relationships that do not match expected downstream increases (e.g., Livingstone & Clark, 2016). Alternatively, if inherited channels are meltwater derived, we expect the valleys to be too large for modern rivers (‘overfit’).
We observe that while the rate of change in drainage density in the CL appears to slow significantly after 120ka, the fluvial networks in the CL do not resemble those in landscapes unaffected by glaciation. Streams not uniformly graded to base-level and hillslopes within areas of slowly changing drainage density that are poorly connected to valleys have been observed across the region (e.g., Meghani, 2023). Tens to hundreds of meters of glacial sediment blanket portions of the CL and these are not excavated during interglacial episodes but accumulate through successive periods of glaciation (Anders et al., 2018). Our results suggest that near maximum drainage density was likely recovered during each interglacial episode since the mid-Pleistocene transition to ~100,000-year glacial cycles without complete evacuation of glacial sediment. We propose that expansion of drainage density is a relatively early phase in the transition from landscapes of continental glaciation to those of lowland rivers, and that the time scale in which an ‘adjusted’ fluvial network would develop is much longer. Future studies may address other aspects of fluvial landscape development using the chronosequence of the CL.
Finally, we point out that the correlation between PDD and NCA not only supports the hypothesis that connection of closed depressions drives drainage network expansion in the CL, but also suggests an alternative metric of assessing landscape maturity in this region that is less influenced by anthropogenic alterations of the land surface than drainage density. Reconstruction of the pre-agriculture stream network using the NHD, while broadly reasonable, is certainly imperfect. The direct human alterations to rivers in this region make detailed reconstruction of pre-settlement channels extremely difficult. In contrast, NCA mapping relies on surface topography and soils – features which are typically less directly altered by humans than the channels themselves. Topography and soils both respond to agriculture on slow timescales and likely retain a memory of the pre-settlement conditions with more fidelity than channels.
6. Conclusions
Through reconstruction of pre-agricultural partial drainage density in the CL we demonstrate that drainage density increases in two phases following deglaciation, first expanding rapidly and reaching a near steady value within ~120 ka, then continuing to increase but at a much slower rate. This is the first quantification of drainage network expansion at a regional scale for a low relief landscape. The timescale for network development revealed is both longer than that seen in areas with steeper slopes and shorter than would be predicted if surface water routing occurred only down paths of steepest descent. We suggest that the hydrologic connection of closed depressions on the surface drove channel network expansion in the CL. Intermittent connections between closed depressions and existing channels provided sufficient discharge to drive incision and expansion beyond what would be expected based on flow-routing without filling topography. The lower rate of drainage expansion in the CL relative to steeper landscapes likely reflects the thresholds needed to connect closed depressions and generate enough discharge to overcome the generally low slopes. We also note that recovery of drainage density is relatively rapid compared to other aspects of fluvial landscape form including long profiles, main stem valley cross sections and evacuation of glacial sediment. We propose that drainage density is a metric of fluvial development that is recovered relatively rapidly, in general, and that the timescale of drainage density recovery reflects the ease of exceeding a threshold of landscape connectivity in a particular landscape and climate.
AUTHOR CONTRIBUTIONS
N.M. and A.A. conceived of the presented idea. N.M. designed and performed most of the analyses. A.A. performed some analyses and supervised the study. N.M. and A.A. discussed the results and wrote the final manuscript.
ACKNOWLEDGMENTS
The authors would like to thank colleagues Karen B. Gran, Peter Moore, Bradley Miller, Joshua McDanel, and Brian Sockness, for stimulating conversation and feedback as this work was completed. The authors are also grateful to Mark Brandon, Frank Pazzaglia, and one anonymous reviewer for their insightful comments, suggestions, and feedback.
CONFLICTS OF INTEREST
The authors declare no conflicts of interest.
DATA AND SUPPLEMENTARY INFORMATION
Data and code used to analyze data are available at https://doi.org/10.5281/zenodo.13945146
Editor: Mark Brandon