

b__cp57(4)b__cp55(2)a__and_cp55(3)a.tiff)
1. INTRODUCTION
One of the greatest geologic wonders of the world, Grand Canyon, is a source of great debate within the geoscience community. Much has been learned about the history of Grand Canyon since John Wesley Powell’s famous expedition in 1869 (Polyak et al., 2008) but important issues regarding canyon incision remain controversial. The age of the canyon has been debated for over a century but in recent years much of the attention and controversy has come from the interpretation of low-temperature thermochronology (e.g., Flowers et al., 2008; Flowers & Farley, 2012; K. E. Karlstrom et al., 2017, 2022; Lee et al., 2013; Winn et al., 2017). Although more and more nuance is being seen in the discussion on the age of canyon incision, two end-member models frame the debate: one suggesting a “young” canyon formed since about 6 Ma (e.g., Longwell, 1946; Spencer et al., 2001; Winn et al., 2017) and the other suggesting an “old” canyon formed before 55 Ma (e.g., Flowers et al., 2008; Flowers & Farley, 2012; Wernicke, 2011). The young-canyon model is primarily based on the first appearance of Colorado River sediments overlying the 6 Ma Hualapai Limestone in the Grand Wash Trough, where the Colorado River currently exits the Colorado Plateau (Faulds et al., 2001; Flowers et al., 2008; Longwell, 1946; Lucchitta, 1979; Spencer et al., 2001). In contrast, the old-canyon model is primarily based on temperature-time histories of rock within and nearby the canyon interpreted from apatite (U-Th)/He thermochronology (AHe) and fission-track thermochronology (AFT).
Apatite (U-Th)/He (AHe) thermochronology supports a substantial cooling event at 80–70 Ma with carving of most of the western Grand Canyon by ~70 Ma (Flowers & Farley, 2012) and a km-scale paleocanyon by 55 Ma for the eastern Grand Canyon (Flowers et al., 2008). However, interpretation of AHe and apatite fission track (AFT) data from Lee et al. (2013) and Winn et al. (2017) suggests that the central and eastern Grand Canyon were areas of low relief during the early to middle Cenozoic (Lee et al., 2013) and that the western Grand Canyon cooled to modern surface temperatures after 10 Ma, consistent with incision during the Miocene or afterwards (Winn et al., 2017). Other models integrate aspects of both the young and old canyon models by proposing that a paleocanyon existed 70–55 Ma but Grand Canyon as we see it today formed in the past 6–5 Ma (Hill & Ranney, 2008; K. E. Karlstrom et al., 2014, 2017). Moreover, Fox and Shuster (2014), Fox et al. (2017) and Winn et al. (2017) have shown that the “old canyon” AHE data can be reconciled with the “young canyon” interpretation, based on the uniform U and Th distributions observed within the crystals, and uncertainties in the burial histories, Thurston et al. (2022) apply zircon (U-Th)/He (ZHe) thermochronology to determine the Precambrian thermal history of Grand Canyon, but these results yield internally-inconsistent results for the Mesozoic-Cenozoic cooling history. Ryb et al. (2021) report carbonate clumped isotope results that are consistent with an old canyon model.
Fluid inclusions are small volumes of paleofluids trapped in minerals during growth or fracture of a crystal. The fluids may be liquid, vapor, or supercritical, and are classified as primary when they are trapped during crystal growth, secondary when they are trapped within crystal fractures, and pseudo-secondary when they are trapped during fracturing during crystal growth (Bodnar, 2003; Goldstein, 2001; Randive et al., 2014). These paleofluids can provide critical information about processes including temperatures and pressures associated with different stages of rock evolution (Roedder, 1984; Van den Kerkhof & Hein, 2001). Microthermometry is used to study the temperature of entrapment and compositions of fluid inclusions. To observe changes in phase with temperature, a heating and cooling stage is attached to a microscope. At room temperature, fluid inclusions can be observed as a multi-phase system that may homogenize to one phase at a higher temperature. The homogenization temperature (Th) indicates the minimum temperature of fluid entrapment (Randive et al., 2014). Freezing of a two-phase (liquid and gas) fluid inclusion and the temperature at which it melts after freezing can determine the composition of the liquid phase (Randive et al., 2014). If the Th and composition of a fluid inclusion is known, corrections can be made to determine the true temperature of entrapment (Chi et al., 2020; Goldstein, 2001).
In our study, we analyzed the microthermometry of secondary fluid inclusions in carbonate rocks from Grand Canyon and compared these temperatures to published time-temperature histories from rocks in this region. This allowed us to determine the approximate time of fluid inclusion formation and gave us insight into the amount of overburden and exhumation from Grand Canyon and the adjacent Colorado Plateau. The objectives of our study were to determine: (i) when the fluid inclusions in our samples formed; (ii) the amount of overburden that has been removed from Grand Canyon and the adjacent Plateau since these fluid inclusions formed; and (iii) if these data align with a “young” or “old” canyon model for Grand Canyon formation. Our data suggest that these fluid inclusions formed predominately during the late Cretaceous, which we suggest is in agreement with the “old” Canyon model.
2. METHODS
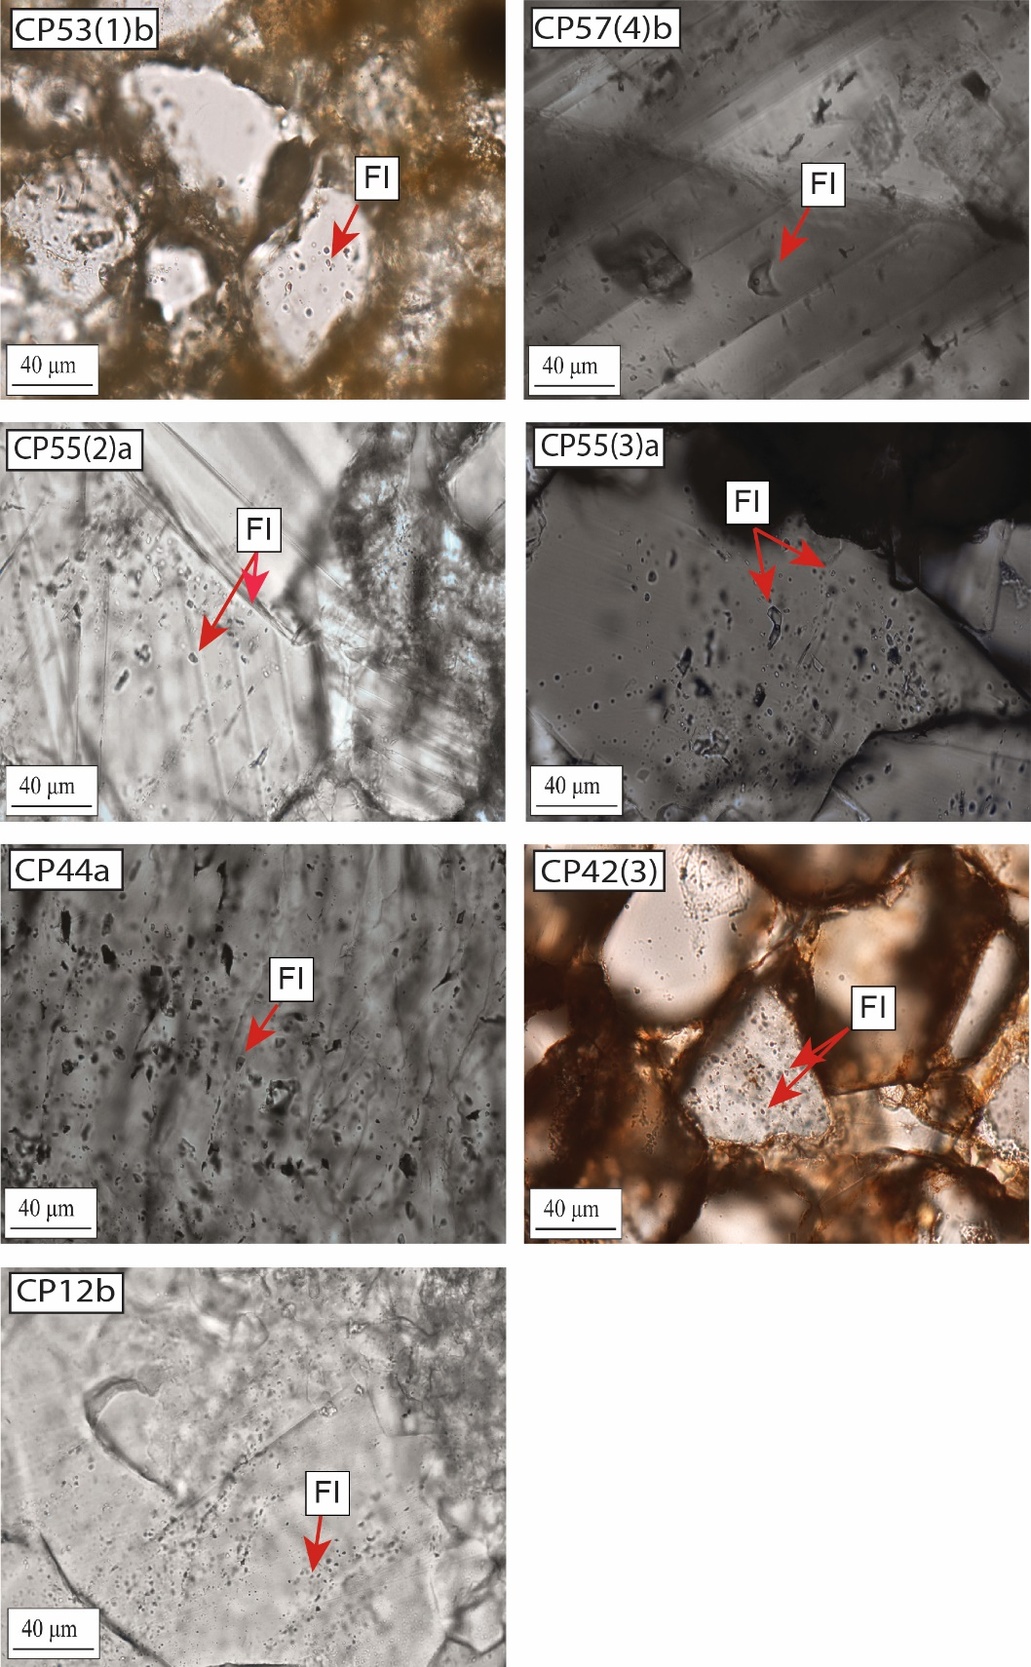
Samples were collected from outcrops within Grand Canyon (table 1). Sample CP12b was collected from a calcite vein in the Cambrian Muav Limestone. Three samples were collected from the Mississippian Redwall Limestone; two cement samples CP42(3) and CP44a, and one druse sample CP57(4)b. Samples CP55(2)a, and CP55(3)a are cements collected from the Pennsylvanian-Permian Supai Group. Sample CP53(1)b is druse collected from the Permian Kaibab Limestone. All samples were collected from the Eastern Canyon section of Grand Canyon except sample CP12b, which was collected at the westernmost edge of the canyon, near South Cove, where the Colorado River empties into Lake Meade (fig. 1). Figure 2 shows the fluid inclusion textures as well as the carbonate textures. Note that three samples are twinned indicating weak deformation. Additional information on the minerology, texture, and field descriptions for samples is given in table S1 in the Supplementary Material.

Doubly polished, 100-µm-thick sections were prepared for all samples. These sections were analyzed using a Nikon Eclipse LV100POL petrographic microscope to determine the presence and type of fluid inclusions in the sample. Fluid inclusions and their relationship to the grains and microfractures were mapped to determine if the inclusions were primary, secondary, or pseudosecondary as well as to determine fluid inclusion assemblages of petrographically similar groups of fluid inclusions, following Bodnar (2003), Randive et al. (2014), Roedder (1984), and Van den Kerkhof and Hein (2001). For this study, only Th from secondary fluid inclusions were used in our analysis. Although some measurements were made on primary inclusions in the samples, those measurements were unreliable due to stretching during analysis.
The 100-µm sections were removed from the glass slides by dissolving the glue in acetone. Once removed, the 100-μm sections were cut into smaller chips based on the location of fluid inclusions revealed by the initial inspection. Because calcite stretches when heated (Prezbindowski & Larese, 1987; Ujiie et al., 2008) sections were cut into chips to isolate individual inclusions or fluid inclusion assemblages. This guarantees that inclusions were not altered by the heating and cooling of other inclusions in the sample.
Chips containing the secondary, two-phase fluid inclusions were analyzed using a FLUIDS Inc. heating and cooling stage mounted to a Nikon Optiphot microscope with a 40x objective. The equipment was calibrated by using a synthetic quartz sample with fluid inclusions of known Th provided by FLUIDS Inc. Once the system was calibrated, individual chips were placed onto the heating and cooling stage with a E-type thermocouple attached. Liquid nitrogen was pumped over the sample to remove any excess moisture before heating at 5–7 °C/min until the vapor bubble within the liquid began to move, followed by an increase of 1–3 °C/min until Th was reached. This process was repeated once for each fluid inclusion tested.
Homogenization temperatures were measured prior to testing for the melting temperature (Tm) of an inclusion to avoid stretching of inclusions by ice nucleation (Mangenot et al., 2017) and heating runs were only completed once on each individual chip. The Tm was obtained by first cooling the sample until it was frozen and then slowly heating the sample until the ice melted.
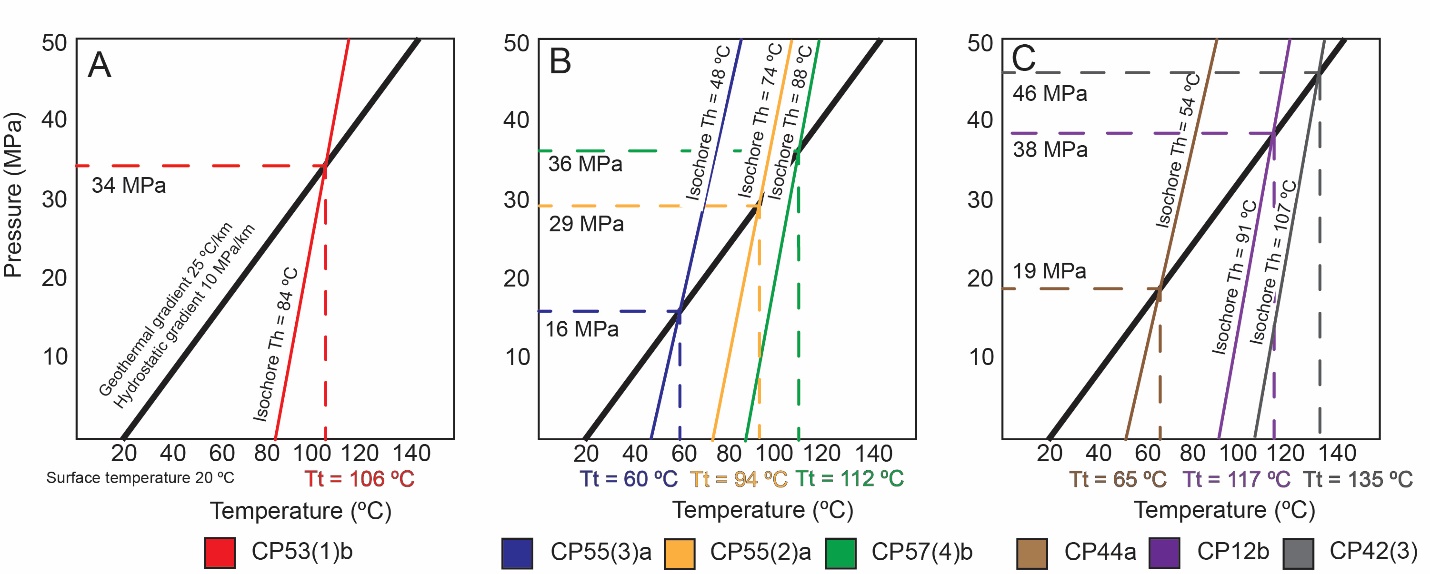
Isochores for all samples were made using the AqSo-NaCl Software Package (Bakker, 2018) by inputting the composition of the fluids, obtained from the Tm, and the Th. We also ran sensitivity tests using different salinities with pure or meteoric fluids and marine brines (~3.2 wt NaCl). The addition of brine increased the calculated temperature by ~1 oC, which is below the analytical uncertainty of our measurements. Once isochores were plotted for each sample, entrapment temperatures (Tt) were determined by assuming a geothermal gradient of 25 ºC/km, a pressure gradient of 10 MPa/km, and a surface temperature of 20 ºC. The point at which the isochores intersect with the geothermal and geopressure gradient gives us the corrected entrapment temperature and pressure (Goldstein, 2001; Mangenot et al., 2017).
The geothermal gradient of 25 oC/km is based on specific calculations of the Grand Canyon middle Cenozoic thermal gradient by Lee et al. (2013) and Wernicke (2011), and consistent with interpretations by Fitzgerald et al. (1991), Flowers et al. (2008), Flowers and Farley (2012) and Reiners et al. (2000). A surface temperature of 20 ºC is consistent with thermal models from Flowers et al. (2008) and K. E. Karlstrom et al. (2014).
The assumption of a 10MPa/km (hydrostatic) pressure gradient at the time of fluid inclusion trapping is based on the nature of the enclosing sediments. In general, uncertainties about the fluid pressure regime can contribute to significant uncertainties in the interpreted fluid pressure, and hence depth, of the intersections of the Th isochores and the geothermal gradients shown in figure 3 (e.g., Chi et al., 2020). The highly porous and permeable nature of the enclosing sediments in this study shows they are not regionally well-sealed, and thus do not meet one of the basic requirements of over- and under-pressured systems (Osborne & Swarbrick, 1997). This high-porosity-high-permeability nature of the enclosing sediments in particular precludes the possibility of overpressures related to the most common form of overpressure generation, disequilibrium compaction (e.g., Osborne & Swarbrick, 1997).

Fluid-inclusion closure in general is a function of pressure or stress, temperature, and fluid composition, the details of which are discussed in detail elsewhere (e.g., Fall & Bodnar, 2018; Roedder, 1984), and are beyond the scope of this paper. Fluid inclusions record the physical and chemical conditions at the time of closure assuming “Roeder’s Rules” (after e.g., Fall & Bodnar, 2018; Roedder, 1984):
1) The fluid inclusion initially traps a single, homogeneous phase.
2) The fluid inclusion volume remains constant after trapping
3) Nothing is lost from, or added to, the fluid inclusion after closure.
These assumptions imply that the fluid inclusions were trapped within a relatively short period of geologic time, during which the pressure-temperature conditions remained constant (Fall & Bodnar, 2018). The fluid-inclusion homogenization temperatures in this study are assumed to meet these criteria, although the small numbers of inclusions preclude confirmation that they represent the narrow range of homogenization temperatures that is usually considered validation of the above assumptions (Fall & Bodnar, 2018).
3. RESULTS
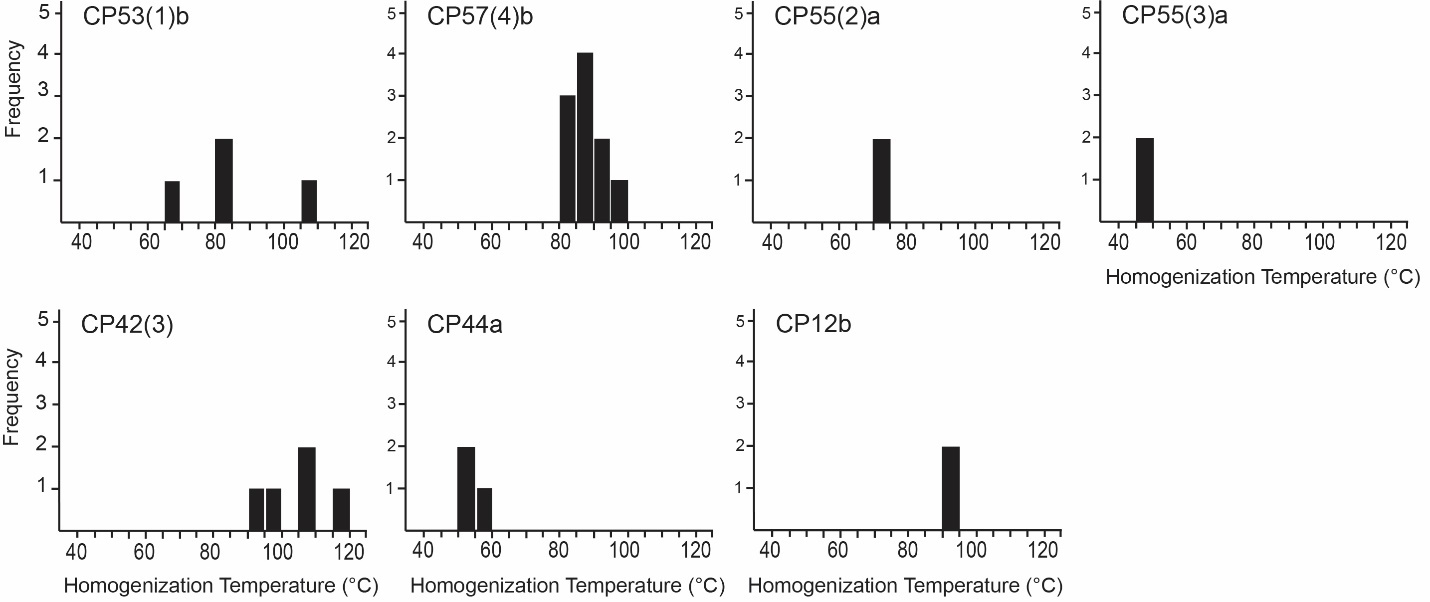
Microthermometric data from secondary two-phase fluid inclusion measurements are summarized in table 1. The general paucity of fluid inclusions, stretching of calcite, minute size, and lack of transparency of the inclusions all limited the number of measurements we could make in these samples. Thus, compared to some fluid inclusion studies which document hundreds of inclusions per sample, we measured all possible fluid inclusions, many of which belonged to similar fluid inclusion assemblages (see Item S2 in the Supplementary Material). Homogenization temperatures ranged from 47 °C – 107 °C. Individual samples had 2–10 inclusions measured with a total of 27 Th values determined. Homogenization temperatures by sample are shown in figure 4. Average temperatures are reported with analytical uncertainty of 5 °C or the standard deviation (1σ) of all the measured Th from inclusions within a sample, whichever is greater. Sample CP57(4)b was the only sample with fluid inclusions large enough to observe Tm (fig. 2). Four fluid inclusions from CP57(4)b were measured with an average Tm of 0.1 ºC, suggesting the composition of the fluids is pure water. Based on this sample, we assumed an average Tm of 0.1 ºC and composition of pure water for the fluid inclusions for the rest of our samples.

3.1. Isochore Adjustments
Based on the isochore plots, adjustments were made to determine the pressure of entrapment and the temperature of entrapment. The Tt and pressure of entrapment of fluid inclusions is shown in figure 3. Pressure of entrapment ranged from 16 to 46 MPa and Tt ranged from 60 to 135 ºC. Using a surface temperature of 20 ºC, a geothermal gradient of 25 ºC/km for this area (K. E. Karlstrom et al., 2014; Wernicke, 2011; Winn et al., 2017), and the entrapment temperature, we calculated the apparent overburden on our samples at the time of fluid inclusion formation. Because our samples come from different stratigraphic units, we normalized the overburden for our samples relative to the Kaibab Limestone to aid in understanding the amount of overburden removed relative to a specific stratigraphic layer, as opposed to discussing overburden relative to the stratigraphic layers where samples were collected. To normalize to the Kaibab Limestone, we measured the difference between the sample elevation and the elevation of the Kaibab Limestone and then adjusted for that difference assuming a geothermal gradient of 25 ºC/km. The amount of overburden above the Kaibab Limestone ranged from 1.1 to 3.6 km and is shown in table 1.
3.2. Assigning Time to Fluid Inclusion Data
Grand Canyon has been the site of several thermochronology studies using AFT (Lee et al., 2013; Winn et al., 2017), AHe (Flowers et al., 2008; Flowers & Farley, 2012; Fox et al., 2017; K. E. Karlstrom et al., 2017; Lee et al., 2013; Winn et al., 2017), and ZHe (Thurston et al., 2022) thermochronology to better understand the geomorphic history of the canyon. Our fluid-inclusion samples come from locations in the same region as sampling sites for some of these studies (fig. 1). Assuming our fluid inclusions were in thermal equilibrium with surrounding rocks, the Tt from fluid inclusions in this study were compared to time-temperature (T-time) plots from thermochronologic samples closest to our samples. From this we can estimate the timing of fluid entrapment in our samples. Figures 5 and 6 show the Tt from secondary fluid inclusions within samples plotted on T-time histories of samples from Flowers and Farley (2012), Fox and Shuster (2014), K. E. Karlstrom et al. (2017), Lee et al. (2013), and Winn et al. (2017) after stratigraphic adjustments were made to account for the difference in elevation or stratigraphy between the compared samples. Stratigraphic adjustments were made assuming a geothermal gradient of 25 ºC/km for this area (K. E. Karlstrom et al., 2014; Wernicke, 2011; Winn et al., 2017). The details of how each T-time history was adjusted before comparing it to the Tt from samples in this study are explained below. The distance between compared samples is given in Item S1 in the Supplementary Material. Because the Paleozoic strata lie nearly flat (dip 0.4º NE reported in Flowers et al., 2008 and Wernicke, 2011), we modified the T-time with reference to modern elevation (i.e., the difference in elevation between the compared samples) before determining the age of entrapment for fluid inclusions from CP53(1)b, CP57(4)b, CP55(2)a, CP55(3)a, CP42(3), and CP44a. Because there are significant faults between our sample CP12b and the associated thermochronologic samples, we used the stratigraphic datum from the Great Unconformity to make this correction.
For samples CP53(1)b, CP57(4)b, CP55(2)a, CP55(3)a, CP42(3), and CP12b, where more than one T-time comparison was made, we calculated the weighted mean of the apparent time of fluid entrapment for each sample.
CP53(1)b. — For sample CP53(1)b, we compared the average Tt of 106 ± 16 ºC (n=4) to the T-time history of sample CP05-7 of K. E. Karlstrom et al. (2017). Because CP05-7 is located at an elevation 475 m below CP53(1)b, we adjusted the T-time history of CP05-7 by raising the graphed thermal history 12 ºC prior to being compared to Tt data. This comparison suggests a fluid entrapment age of 70 ± 30 Ma (fig. 5A).
CP53(1)b was also compared to the T-time histories of Lee et al. (2013) samples GC103 and GC11 (fig. 5B). GC11 and GC103 were located at an elevation ~1350 m below sample CP53(1)b so the modeled T-time histories from these samples were adjusted by raising the graphed thermal histories ~33 ºC to compare the Tt from sample CP53(1)b to these T-time histories. The comparisons to the two Lee et al. (2013) samples resulted in an age of 69 ± 10 Ma. Based on all CP53(1)b comparisons, the weighted mean age of fluid entrapment from fluid inclusions in CP53(1)b was 69 ± 9 Ma.
b__cp57(4)b__cp55(2)a__and_cp55(3)a.tiff)
CP57(4)b. — We measured ten inclusions from CP57(4)b with an average Th of 88 ± 5 ºC and a Tt of 112 ± 5 ºC. CP57(4)b was compared to the T-time histories of sample CP05-7 from K. E. Karlstrom et al. (2017) and Lee et al. (2013) samples GC103 and GC11 (fig. 5C and D). Because of the similar elevation between CP57(4)b and CP05-7, we did not adjust the T-time history of sample CP05-7 before comparing it to the Tt of fluid inclusions from CP57(4)b. The age of fluid entrapment from this comparison was 69 ± 31 Ma. GC103 was located at an elevation 777 m below CP57(4)b. Due to this difference in elevation, we adjusted the T-time history of GC103 by raising the graphed thermal history 19 ºC before being compared to the Tt for CP57(4)b. GC11 was located at an elevation 830 m below sample CP57(4)b. We raised the graphed T-time history of GC11 21 ºC to account for the difference in elevation before comparing to the Tt from CP57(4)b. The age from comparing the Tt of fluid inclusions in CP57(4)b to GC11 and GC103 was 68 ± 11 Ma. The weighted mean of ages for all CP57(4)b comparisons was 68 ± 10 Ma.
CP55(2)a & CP55(3)a. — We measured two fluid inclusions from CP55(2)a with an average Th of 74 ± 5 ºC and a Tt of 94 ± 5 ºC. CP55(3)a also had two fluid inclusions measured with an average Th of 48 ± 5ºC and a Tt of 60 ± 5 ºC. CP55(2)a and CP55(3)a were collected from the same outcrop, and thus have the same elevation. The adjustments made to the T-time histories of compared samples (Eastern Grand Canyon, Flowers & Farley, 2012; GC103 and GC11, Lee et al., 2013) are the same for CP55(2)a and CP55(3)a. CP55 samples were compared to the T-time histories of Flowers and Farley (2012) Eastern Grand Canyon samples (fig. 5E and G), which is a combination of data from four samples, CP06-52, CP06-57, UG99, and UG99. The difference in elevation between the CP55 samples and the average Eastern Grand Canyon samples from Flowers and Farley (2012) was 1000 m. Because of this difference in elevation, we raised the graphed T-time history from Flowers and Farley (2012) 25 ºC before comparing to the Tt from CP55 samples. CP55 samples were also compared to Lee et al. (2013) samples GC103 and GC11 (fig. 5F and H). GC103 was located 870 m below CP55 samples, so we adjusted the T-time history from GC103 by raising the graphed thermal history 22 ºC before comparing to the Tt from CP55 samples. GC11 was also at a lower elevation with a difference in elevation of 926 m between the CP55 samples and GC11. The graphed T-time history from GC11 was raised 23 ºC to account for the difference in elevation before comparing the Tt from CP55 samples.
Although CP55(2)a and CP55(3)a were collected from the same outcrop, the Th and Tt between the samples varied, resulting in different ages of entrapment. When the Tt of CP55(2)a was compared to the T-time history from Flowers and Farley (2012), the age of entrapment was 77 ± 12 Ma and when compared to the T-time histories of GC103 and GC11, the age of entrapment was 67 ± 12 Ma. The weighted mean for the age of entrapment based on comparisons for sample CP55(2)a is 72 ± 8 Ma. Comparisons for CP55(3)a resulted in slightly younger ages of entrapment, with an age of 70 ± 11 Ma when compared to Flowers and Farley (2012) data and 47 ± 25 when compared to GC103 and GC11. The weighted mean for the age of entrapment of CP55(3)a inclusions was 66 ± 10 Ma.
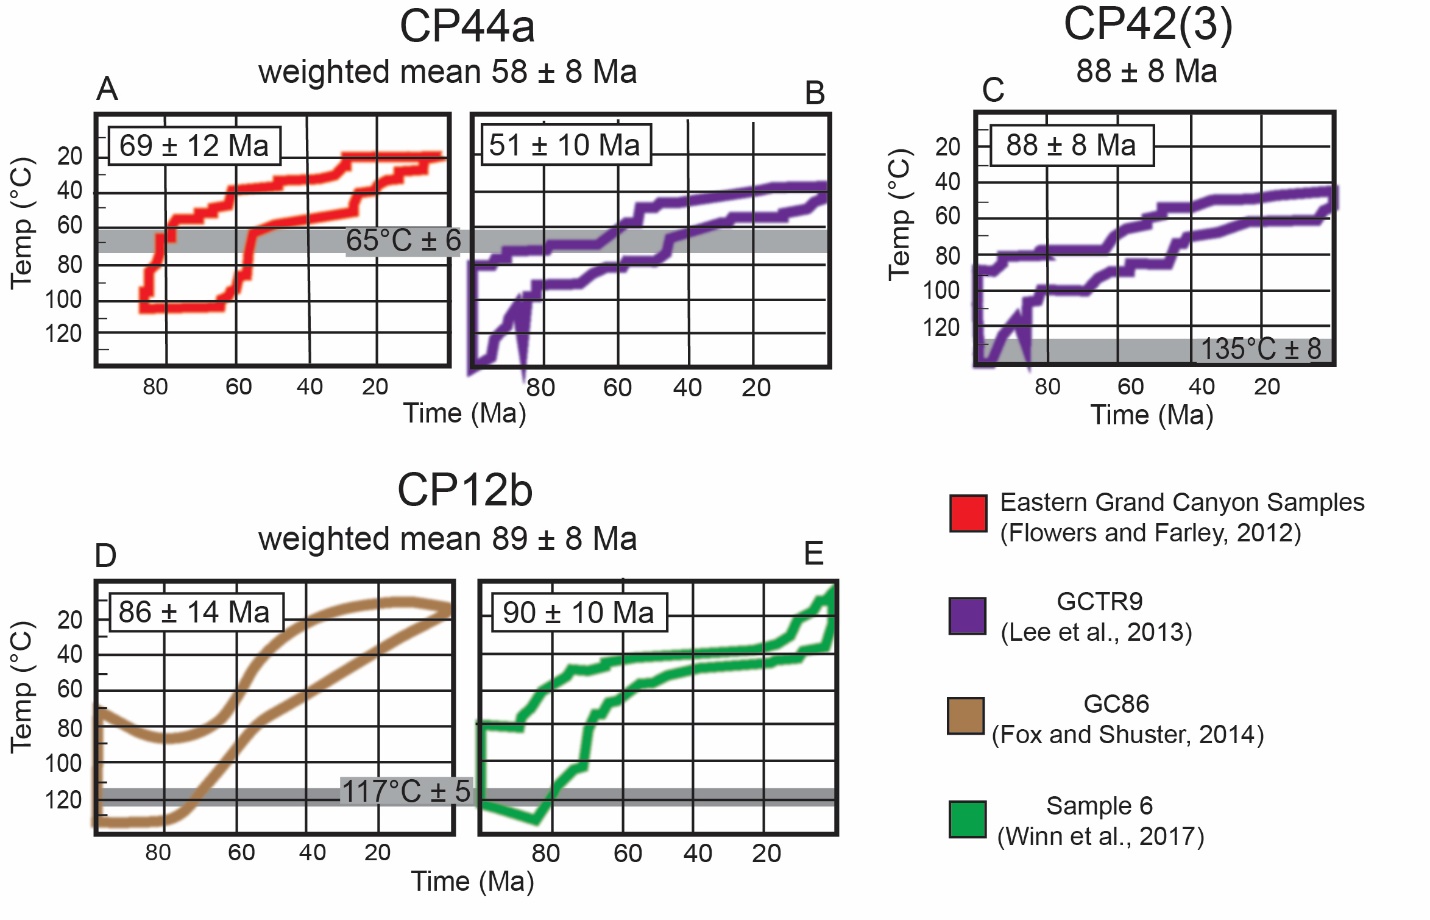
CP44a. — We measured three inclusions from CP44a with an average Th of 54 ± 6 ºC and a Tt of 65 ± 6 ºC. CP44a was compared to the thermal histories from the four Eastern Grand Canyon samples from Flowers and Farley (2012) and to GCTR9 from Lee et al. (2013) (fig. 6A and B). CP44a was at an elevation 637 m above the average elevation for the Eastern Grand Canyon samples. To account for this difference in elevation, we raised the graphed T-time histories from Flowers and Farley (2012) 16 ºC before comparing the Tt of CP44a. The age of entrapment based on this comparison was 69 ± 12 Ma. GCTR9 was located at an elevation 829 m higher than where CP44a was collected. Because of the difference in elevation, with GCTR9 being located higher in elevation, we lowered the graphed T-time history of GCTR9 21 ºC before the age of fluid entrapment was determined. Comparing CP44a fluid inclusion Tt to the adjusted T-time history of GCTR9 gave an age of entrapment of 51 ± 10 Ma. The weighted mean of the age of fluid entrapment based on the comparisons from Flowers and Farley (2012) and GCTR9 for CP44a comparisons was 58 ± 8 Ma.
__and_cp12b._cp44a_compared_.jpeg)
CP42(3). — CP42(3) had the highest average Th from all samples, with an average Th of 107 ± 8 ºC from the five inclusions we measured, and a Tt of 135 ± 8 ºC. Because of this high temperature and needing to modify T-time histories because of differences in elevation, only one comparison was possible. CP42(3) was compared to the T-time history from sample GCTR9 shown in figure 6C. GCTR9 was located at an elevation 1 km above where CP42(3) was collected. To account for this difference in elevation, we lowered the graphed T-time history of GCTR9 25 ºC before comparing to the Tt of CP42(3). The age of fluid entrapment based on this comparison was 88 ± 8 Ma.
CP12b. — CP12b is located on Wheeler Ridge, one of seven ridge-forming normal fault blocks, located west of the Grand Wash Fault and east of the South Virgin Mountains (Brady et al., 2000; Wernicke, 2011). The strata of Wheeler Ridge are down thrown several kms relative to the Colorado Plateau and folded into a roll-over anticline (Brady et al., 2000). However, Wheeler Ridge was concordant with the Colorado Plateau until basement uplift and tilting during the Miocene (Ryb et al., 2021; Wernicke, 2011) and therefore shares a similar thermal history with rocks from the Grand Canyon (Ryb et al., 2021).
Because CP12b is separated from Grand Canyon by the Grand Wash Fault and located on the folded Wheeler Ridge, we used a stratigraphic approach for CP12b comparisons, instead of the topographic approach used for the other samples. To do this, we determined the approximate stratigraphic thickness: (i) separating CP12b (collected from the base of the Muav) from the Great Unconformity by measuring the thickness of Cambrian strata above the Great Unconformity but below the Mauv Limestone (Flowers et al., 2008, p. 573); (ii) between Sample 6 from Winn et al. (2017) and the Great Unconformity by using Google Earth Pro; and (iii) between GC86 from Fox and Shuster (2014) and the Great Unconformity by measuring the stratigraphic thickness between GC86 and the Great Unconformity using Lee et al. (2013, p. 223).
We measured two inclusions from CP12b with an average Th of 91 ± 5 ºC, and a Tt of 117 ± 5 ºC. CP12b was compared to the T-time histories of samples GC86 from Fox and Shuster (2014) and Sample 6 from Winn et al. (2017) (fig. 6D and E). The stratigraphic difference between GC86 and CP12b was 290 m, with CP12b located ~200 m above the Great Unconformity and GC86 located ~90 m below the Great Unconformity, so we raised the graphed T-time history of GC86 7 ºC before a comparison was made. The age of fluid entrapment from this comparison was 86 ± 14 Ma. Sample 6 from Winn et al. (2017) was located directly below the Great Unconformity. The T-time history of Sample 6 was raised 5º C before comparing it to the Tt of CP12b to account for the ~200 m stratigraphic difference between the two samples. The age of fluid entrapment for CP12b based on the comparison to Sample 6 was 90 ± 10 Ma. The weighted mean of the age of entrapment from CP12b comparisons was 89 ± 8 Ma.
4. DISCUSSION
There are no direct geochronologic determinations of the age of the Grand Canyon microfractures. Regionally identified structures include Laramide-age monoclines and Miocene or younger normal faults (e.g., Babenroth & Strahler, 1945; Davis & Bump, 2009; Huntoon & Sears, 1975; Resor, 2008). In addition, Davis and Bump (2009) document calcite stylolites with en echelon veins, possibly formed in the Late Campanian, across the Colorado Plateau. These may be correlative with calcite veins sampled within the Grand Canyon. Thus, it is likely that the microfractures are related to the formation of large-scale monoclines near the Grand Canyon.
All the existing geochronologic ages have been determined from basement apatites (e.g., Dumitru et al., 1994; Flowers et al., 2008; Wernicke, 2011), from detrital apatites within the overlying formations (Dumitru et al., 1994), or from (U+Th+Sm)/He dates of crinoids (Copeland et al., 2015), rather than from any fractures or microfractures. In general, precise estimates for the absolute age for any fractures are difficult to obtain. These estimates are typically constrained by either relative timing or the entrapment temperatures of fluid inclusions, as in this study. Such interpreted entrapment times represent the latest possible times of microfracture formation. Theoretically, the microfractures could predate the entrapment of fluid inclusions. Nevertheless, the entrapment times and temperatures of the fluid inclusions in this study constitute points of control on the time-temperature history of the fluid inclusions and enclosing strata, whether or not they constrain the exact age of the microfractures.
Because secondary fluid inclusions form from the healing of microfractures, the presence of secondary fluid inclusions suggests weak deformation of these rocks. Based on our ages of fluid entrapment, we interpret deformation to have occurred during uplift of the southwestern Colorado Plateau during the Laramide orogeny. These fluid-inclusion temperatures all seem to correspond to a very narrow range of apparent times of entrapment. The consistency of ages, 89 ± 8 to 58 ± 8 Ma, of fluid entrapment suggests that these fluid inclusions formed as a consequence of the weak deformation of these rocks during the late Cretaceous to early Paleogene. This corresponds to the time of rapid late Cretaceous cooling suggested in the old-canyon model (Flowers et al., 2008; Flowers & Farley, 2012), which could correspond to an uplift of ~ 1800m between ~80 and 70 Ma assuming a paleogeothermal gradient of 25 oC/km
4.1. Removal of Overburden During the Late Cretaceous
The new fluid inclusion data presented here are consistent with other estimates of Late Cretaceous – early Cenozoic uplift and denudation of the Colorado Plateau in the area of Grand Canyon, Flowers et al. (2008) suggested that a minimum of 1.5 km of Cretaceous strata had been removed from the Grand Canyon region between 80 and 50 Ma and that denudation occurred from the southwest to the northeast. That is, from Colorado Plateau margin to Colorado Plateau interior. Using clumped-isotope data from carbonates, Ryb et al. (2021) determined that >63% of exhumation from the Upper Gorge area and >83% of exhumation from the Grand Wash and Lower Gorge areas occurred prior to the late Oligocene. U-Pb dating of the Long Point Limestone on the Coconino Plateau revealed that uplift and major denudation occurred prior to 64 ± 2 Ma for the Coconino Plateau portion of the Grand Canyon (Hill et al., 2016). For our samples, the amount of overburden above the Kaibab Limestone ranged from 3.6 km to 1.1 km during the late Cretaceous to early Paleogene. The calculated overburden on our samples agrees with the removal of a minimum of 1.5 km of Cretaceous strata by 50 Ma. Ryb et al. (2021) estimated that 2.6 km of strata above the Colorado Plateau surface had been removed from the Upper Gorge (i.e., eastern side of Grand Canyon) and 2.9–3.2 km of strata above the plateau surface had been removed from the Grand Wash area (i.e., western edge of Grand Canyon). Overburden above the Kaibab for eastern Grand Canyon samples in this study is 3.6 km, 1 km more than estimates from Ryb et al. (2021) for the same region, and 2.3 km for our western Grand Canyon sample, 0.6–0.9 km less than estimates from Ryb et al. (2021).
Two adjacent samples, CP44a and CP42(3), from the Redwall Fm. track the progression of denudation during the late Cretaceous for eastern Grand Canyon. CP44a had an entrapment age of 58 ± 8 and 1.1 km of overburden at the time of fluid entrapment whereas CP42(3) had an entrapment age of 88 ± 8 Ma and 3.6 km of overburden. This difference in time of entrapment and amount of overburden suggests that 2.5 km of Cretaceous strata above the Kaibab had been removed from this area by 58 Ma. Two other samples, CP55(2)a and CP55(3)a, collected from the same outcrop within the Supai Group also record denudation during the late Cretaceous. Sample CP55(2)a had 2.4 km of overburden at 72 ± 8 Ma and CP55(3)a had 1.1 km of overburden at 66 ± 10 Ma, suggesting that 1.3 km of late Cretaceous strata above the Kaibab had been removed from this area between 72 to 66 Ma. This finding is consistent with Hill et al. (2016) suggestion that major denudation had occurred prior to 64 ± 2 Ma and the removal of a minimum of 1.5 km of late Cretaceous strata from 80–50 Ma suggested by Flowers et al. (2008).
At 89 ± 9 Ma, CP12b, from western Grand Canyon, had 2.3 km of overburden above the Kaibab. Northeast of CP12b, eastern Grand Canyon sample CP42(3) had 3.6 km of overburden above the Kaibab at 88 ± 8 Ma. The 1.3 km difference in overburden but similar entrapment ages for CP12b and CP42(3) suggests that removal of late Cretaceous strata occurred on the western side of the canyon before the eastern side, a conclusion consistent with apatite thermochronology and clumped isotopes of the region (Flowers et al., 2008; Ryb et al., 2021). Additionally, eastern Grand Canyon samples CP53(1)b, CP57(4)b, and CP55(2)a had 2.4–3.6 km of overburden above the Kaibab between 72 ± 8 and 68 ± 10 Ma. Compared to CP12b, the younger fluid entrapment ages but increased overburden of these samples further indicates that the removal of late Cretaceous strata occurred on the western side of Grand Canyon prior to eastern side.
4.2. Integration of Fluid Inclusion Results with Colorado Plateau Burial History Curves
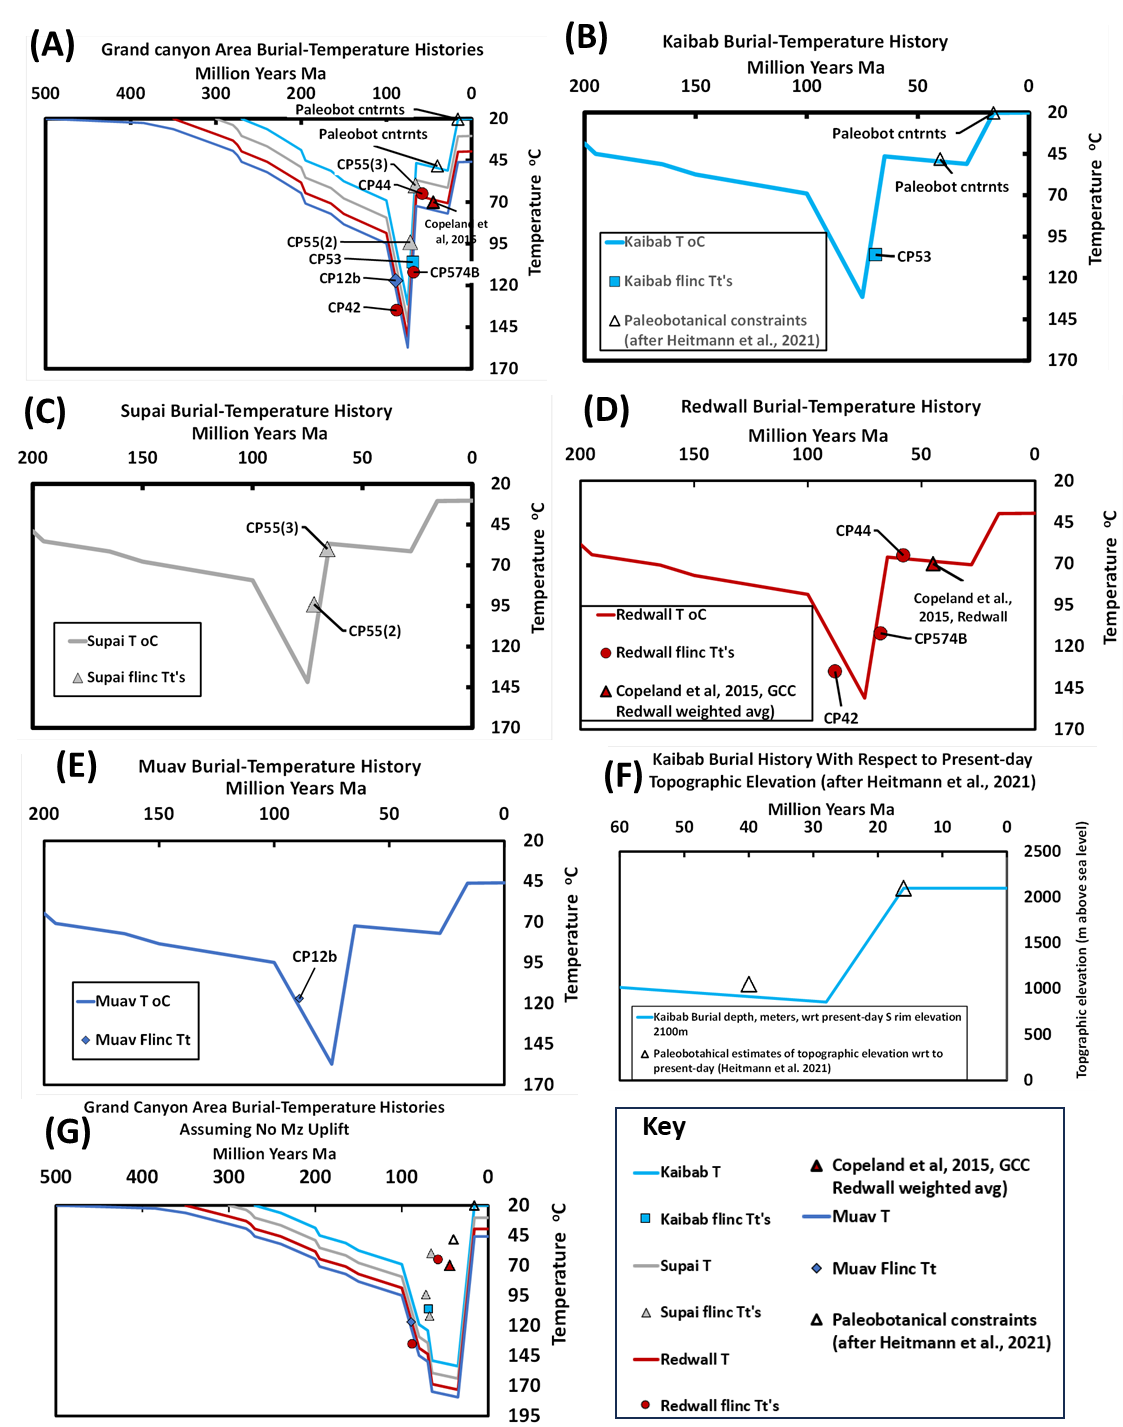
Thermal history curves were constructed assuming surface temperatures of 20 ºC, and a constant geothermal gradient of 25 ºC per km, based on Flowers and Farley (2012), K. E. Karlstrom et al., (2014), Wernicke (2011), Winn et al. (2017), and consistent with the assumptions of the fluid inclusion interpretations as discussed above (fig. 7). The fluid inclusion trapping times and temperatures represent significant constraints on these curves. The pre-Mesozoic portions of the burial history curves are relatively well constrained by the ages and measured stratigraphic thicknesses of the Muav through Kaibab sections in the vicinity of the Grand Canyon South Kaibab Trail, as listed in table 2. In contrast, thicknesses and ages of the missing sections stratigraphically above the Kaibab Limestone are only constrained by nearby measured sections, isopach maps, and correlation sections in the vicinity of Grand Canyon, as listed in the table 2 references. The specific thickness and age values of the post-Kaibab formations used in the thermal and burial history constructions were selected within these regional constraints to fit the fluid inclusion results constraints of this study, the (U-Th)/He age for calcite from the Redwall formation (Copeland et al., 2015) and paleobotanical elevation constraints (Heitmann et al., 2021).
The results show relatively constant heating rates up to ~100 Ma (fig. 7A, B, C, D, and E). From ~100 to 75 Ma, the Muav and the oldest Redwall fluid inclusion ages and trapping temperatures require a significant increase in temperature that corresponds to the deposition of 2500 m of Mancos-Shale-equivalent and Mesa-Verde-Group-equivalent sediments. This portion of the curves between 100 Ma and 75 Ma is optimized to fit the 89 Ma Muav fluid inclusion point (CP12b) and the 88 Ma Redwall fluid inclusion point (CP42(3)); changing the slope and/or end points of this portion of the thermal curve increases the fit to one of these points while decreasing the fit to the other.

The portion of the burial curves representing 3400 m uplift from 75 Ma to 65 Ma is constrained by the Supai fluid inclusion points (CP55(2)a and CP55(3)a), the Kaibab fluid inclusion point (CP53(1)b) and the Redwall fluid inclusion points (CP574B and CP44a). As with the preceding part of the curves, altering the end points or the slope of this portion improves the curve fits to some points while decreasing the fit to the other points. The age of this uplift corresponds to the Laramide orogeny in Utah and Arizona, and the magnitude of the uplift (~3.4km) is consistent with an estimate of ~1.3–4.5 km based on apatite fission-track data (Dumitru et al., 1994), and slightly greater than an estimate of 2 km based on river profiles (Roberts et al., 2012). The thermochronologic data alone might be interpreted to yield a very slow late Cretaceous – early Cenozoic exhumation rate, on the order of 50m/Ma. However, when this data is combined with the stratigraphic and fluid inclusion data, the resulting burial history curves indicate a late Cretaceous-early Cenozoic exhumation rate of ~ 440 m/Ma comparable to the late Cenozoic exhumation rate (400–700 m/Ma) of the European Alps (Bernet et al., 2001; Hurford, 1986).
The curves between 65 Ma and 28 Ma represent subsidence and deposition of ~200 m of Claron-equivalent sediments. This portion of the curves is constrained by the Redwall fluid inclusion point (CP44a), the crinoid (U+Th)/He age suggesting a Redwall temperature of ~70 ºC (Copeland et al., 2007) at 45 ± 2 Ma (Copeland et al., 2015), and the paleobotanic estimate of topographic elevation of ~1050m at ~ 40 Ma (fig. 7F) (Heitmann et al., 2021).
The magnitude and timing of the final Plateau uplift of ~1200 m between 28 Ma and 16 Ma are based on the paleobotanic estimates of topographic elevation (~1050 at 40 Ma and ~ 2100 m at ~16 Ma: Heitmann et al., 2021), the total absence of Claron-equivalent sediments, and the occurrence of Kaibab Limestone at the present-day surface. It is also based on apatite (U-Th)/He thermochronometry indicating that this stage of Plateau uplift began at ~ 28 Ma (Flowers et al., 2008; Hill & Polyak, 2020), and is consistent with water and carbonate Sr, C, and O stable isotope tracer trends over the past 12 my indicating that the Plateau was relatively high by 8–6 Ma (Crossey et al., 2015). This interpreted uplift age (28–16 Ma) implies the final Plateau uplift is slightly older than in the classic interpretations of the final uplift beginning at ~ 6 Ma, which are based on the first appearance of Colorado River sediments overlying the 6 Ma Hualapai Limestone in the Grand Wash Trough, where the Colorado River currently exits the Colorado Plateau (e.g., Longwell, 1946; Lucchitta, 1979; Spencer et al., 2001; Young, 1979). The implied Late Cenozoic Plateau uplift rate (1100m between 28 and 16 Ma) equals 65 m/Ma, an order of magnitude less than modern-day orogenic belts (e.g., Bernet et al., 2001).
The data presented above are consistent with formation of Grand Canyon in at least two stages. The first stage of Plateau uplift between ~75 and 65 Ma is consistent with initial incision of Grand Canyon by the northeast-flowing “California River” (Wernicke, 2011). The final stage of Plateau uplift between ~ 35 and 16 Ma is consistent with a second stage of incision by the south-flowing Colorado River. The paleobotanic data of Heitmann et al. (2021) showing that the Colorado Plateau reached approximately its present-day elevation at ~ 16 Ma suggest that this final stage of incision occurred primarily between 35 Ma and 16 Ma prior to the opening of the Gulf of California at ~ 5 Ma and any concomitant eastward shift of the mouth of the present-day Colorado River.
Thermochronologic data presented by Fox and Shuster (2014), Fox et al. (2017) Lee et al. (2013), and Wernicke (2011) are interpreted to explicitly date incision of Grand Canyon. In contrast, the fluid inclusion data presented here cannot distinguish uplift and unroofing of the rim of Grand Canyon from uplift and unroofing of the base of Grand Canyon, and thus do not directly constrain incision of Grand Canyon, analogous to data and interpretations presented by Crossey et al. (2015), Dumitru et al. (1994), Flowers et al. (2008), Heitmann et al. (2021), Longwell (1946), and Lucchitta (1979). In each of these studies, incision of Grand Canyon is implicitly or explicitly assumed to be synchronous with uplift of the Colorado Plateau in the vicinity of Grand Canyon.
Alternative “Young Canyon” interpretations of the Colorado River uplift history assuming only late Cenozoic Plateau uplift and no Mesozoic Plateau uplift are inconsistent with the fluid inclusion and paleobotanical data (fig. 7G). In this alternative, Cenozoic-only uplift scenario, the Muav 89 Ma and the Redwall 88 Ma fluid inclusions coincide with the Cretaceous portion of the burial history, which is common to both scenarios. However, all younger fluid inclusions are inconsistent both with uplift younger than ~16 Ma, and with a lack of uplift in the Late Cretaceous – Paleogene (see fig. 7G). The fluid inclusions cannot be related to any possible deformation other than burial and uplift, as the flat-lying, unfaulted and unfolded host rock strata of Grand Canyon are renowned for their lack of any deformation other than burial, and uplift.
4.3. Comparison of Clumped Isotope Temperatures and Fluid Inclusions
Recent studies compare the temperature calibration between carbonate clumped isotopes with fluid inclusions (Came et al., 2017; Honlet et al., 2018; Jautzy et al., 2020; MacDonald et al., 2018; Mangenot et al., 2017; Mueller et al., 2022; Nooitgedacht et al., 2021; Uemura et al., 2020). Several studies report similar temperatures between clumped isotopes and fluid inclusions (Came et al., 2017; Jautzy et al., 2020; Mangenot et al., 2017). In contrast, MacDonald et al. (2018) report that fluid inclusion temperatures are equivalent to present day ambient downhole temperatures whereas clumped isotopes record lower temperatures that represent carbonate crystallization. This implies reequilibration of the fluid inclusions during burial. Honlet et al. (2018) report higher clumped isotope temperatures than fluid inclusion results. They attribute this to over-pressured fluids that precipitated zebra dolomite. These various studies show that care must be taken to integrate carbonate petrology, deformation, clumped isotopes, and fluid inclusion results to yield a complete history since carbonate crystallization including pressures during burial and subsequent deformation.
In our study, all but one of the estimated trapping temperatures are higher than the clumped isotope temperatures from the same samples from Ryb et al. (2021) (table 3). The higher fluid inclusion temperatures agree with our observations that several samples have twinned calcite indicating deformation since carbonate crystallization. Both observations agree with our interpretation that the fluid inclusions were not present during carbonate crystallization but trapped later during weak deformation associated with the Laramide event.
5. CONCLUSIONS
The formation of secondary fluid inclusions requires formation of microfractures, and we conclude that the microfractures and fluid inclusions in our samples occurred due to strain caused by uplift of the southwestern Colorado Plateau. Our fluid inclusion data, when compared to T-time histories of rocks within Grand Canyon, reveals that these fluids were trapped during the late Cretaceous. The late Cretaceous timing of fluid entrapment aligns with early stages of Colorado Plateau uplift in the area of Grand Canyon. Our data indicate that 2.5 km of Cretaceous strata was removed from 88 Ma to 58 Ma for eastern Grand Canyon and that the western section of Grand Canyon began uplift and removal of overburden prior to the eastern side.
Regional stratigraphic analysis combined with the fluid-inclusion data presented here suggest an increase in heating from 100–75 Ma, consistent with deposition of 2.5 km of Mancos-Shale-equivalent and Mesa-Verde-Group-equivalent sediments, and 3.4 km of uplift from 75–65 Ma, consistent with the passage of the Conjugate Shatsky Rise on the Farallon plate beneath the region of Grand Canyon at this time (Copeland et al., 2017). Models that delay uplift until the Cenozoic are inconsistent with the data presented here (fig. 7G). The new fluid inclusion data presented here represents new data in support of the “old Colorado” interpretation. The new synthesis of this fluid inclusion data with existing thermochronologic, stratigraphic and paleobotanic data, provides new constraints on the time and magnitude of both the late Cretaceous-early Paleocene uplift, and the late Neogene uplift of the Colorado Plateau in the area of Grand Canyon.
ACKNOWLEDGMENTS
We thank John Eiler and Uyi Ryb for sample collection; Shelby Johnston for early assistance with this work; Henry Chafetz for assistance with carbonate petrography; Matthew Fox, Mark Brandon, and an anonymous reviewer for helpful comments; and Tom Lapen and Alan Brandon for financial support. This work was supported by an Undergraduate Research Grant from the Geological Society of America.
DECLERATION OF COMPETING INTEREST
The authors declare that they have no known competing financial interests or personal relationships that could have appeared to influence the work reported in this paper.
CREDIT AUTHOR CONTRIBUTIONS
Laura L. Barnett: Investigation, Visualization, Funding acquisition, Writing - Original Draft, Review & Editing. Peter Copeland: Conceptualization, Methodology, Writing – Original Draft, Review & Editing. Virginia B. Sisson: Resources, Supervision, Writing – Review & Editing. Steve Naruk: Methodology, Writing- Original Draft, Review & Editing.
SUPPLEMENTARY DOCUMENT
https://doi.org/10.5281/zenodo.10987965
Editor: Mark T. Brandon