


1. INTRODUCTION
The volumetric properties of silicate melts and glasses are critically important to the glass industry, to igneous petrology, and to the prediction of natural hazards. To give a single example, these properties must be known to determine the buoyancy of magma from mantle to the surface of the Earth, which makes them particularly relevant to the prediction or forecasting of volcanic activity. Explosive volcanism represents a continual and immediate environmental hazard to life. It is also a hazard to the stability of climatic conditions on the short term (a few years), due primarily to contamination of the upper atmosphere and stratosphere with volcanic gases and particulate matter. There is, therefore, good reason to expand our understanding of the processes that affect volumetric properties. This study focusses on the isobaric coefficients of thermal expansion of melts and glasses and on the coefficients of thermal expansion of their constituent oxides N, N = metal oxide). Although values of numerous melts were documented over 60 years ago (Bockris et al., 1956; Tomlinson et al., 1958), there seems to be no discussion of the basic physical-chemical factors that affect the magnitudes and signs of for glasses or melts. The situation exists because the relationships among isothermal compressibility and heat capacities (Cp−CV = TV2/ does not provide general, fundamental insights into aspects affecting owing to the specificity of the atomic interactions involved in different systems. Lange and Carmichael (1990) however, offer insight by noting a systematic, inverse relationship between thermal expansion and cationic field strength of the alkali oxides. To understand better the physical chemical aspects contributing to the relationship between temperature and the molar volumes of melts and glasses is addressed followed by an investigation into the relationship between of a melt (or glass) and of its ‘N’ component oxides N). We then address the effects that Coulombic interactions have on N, followed by aspects affecting coordination numbers (CNs) of modifier cations, including discussion of a mechanism by which CNs are altered.
2. MOLAR VOLUMES AND THERMAL EXPANSION
2.1. Functional relationships
Coefficients of thermal expansion cannot be measured directly. The densities of melts or glasses first must be determined as a function of temperature at a constant pressure (P) and composition (X). With densities known, molar volumes (V), then can be calculated. Values of traditionally were determined using a finite difference approach ~ [∆V/∆T]/VAv) derived from the partial differential expression of equation (1), given below. Volumes may be determined, for example, at two temperatures, T1 and T2, from which an average volume (VAv = [VT2–VT1]/2) is obtained. Similarly, ∆V/∆T can be evaluated ([VT2−VT1]/[T2−T1]) and taken as an approximation to ∂V/∂T, which then may be used to estimate A numerical methods approach, using a Taylor series expansion would provide both accurate evaluation of over a specified temperature range and of its uncertainty over the same range. This, however, should be the focus of a separate study.
Ottonello (1997, p. 254, table 5.22), in his summary of thermal expansion of some crystalline silicates, used the following expression to evaluate the coefficient of thermal expansion, as a function of temperature:
α=(∂VV∂T)P,X=a1+a2T+a3T2
T is temperature, ∂V/∂T is the partial derivative of volume with respect to temperature of a phase held at constant pressure (P) and composition (X). Values for are obtained by fitting volumetric-temperature data. Where temperature alone is varied (P and X are constant), equation (1) can be rewritten as an ordinary differential equation:
α=(1/V)dV/dT = a1+a2T+a3T2
With respect to the differentials:
α=(dV/V)=(a1+a2T+a3T2)dT
Integrating both sides of equation (3) (at constant P and X), then combining the constants of integration yields:
lnVP,X=a1T+(a2/2)T2+(a3/3)T3+C
where C is the constant of integration. It may be eliminated by integrating between two temperature limits. The subscripts indicate that the equation holds only where P and X are constant. Fits of lnVP,X versus T yield the and C coefficients, from which VP,X and may be evaluated using respectively, equations (4) and (2). Because the same coefficients are used in evaluations of both lnVP,X and their uncertainties are commensurate.
Not all coefficients may be required to fit volumetric data over limited temperature ranges. Employing only the first polynomial term of equation (4) yields:
lnVP,X=a1T+C
The constant of integration, C, equals lnVP,X at T = 0 K. Integration between two temperature limits eliminates C. Fitting experimental lnVP,X-T data yields a value for the a1 fit coefficient, which is the coefficient of thermal expansion for the phase The coefficient of thermal expansion thus is determined directly from the fit to the lnVP,X-T experimental data. Importantly, a separate fit or calculation is not required to obtain The equation pertains to sodic glasses.
Over large temperature ranges volume is likely to be a function of T requiring at least the first two terms on the right side of equation (4) to be used. If so then:
lnVP,X=a1T+(a2/2)T2+C
A fit to experimental data (lnVP,X versus T) permits determination of and which can be substituted into equation (3) to obtain the value of for the phase at T. Substitution of the coefficients into equation (3) yields the temperature dependence of with accuracy commensurate with the fits to the experimental volumes. The fits and fit coefficients, however, are accurate only between the temperature limits of the fits. Where volume follows a quadratic expression in temperature (eq 4), a fit of lnVP,X-T experimental data yields the fit coefficients which can be substituted into equations (1) or (2) to obtain at T. The fit coefficients obtained from equation (4) permit evaluation of both and VP,X as a function of temperature. By fitting a polynomial of order ‘n’ to lnVP,X vs T data to obtain the fit coeffcients, the derivative (a polynomial of order ‘n−1’), and its coefficients, are immediately obtained which yields as a function of temperature. The uncertainty in is commensurate with that of V. A numerical methods approach utilizing a Taylor series rather than an arbitrary polynomial such as equation (4) would be a better approach in that the uncertainty in V and would be obtained.
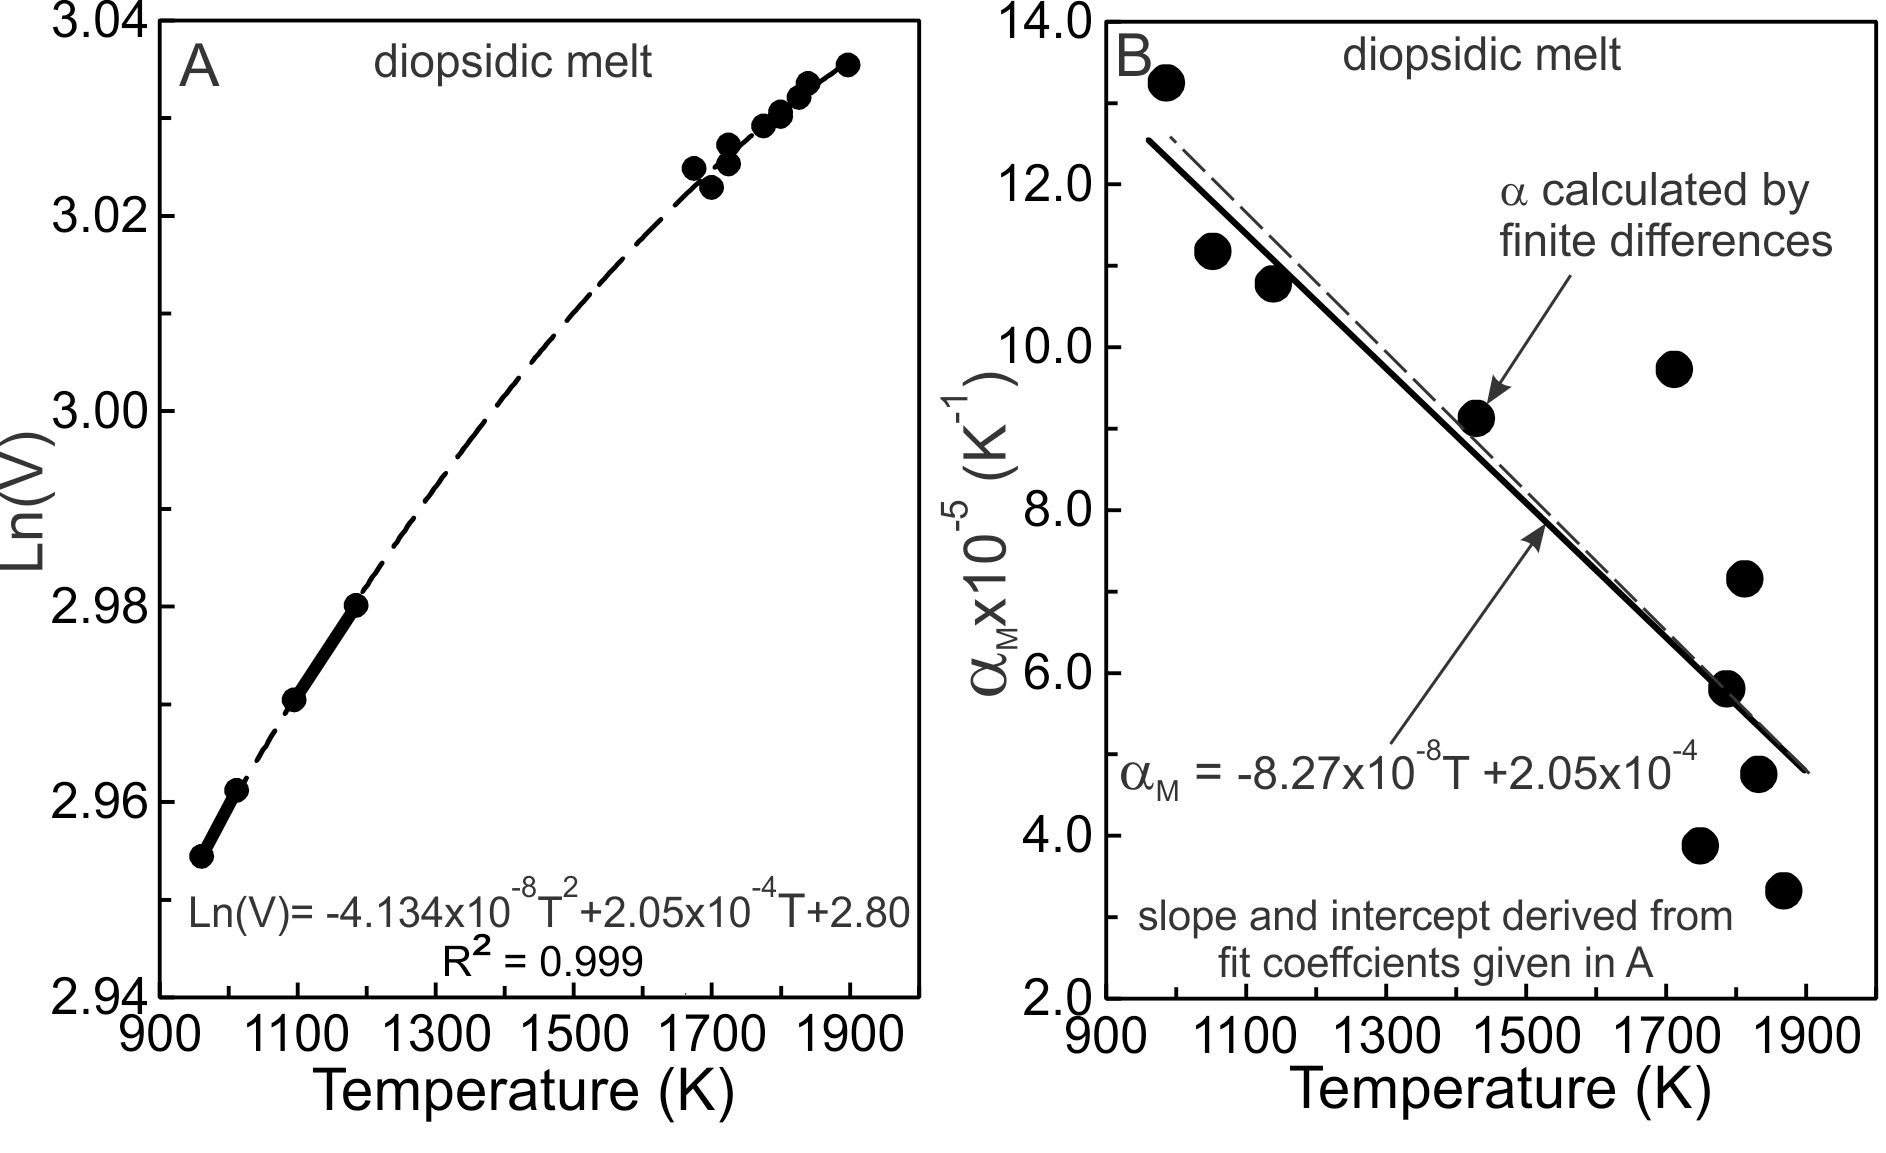
2.2. An example: diopsidic melts
The logarithms of the molar volumes of diopsidic melts (VM) are plotted against T in figure 1A using the same data as Toplis and Richet (2000, their fig. 7c). The dashed curve represents a least-squares, quadratic fit to the data using equation (6). The derivative of the fit yields the expression for as a function of temperature. It is linear in T, as shown in figure 1B. The coefficients required to determine of equation (3) are obtained from the fit coefficients shown in figure 1A. Noting the constant, a2/2 of equation (6), becomes:
(dlnV/dT)P,X=α=2(−4.134x10−8)T+2.05x10−4=−8.268x10−8+2.05x10−4
It is shown as the straight line in figure 1B. The straight line is not a fit. Its slope and intercept were determined entirely from the coefficients of the fit to the lnVM versus T data (fig. 1A) so that the uncertainty in is commensurate that of the experimental volume of the melt. The finite difference calculations = (∆V/∆T)/V) of are illustrated as large dots and the uncertainty associated with the technique is apparent. The dashed line is the best fit to the dots. Additional volumetric measurements may demonstrate that lnVP,X vs T is better described by a cubic or quartic expression in temperature, and re-evaluation of then would be required.

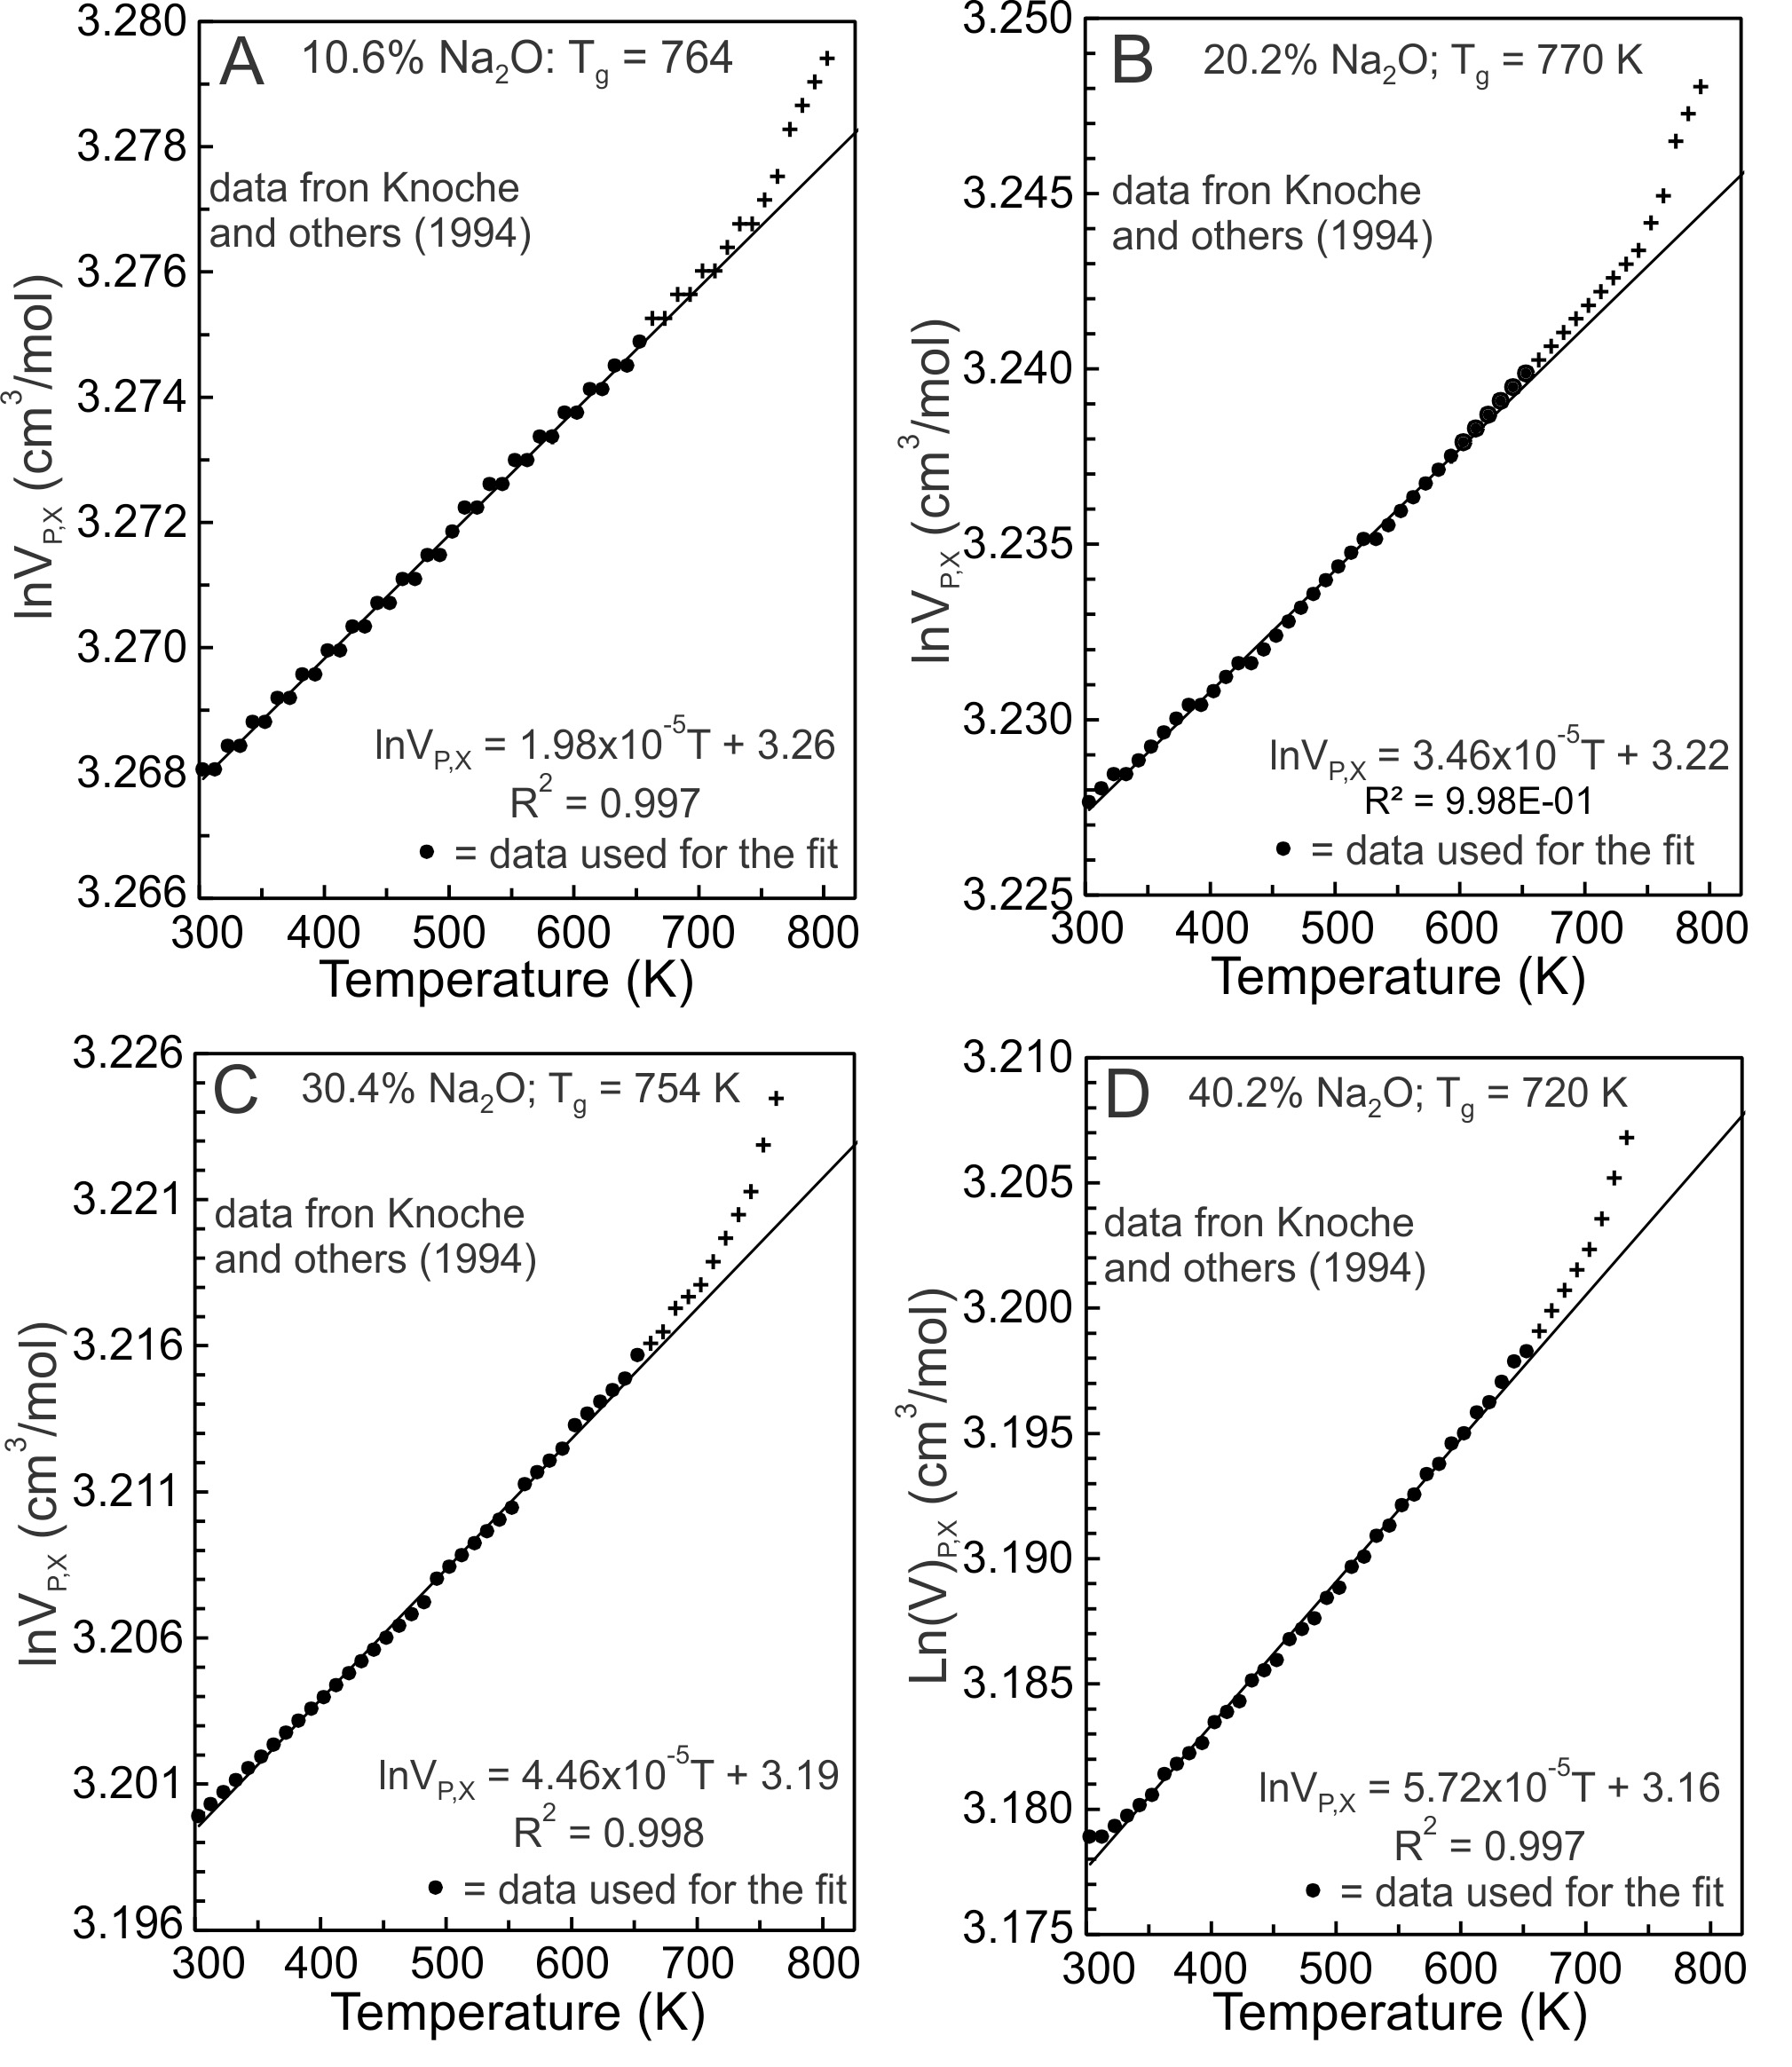
2.3. Na-silicate glasses
Knoche et al. (1994) determined the temperature dependence of molar volumes of Na-silicate glasses containing 1.9, 4.9, 10.6, 16.0, 20.2, 25.7, 30.4, 35.3, 40.2 and 45.0 mole% Na2O. Four results are illustrated in figure 2. lnVP,X values between 300 and 650 K (fig. 2, dots) were fit using equation (5). Fits to the other glass compositions are similar, all yielding effectively linear trends. The values of the slopes of the fits equal G and they are constant between 300 and 650 K for each glass composition and at ambient pressure. With glass transition temperatures (Tg) between ~710 and 780 K, configurational changes do not contribute to the molar volumes of the glasses at T < 650 K, although Si-O and Na-O vibrational contributions do (Lange, 1997; Richet, 2001b, 2001a; Richet & Neuville, 1992).

2.3.1. Vibrational contributions
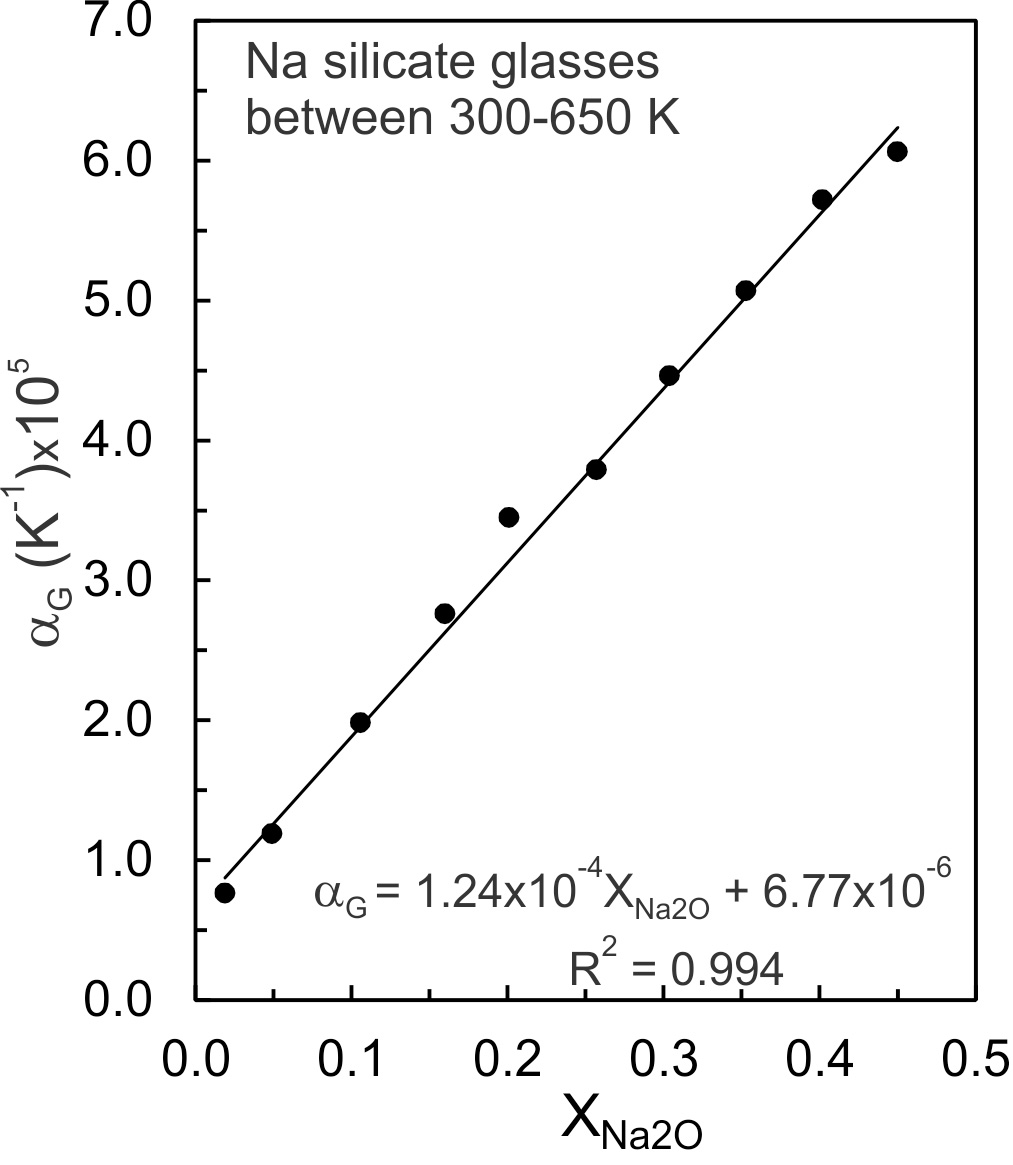
An anharmonic potential energy (PE) surface of a diatomic molecule (fig. 3A) is used as an analogue for Si-O and Na-O potential energy (PE) wells of Na-silicate glasses (Huheey et al., 1993, pp. 99–104), recognizing that PE wells vary appreciably for lack of long range order. Na-O and Si-O dissociation energies (De) are 257 and 798 kJ/mol respectively (Speight, 2005), thus Na-O bonds are much weaker than Si-O bonds. The energy levels separating the ground and excited vibrational states of a PE well are dependent on De, so less energy is required to promote a Na-O than a Si-O vibration from its ground state to its first excited state, which results in increased M-O bond distances (fig. 3A) and molar volumes (Bayram & Freamat, 2012; Moelwyn-Hughes, 1961, pp. 416–418). The increase in volume of Na-silicate glasses between 300 and 650 K (fig. 2) thus should derive from the Na2O component of these glasses. As evidence, the slopes of the fits of lnVP,X versus T (fig. 2), which represent G values, are plotted against in figure 4. The G values increase linearly with Na2O content. The linear relationship is that expected if G were controlled by Na-O vibrational excitation in asymmetric potential energy wells. The increased lnV values result primarily from promotion of Na+ to excited vibrational states. Si-O vibrations remain mostly ground state vibrations.
_surfaces_are_plotted_as_functions_of_distance_separatin.jpg)
_at_specif.jpg)
Si-O vibrational excitation apparently contributes negligibly to G of the glasses, an indication being the very small value of the intercept of the fit (6.77x10⁻⁶ K-1) shown in figure 4. The intercept represents of a glass devoid of Na2O (but containing 0.03–0.1 wt.% H2O as measured by Knoche et al., 1994, their table 1). The value is greater than quoted by Deng et al. (2020) for bulk fused silica, but as they and Oishi and Kimura (1969) emphasize, variation in the value is expected and may be related to H2O or other contaminants (Knoche et al., 1994). There is an effectively constant value for fused silica applicable to the sodic glasses for T < Tg.
2.3.2. Configurational contributions
lnV increases non-linearly with T beginning at ~650–750 K (fig. 2, crosses) indicating an additional contribution to (hence V). Na-O potential energy (PE) wells are shallower than Si-O PE wells, so that with increased temperature, Na should become mobile in advance of Si, with Na+ migrating (hopping) from one site to another, resulting in new topologies (Cormack et al., 2002; Habasaki, 2021). Thus, with thermal agitation, Na-O bonds are ruptured by Na+ ‘topping’ PE barriers, allowing new, more energetic arrangements (topologies) to be accessed (Richet, 2001a, his fig. 5). As evidence, Lei et al. (2015) classify Na2Si2O5 glass as a fast Na-ion conductor at temperatures above ~600–700 K and they emphasize that Si and O contribute negligibly to conduction at these temperatures. At ~600–700 K, some Na-O bonds rupture with some reforming to produce more energetic arrangements (topologies), which affect V and As evidence, Na+ mobility results in an abnormal increase in heat capacity of NaSiO3 crystals above ~700 K (Nesbitt, Cormack, et al., 2017; Richet et al., 1996) followed by production of some Q3 species (Si tetrahedra with 3 apical BOs and a NBO) in NaSiO3 crystals commencing at 750–800 K (Nesbitt, Bancroft, et al., 2017; Nesbitt, Cormack, et al., 2017). The Q3 species form cross-chain linkages which stabilize the chains. Importantly, upon removal of Na+ from its PE well, the original Coulombic force of attraction between Na+ and O atoms of its first coordination sphere is replaced by Coulombic repulsion among the same O atoms. Net repulsive forces build within the glass as the fraction of mobile Na+ increases. These repulsive forces likely promote relaxation of glasses at temperatures somewhat greater than that at which Na becomes mobile. The repulsive forces can be minimized only by rearrangement of Si tetrahedra, which contributes to changes in V and (Richet, 2001a).
_and_partial_molar_volumes_(__ove.jpg)
3. MOLAR AND PARTIAL MOLAR COEFFICIENTS OF THERMAL EXPANSION
The volume of a crystal, glass, liquid, aqueous solution or gas, is the sum of the partial molar volumes its ‘N’ components multiplied its mole fraction. The molar volume of a melt or glass (VM or VG) thus may be expressed as:
VM=¯V1X1+¯V2X2+¯V3X3+⋯+¯VNXN
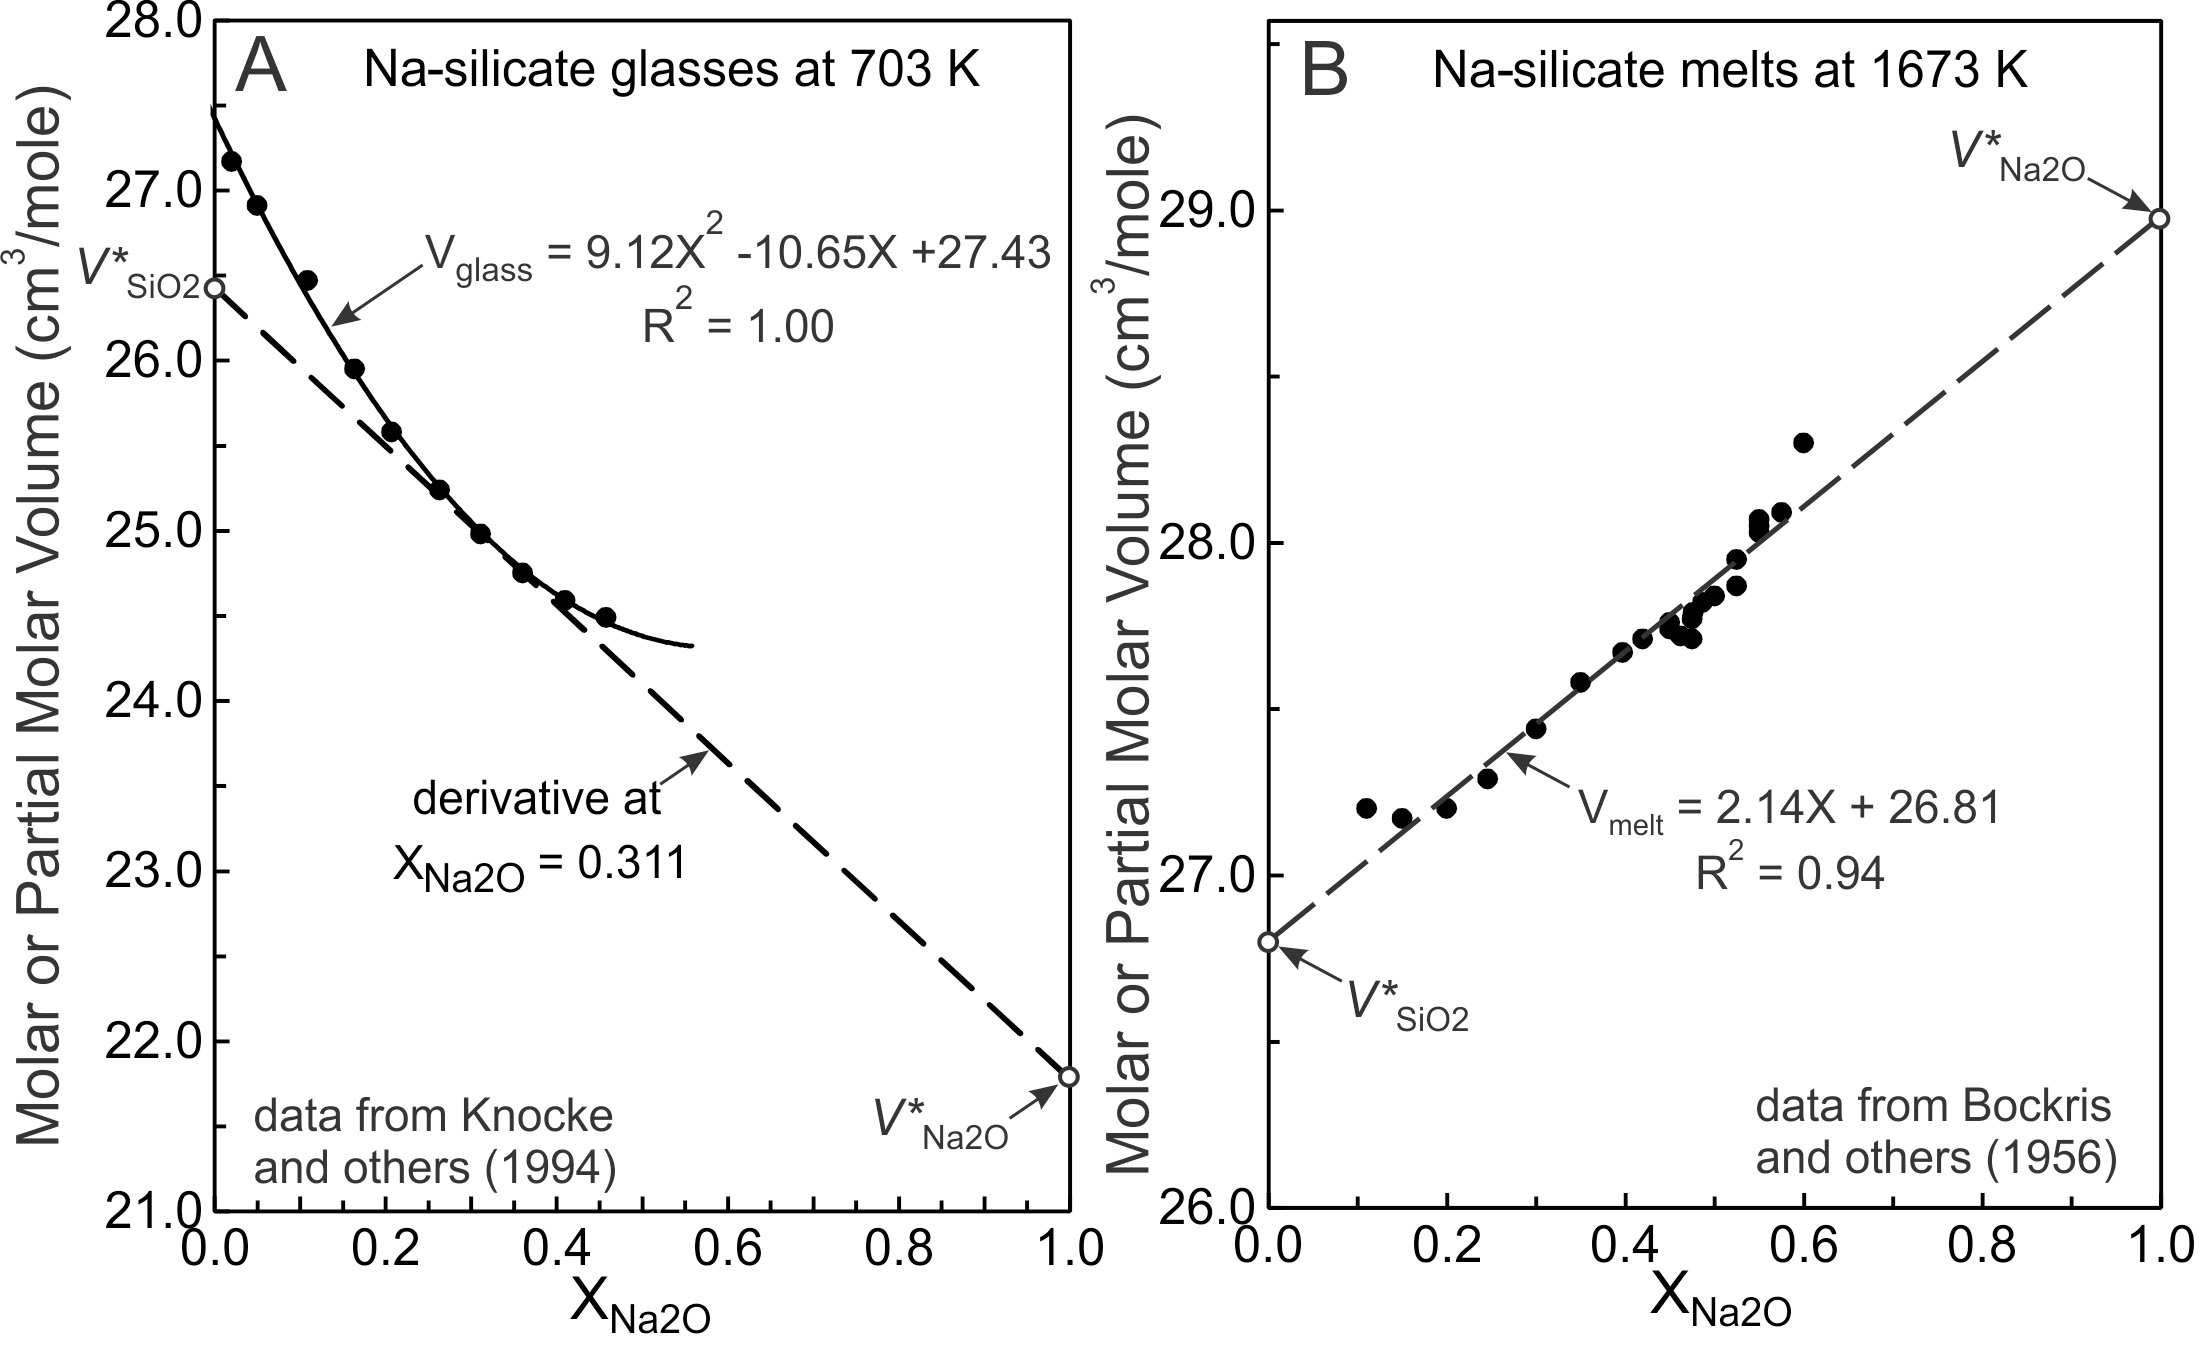
where is the partial molar volume and is the mole fraction of the Nth component. The relationship between molar and partial molar volumes is illustrated in figure 5A for Na2O-SiO2 glasses at 703 K. The quadratic fit to the glass molar volumes reproduces the data within experimental uncertainty and to obtain and of the glass at = 0.311, the derivative of the quadratic equation at this composition may be taken (dashed line of fig. 5A). Its extension to the compositional boundaries yields and at 703 K = 0.311; P = 101.3 kPa). The procedure may be repeated for any composition.
Where two components mix ideally, the molar volumes of a melt (or glass) adhere to a straight line with respect to composition, where the intercepts at the compositional boundaries are and (the molar volumes of pure liquid SiO2 and Na2O). Where glasses or melts display linear mixing trends over a limited compositional range (fig. 5B), the linear mixing trend cannot be taken as evidence for ideal mixing unless it is shown that the partial molar volumes, and equal respectively, and
Following Moelwyn-Hughes (1961, p. 815), and differentiating equation (8) with respect to temperature, at constant pressure and composition, yields:
(∂VM∂T)P,X=(∂¯V1∂T)X1+(∂¯V2∂T)X2+⋯+(∂¯VN∂T)XN
Rearranging equation (1) to (∂V/∂T)P,X = V and noting that ∂VM/∂T = MVM and /∂T = N then substitution of the last two equations into equation (9) gives:
(∂VM∂T)P,X=αMVM=α1¯V1X1+α2¯V2X2+⋯+αN¯VNXN
The symbols M and N refer respectively to the molar coefficient of thermal expansion of the melt and the coefficient of thermal expansion attributable to the Nth component of the melt (or glass) at constant composition and pressure. Division of both sides of equation (10) by the melt molar volume (VM) yields:
αM=α1θ1+α2θ2+α3θ3+⋯+αNθN
where θN is the volume fraction of the Nth component (θN = XN/VM) and ΣθN = 1.0. For binary systems:
αM=α1+(α2−α1)θ2
Bockris et al. (1956) report molar volumes and M for silicate melts containing 11–60 mole% Na2O. Bottinga et al. (1983) report and to be respectively 1.0x10⁻⁶ K−1 and 25.9x10⁻⁵ K−1, 26.75 cm3/mole and 29.03 cm3/mole. These values were substituted into equations (8) and (12) to calculate VM and M of the melt at each composition reported by Bockris et al. (1956). The same procedure was performed using the results of Lange and Carmichael (1987) and Ghiorso and Kress (2004). These calculated VM values are compared with the experimental values in figure 6A and the three studies yield remarkably good approximations to experimental VM values. Only at the extremes of composition do they differ appreciably from experiment.
_calculated_and_experimental_volumetri.jpg)
Equation (12) provides a rigorous test of the accuracy of N values in that M can be evaluated from N values via equation (12) and compared directly to experimental M values. Equation (12) has been used to calculate M of sodic melts from the component N values listed by Bottinga et al. (1983), Lange and Carmichael (1987), and Ghiorso and Kress (2004). The calculated values are compared with the experimental values of Bockris et al. (1956) in figure 6B. Calculated M values from these studies agree with experiment between ~30 and 53 mole% Na2O, but those of Ghiorso and Kress (2004) reproduce best the experimental values within the above-noted compositional range. None of the studies reproduces accurately the experimental M values of highly siliceous melts (SiO2 > 75 mole%). The deviations from experimental values observed in figure 6B arise from inaccuracies in and values. Additional studies are required to re-evaluate these coefficients and perhaps the other alkali and alkaline earths values in highly siliceous melts.
4. POTENTIAL ENERGY, COULOMBIC INTERACTIONS AND
Coulombic interactions account for ~90% of bond energies of ionic crystals. Dispersion, zero-point energy and other aspects account for the remainder (Huheey et al., 1993, Chapter 3; Moelwyn-Hughes, 1961). Navrotsky et al. (1985) emphasized that equilibrium M-O bond distances were similar in ionic crystals, glasses and melts from which we surmise that these same forces affect alkali-O and alkaline earth-O interactions in the three states of matter. In support, Nesbitt et al. (2022) demonstrate that ionic M-O bond distances derived from ionic crystals (Huheey et al., 1993; Ottonello, 1997; Shannon, 1976) can be utilized to calculate partial molar volumes of modifier oxides in melts and glasses.
Following Huheey et al. (1993; p. 99–104), the derivative (with respect to distance) of the Coulombic force of attraction yields the attractive potential energy (PEA) of a diatomic molecule composed of a cation (M) and an anion (O), as shown qualitatively in fig. 3A:
PEA=[(z+)(z−)4π]/d
where d is the M-O bond distance. The derivative of the Born repulsive force yields the repulsive potential energy (PER, fig. 3A, dash-dot line).
PER=(Bn)/dn−1
B is a constant and ‘n’ is the ‘Born exponent’, which is typically ~9 (Huheey et al., 1993, pp. 99–104). The sum of equations (13) and (14) yield a potential energy curve (a PE ‘well’ in 3 dimensions) as shown in figure 3A (thick curve). Its minimum occurs at the equilibrium M-O bond distance.
Potential energy wells resulting from the above interactions are asymmetric due to the differing nature of the attractive and repulsive forces. The asymmetry leads to anharmonicity, and as noted in a previous section, heating increases M-O bond distances, volumes and through population of excited vibrational states (fig. 3A). The energy separating the ground and first excited state is related to the slope of the PEA curve in that the shallower the slope the smaller the energy separating the vibrational levels, primarily because the slopes are mostly determined by the M-O dissociation energy (De) and the force constant (k) associated with M-O vibrations (Bayram & Freamat, 2012; Moelwyn-Hughes, 1961, p. 485). The stronger each is, the steeper the slope of the attractive portion (PEA) of the PE well near the vibrational ground state energy (fig. 3B). The slope of the PEA curve at a specified M-O distance is the derivative of equation (13) and yields equation (15) which is Coulomb’s Law. With heating, time-averaged M-O bond distances, molar volumes and should increase in proportion to the inverse of Coulomb’s force of attraction.
To emphasize the relationship between De and the slope of the PEA curve, two PE wells labelled X and Y are shown in figure 3B. The cation-anion bond is stronger for “X” than for ‘Y’, as required by the different values of De. The slopes of the PEA portions of the two curves at the vibrational ground state are labelled ‘c’ and ‘d’ respectively. The smaller is De the weaker is the bond, and the shallower is the slope of the attractive part of the PE curve (PEA) near the ground state energy. With an equivalent amount of heating, the time-averaged equilibrium bond distance should increase more for ‘Y’ than for ‘X’. From this we argue that N, should correlate the inverse of Coulomb’s force of attraction (1/FC). The relationship between and 1/FC is thus explored.
4.1. Alkali and Alkaline earth oxides
Coulomb’s force of attraction (FC) is:
FC=k(z+z−)/d2
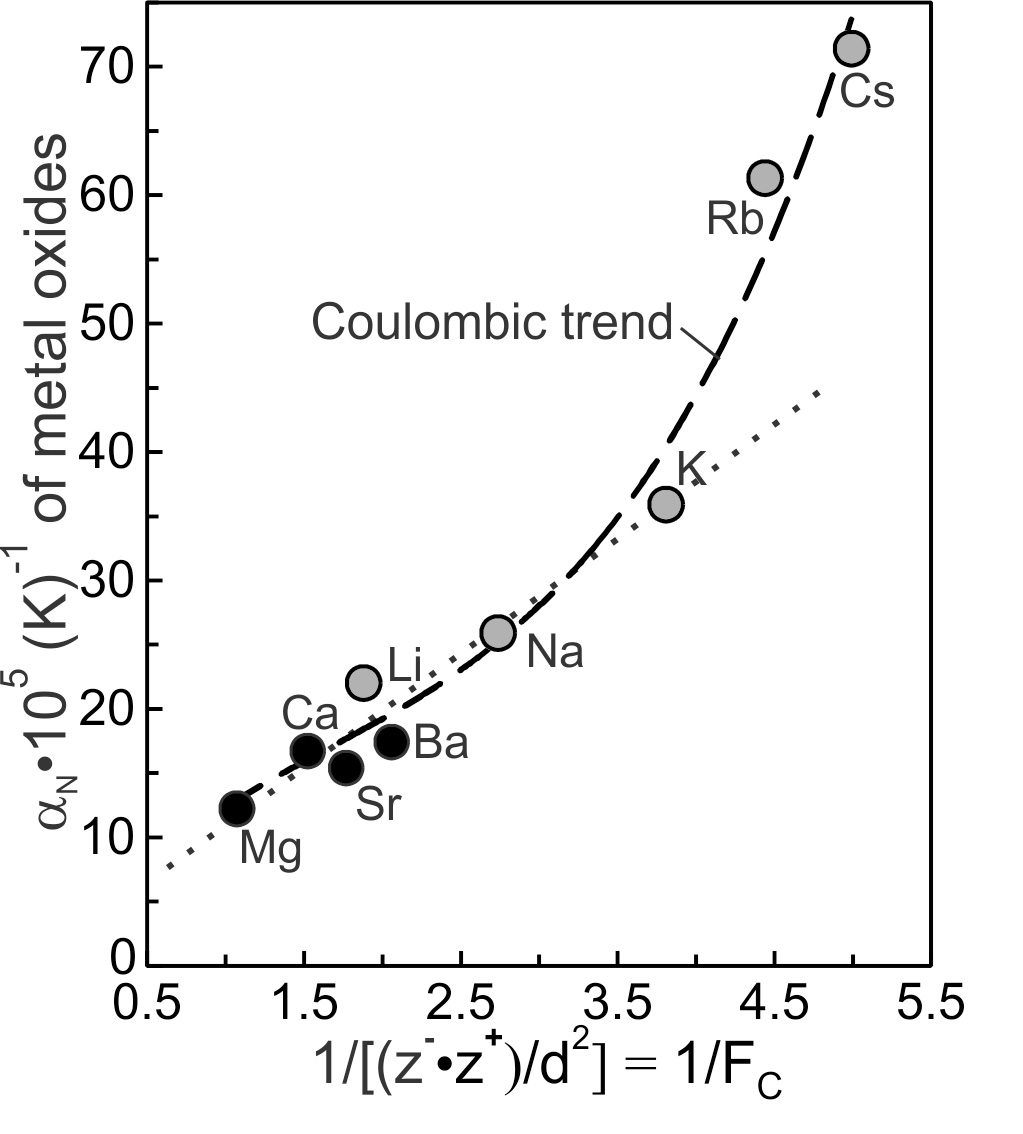
where k is a proportionality constant, z+ and z− are the charges on the cation (M) and anion (O) and d is the equilibrium distance separating them. Equilibrium bond distances ‘d’ were calculated using the ionic radii of alkali and alkaline earths cations and O2− (= 1.21Å) listed in table 1 (Huheey et al., table 4.4, 1993). Alkali and alkaline earth oxide N values of table 1 are plotted against 1/FC on figure 7. There is a correlation, even though maximum bond distances are greater than equilibrium bond distances. The N values describe an arcuate trend referred to and labelled as the ‘Coulombic trend’. The trend is arcuate owing to the values of Rb2O and Cs2O. The seven other oxides conform to an effectively linear trend regardless of the charge or radius of the cation (fig. 7). Clearly, the stronger the Coulombic force of attraction, the smaller the coefficient of thermal expansion N) of Groups I and II metal oxides. The conclusion is that N varies as 1/FC for the Group I and II oxides.
The N values of Rb2O and Cs2O plot above the dotted linear trend of the others, indicating an additional contribution that enhances their values. This contribution may relate to the previous approximation that the repulsive force makes the same contribution to PE wells of all alkali and alkaline earth oxides. The approximation probably is overly simple in that the weaker the Coulombic force of attraction the greater the proportional contribution of the repulsive force to the cation-anion interaction. Rb2O and Cs2O are the most likely of all Group I and II oxides to include a greater repulsive contribution and greater than expected N values.
_plotted_ag.jpg)
4.2. 3d and 4f oxides
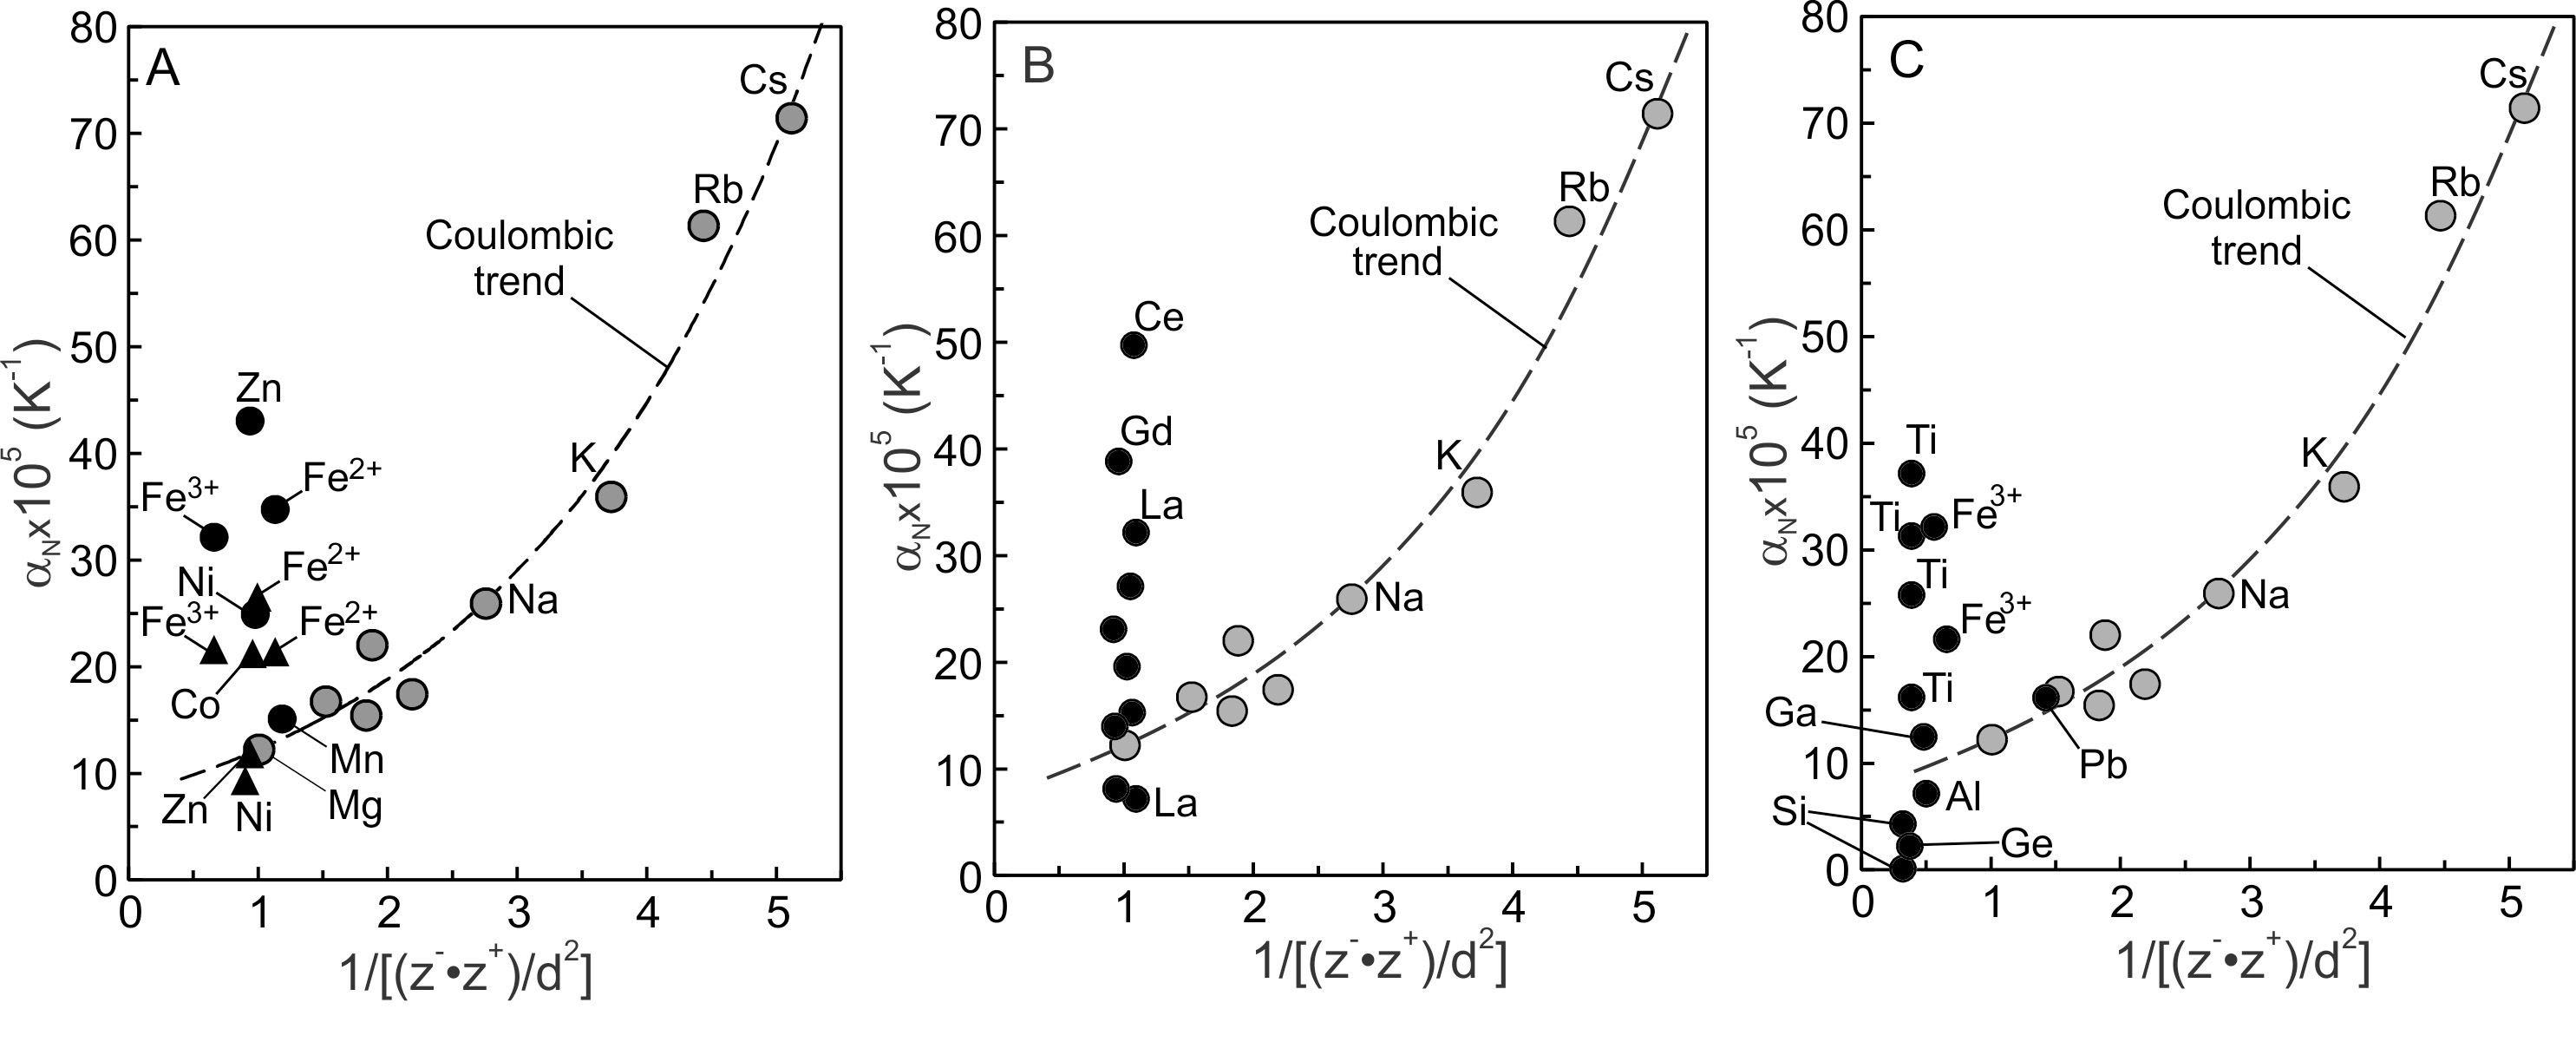
The N values of the 3d- and 4f-metal oxides (tables 2, 3) plotted on figures 8A and 8B describe near-vertical trends with the largest values being greater than The smallest N values of the 3d metal oxides plot close to the Coulombic trend. The N values of MnO, one ZnO and one NiO are similar to those of MgO and CaO, and Coulombic interactions likely determine their N values. The N values of 4f metal oxide describe a similar trend (fig. 8B) in that they span a large range in with two values being greater than Four values plot close to the Coulombic trend and near N of MgO and CaO. The low N values of these 4f metal oxides are consistent with control by Coulombic interactions. Apparently, Coulombic interactions set a lower bound on N values of the 3d, 4f, alkali and alkaline earths oxides.
._gr.jpg)
Other N values are greater than expected from Coulombic interactions. Guo et al. (2013), for example, observed an increase in as CaO was added to Fe silicate melts at constant temperature. Addition of CaO resulted in a decrease in the proportion of VIFeO and an increase in IVFeO (Guo et al., 2013, their fig. 5), demonstrating a relationship between and CN of FeO. The change in volume at constant temperature necessitates, by equation (2), an increase in FeO, thus a change to CN leads to a change in N. The N values of 3d and 4f oxides plotting above the Coulombic trend of figure 8 thus may reflect CNs differing from those plotting on the trend. The question to answer then becomes; why do cations of similar size have different CNs. Changes to CN change packing. Corner-shared tetrahedra pack less efficiently than octahedra (Chaikin, 2007; Hoylman, 1970; Song et al., 2008), especially where the latter share edges (Rossano et al., 2000). Similarly, different ZnO, NiO values (table 2) may result from the same cation being differently coordinated in different melts or glasses (Calas et al., 2014; Rosenthal & Garofalini, 1987).
4.3. Network-former oxides
The N values of table 3 describe a near-vertical trend on figure 8C extending from negative values (Ga2O3 = −9.1x10⁻⁵ K−1; Al2O3 = −3.2x10⁻⁵ K−1) to 37.1x10⁻⁵ K−1 for TiO2 (table 3). An apparently unique aspect of the network-former oxides is that some have very small or negative N values. If controlled solely by Coulombic interactions, the lower limit of values would be ~8x10⁻⁵ K−1 (fig. 8C) for these oxides. Clearly, other interactions affect values of the network former oxides. CN transitions cannot explain the small positive to negative values of and because they do not change CN in melts at ambient pressure. Electrostriction may provide a partial explanation. Nesbitt et al. (2022) demonstrate that tetrahedra collapse around all modifier cations in melts, decreasing somewhat melt molar volumes. Collapse around modifier cations thus may contribute to small or negative values of Si and Ge tetrahedra. Although Coulombic interactions causes such collapse, these interactions are largely insensitive to temperature, the major effect being on Si-O and M-O bond distances and are unlikely to cause additional changes to or This aspect combined with the effects of electrostriction should result in small values. Electrostriction does not affect vitreous silica and cannot explain its small values. Topological aspects clearly are important (Deng et al., 2020).
With respect to other network former oxides, Courtial and Dingwell (1999) provided a concise summary of aspects related to and values. and vary due in part to changes to CN and to the presence of different counter oxides in the melts (Courtial & Dingwell, 1995; Guo et al., 2013; Henderson et al., 2003, 2006; Henderson & Fleet, 1995; Liu & Lange, 2001, 2006; Toplis, 2001). Changes to CN and different melt compositions also may be relevant to Ni, Co and Zn oxides (Allwardt et al., 2005; Calas et al., 2014; Farges et al., 2001, 2004; Galoisy et al., 2001; Galoisy & Calas, 1993a, 1993b; Hunault et al., 2014; Jackson et al., 1993, 2005; Stebbins, 1995). The above-quoted studies point to changes in CN as (partial?) explanations for the different and values of various network former oxides. The effects of cluster formation and complexes are not considered here, although they may contribute significantly to nonlinear volumetric-compositional relations (for example, Bockris et al., 1956; Nesbitt & Fleet, 1981; Toplis, 2001).
The large positive N values of TiO2 and Fe2O3 (fig. 8C) may be related to change from higher to lower CN (Guo et al., 2013; Henderson et al., 2003; Liu & Lange, 2006). As previously noted, changes to CN affect packing, as apparent from lattice packing of corner-linked tetrahedra compared with edge-shared octahedra (Rossano et al., 2000). Theoretical considerations have considered packing efficiencies in disordered materials, yielding tetrahedral and octahedral packing efficiencies of ~39% and ~92% respectively (Chaikin, 2007; Hoylman, 1970; Song et al., 2008). Two aspects concerning changes to CN are now addressed.
5. COORDINATION CHANGES IN MELTS
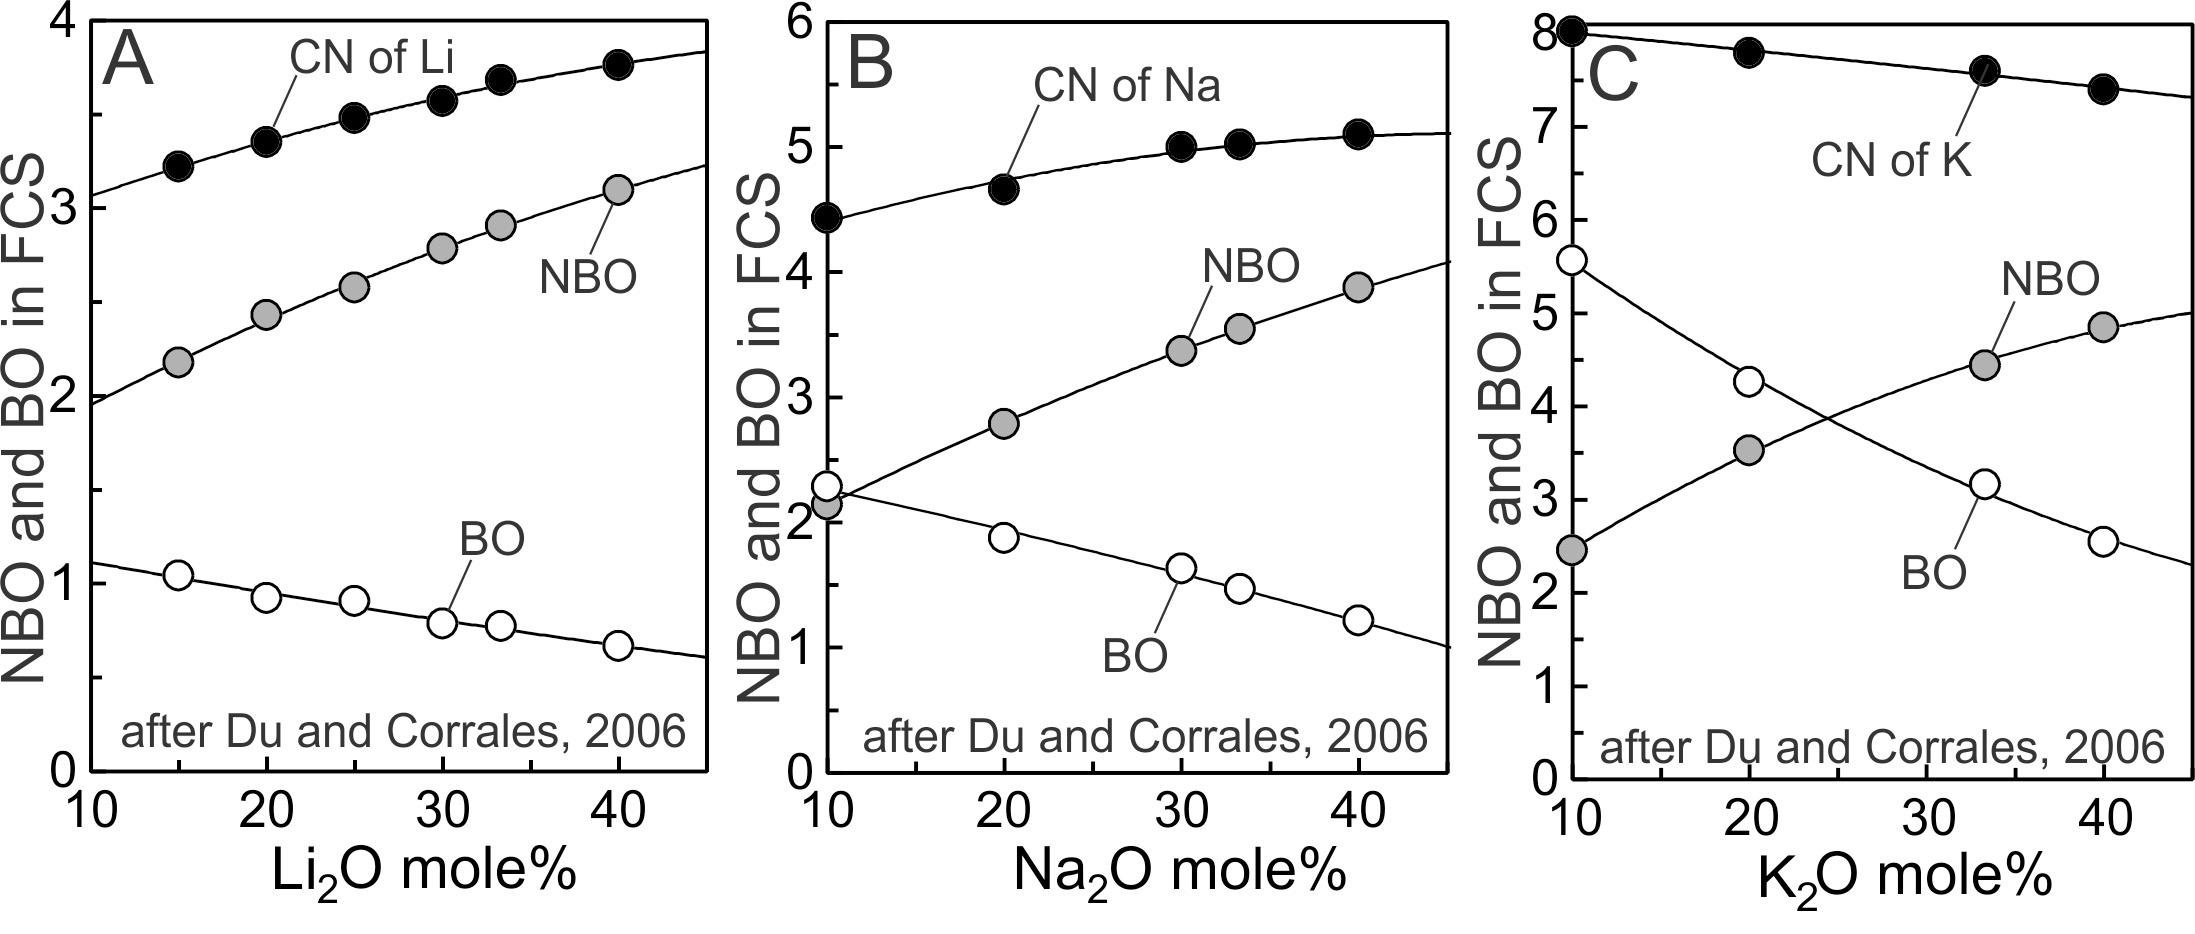
Some 3d and 4f metal oxide components display more than one CN and N value (tables 2 and 3), examples being ZnO, FeO, Fe2O3 and TiO2 (figs. 8B, 8C). Questions thus arise concerning why and how CNs of oxide components change in melts and glasses, and what effect the changes have on N. Noting that the lower limit of N for 3d and 4f oxides coincides with the Coulombic trend defined by the alkali and alkaline earths (Fig. 8A, 8B), we focus on properties of the first coordination sphere (FCS) of the alkalis in an attempt to understand better, aspects affecting CN and N of modifier cations, including 3d and 4f cations. Hess (1996) emphasized that “cations are coordinated not only to NBOs, but to BOs as well”. This becomes apparent by considering a trace amount of a mono or divalent modifier oxide dissolved and well dispersed in SiO2 melt. Each monovalent cation produces one NBO− upon dissolution. If the cation were tetrahedrally coordinated, then three BOs would be incorporated into its FCS to achieve 4-fold coordination. Divalent cations produce two NBO− in a siliceous melt. If the CN of the cation were 6, then as many as 4 BOs would be incorporated into its FCS. Molecular dynamics calculations on siliceous Li, Na and K glasses are illuminating (Du & Cormack, 2004; Du & Corrales, 2006). Results of the 2006 study are plotted on figure 9. Each alkali is coordinated to both NBO and BO, and the ratio changes as a function of melt composition. Figure 9 also shows that the greater the CN of the cation the greater the fraction of BO contributing to the FCS. Modifier cations of crystals are also coordinated to both NBO and BO, as in -Na2Si2O5, -Na2Si2O5 and Na2SiO3 (Ching et al., 1983 and references therein), and Li2Si2O5 and Li2SiO3 crystals (Ching et al., 1985). In the sodic crystals, and in melts and glasses, Na bonded to BO (at equilibrium bond distances) results in the BO being 3-fold coordinated (two Si-BO bonds and one Na-BO bond). The 3d and 4f cations likewise should incorporate both types of oxygen into their FCS at least in highly siliceous glasses because there are insufficient NBOs to fully coordinate the modifier cations (Hess, 1996). From these observations we conclude that most, if not all, modifier cations incorporate both BO and NBO into their FCSs in siliceous melts and glasses. Electron densities on bridging and nonbridging oxygens are different (Brückner et al., 1980; Ching et al., 1983; Nesbitt et al., 2015; Nesbitt, Henderson, et al., 2017), which requires the partial charges on each to be different. We here investigate the consequences of differing partial charges on BO and NBO of modifier cation polyhedra and their effect on CN. We then introduce a mechanism by which CNs of these cations may be altered.
_and_number_of_bo_and_nbo_atoms_in_the_.jpg)
5.1. Effects of NBO and BO partial charges
XPS studies demonstrated that the partial charges on BO and NBO differed, with the greater negative charge resident on NBO (Brückner et al., 1980; Ching et al., 1983, 1985; Hsieh et al., 1994; Nesbitt et al., 2015; Nesbitt, Henderson, et al., 2017). They also demonstrated that the charges on NBO and BO become more negative with increased alkali oxide content. With this information as guide, we propose a means by which CNs of modifier cations may change as a function of NBO and BO content of melts and glasses.
Guo et al. (2013) demonstrate that increases and FeO decreases in Fe-silicate melts to which CaO is added. They attribute these to topological changes associated with production of Q3 species at the expense of Q4 species, or alternatively, production of NBO at the expense of BO. We focus on NBO and BO. Two moles of NBO are produced per mole of Fe2+ dissolved in a melt. The CN of Fe2+, however, ranges from ~6 to ~4 (Guo et al., 2013) thus in siliceous melts or glasses, and as previously argued, both NBO and BO likely are present in the first coordination sphere of Fe2+. Progressive addition of FeO to a silicate melt decreases the ratio of O:Fe from, for example, 5:1 in FeSi2O5 to 2:1 in Fe2SiO4 melt, due primarily to the decrease of BO contributed by SiO2. Addition of CaO to a Fe-silicate melt causes the O:Fe ratio to decrease still more, resulting in competition between Fe and Ca for O atoms required to establish their coordination spheres. One response to the competition is to share O atoms by establishing shared edges of Fe and Ca polyhedra, such as observed by Rossano et al. (2000).
Where both BO and NBO are present in FCSs of modifier cations, there is another means by which Fe2+ polyhedra may adjust to competition for O atoms. The partial charges on NBO and BO atoms are about −0.96 and −0.64 respectively in Na disilicate glass (Hsieh et al., 1994). The greater charge density on NBO has been confirmed by others (Brückner et al., 1980; Ching et al., 1983, 1985; Nesbitt et al., 2015; Nesbitt, Henderson, et al., 2017). Also, the charge on BO is supported by MD simulations of Demiralp et al. (1999). The greater negative charge on NBO favors its incorporation (over BO) into the first coordination sphere (FCS) of cations. The ionic radius of Fe2+ is ~0.92Å in 6-fold coordination and ~0.77Å in 4-fold coordination whereas the radius of Ca2+ is ~1.26Å (Huheey et al., 1993). Fe2+-NBO Coulombic attraction consequently is stronger than Ca2+-NBO attraction at equilibrium bond distances. NBOs produced upon dissolution of CaO in Fe-silicate melts thus will be attracted more to the FCS of the smaller Fe2+ than to that of the larger Ca2+. There is an important implication. Consider a Fe2+ coordination sphere consisting of 2 NBOs and 4 BOs. Its total charge is −4.48 (2[−0.96]+4[−0.64]). Replacement of three BOs by two NBOs leaves the total charge of the FCS unchanged at −4.48. Its CN has decreased from 6 to 5, as observed by Guo et al. (2013). Competition between Fe2+ and Ca2+ for O atoms thus may be resolved by Fe2+ shedding BOs while incorporating additional NBOs into its coordination sphere, thereby decreasing by one its CN. The BO lost may be incorporated into the FCS of a Ca2+. Competition for O atoms by modifier cations, coupled with the difference in charges on NBOs and BOs provides an explanation for changed CNs of Fe2+ in response to CaO dissolution in Fe-silicate melts. Uchino and Yoko (1999, p. 1857, last paragraph) came to the same conclusion from their ab-initio molecular orbital calculations on Li- and Na-silicate clusters. Their calculations indicated that the smaller Li atom bonded preferentially to NBOs for energetic reasons. Na (the larger cation) by contrast was coordinated to proportionally fewer NBOs and to proportionally more BOs. Shimoda et al. (2007) provide an example where Mg coordination decreases from 6 in MgSiO3 glass to 5 in Mg2SiO4 glass. We suggest that destabilization of Mg sites by a decrease in CN is compensated for by an increased proportion of NBO in its first coordination sphere.
The change in CN (VIFe to VFe) results in less efficient packing (Hoylman, 1970; Song et al., 2008) and a greater (table 2). Where the change occurs at constant temperature, FeO must increase (eq 2), all changes being driven by progressive dissolution of CaO in the Fe silicate melt. The process should affect preferentially CNs and N of small cations in melts containing large cations. Al3+, Fe3+ and Ti4+ are likely candidates to undergo CN reduction. MD calculations can be used to test the process by checking NBO:BO ratios in FCS of cations and correlating them with CNs of the cations. The MD code must, however, allow charges to be readjusted with change in melt topology, as did Demiralp et al. (1999).
_illustrates_the_geometric_relationships_between_the_o-si-o_angle_of_a_tetrahedron_and.jpg)
5.2. A mechanism to change CN of cations
To decrease a CN by one, a M-O bond must be ruptured to extract an O atom from the FCS of M. An obvious mechanism would be for a tetrahedron to migrate away from the modifier cation, thereby removing an O from the FCS. The energetic cost likely would be similar to that associated with viscous flow. There is an energetically more favorable mechanism where no tetrahedra need to be ‘displaced’ beyond the second coordination sphere of the modifier cation.
A triangular section through a Si tetrahedron with an idealized O-Si-O angle of 109.45° and a Si-O ionic bond length of 1.61Å is illustrated in figure 10A. Its solution yields an O-O distance of 2.63Å, as obtained by Du and Corrales (2006, their table 7). Consider a K+ bonded to the two O atoms separated with the equilibrium K-O bond length. Accepting a VIIIK-O ionic bond distance of 2.86Å (Huheey et al., 1993, table 4.4), the O-K-O bond angle of figure 9A is calculated to be 54.7°. Du and Corrales (2006) documented the bond angle frequencies from their MD simulations and they obtain the greatest frequency at ~50° (fig. 10B, asterisk). The ~50° bond angle is expected where two O atoms of the same Si tetrahedron are bonded to one K+ as shown in figure 10A. The arrangement should be stable in that the O-Si-O tetrahedral angle is little strained and all bond distances are equilibrium values. The same calculation is performed on sodic glasses. Du and Corrales (2006) reported Na to be ~5-fold coordinated in Na-disilicate glass. The VNa+-O ionic bond length is 2.35Å (Huheey et al., 1993). With this Na-O bond length and an O-O bond distance of 2.63Å (fig. 10A), an O-Na-O bond angle of 68.1° is obtained by solving the O-Na-O triangle. The MD simulations of Du and Corrales (2006, their fig. 10b) yielded a strong bond angle frequency at ~60°. It is the angle expected where one tetrahedron contributes two O atoms to the first coordination sphere of Na+. In support, Du and Cormack (2004) had already noted that the small angle peaks in Na-silicate crystals arise from the arrangement. The O-M-O bond angle agreement is reasonable for K, and somewhat less so for Na. The results demonstrate that individual tetrahedra may contribute two O atoms to the first coordination sphere of modifier oxides of size similar to or greater than Na+.

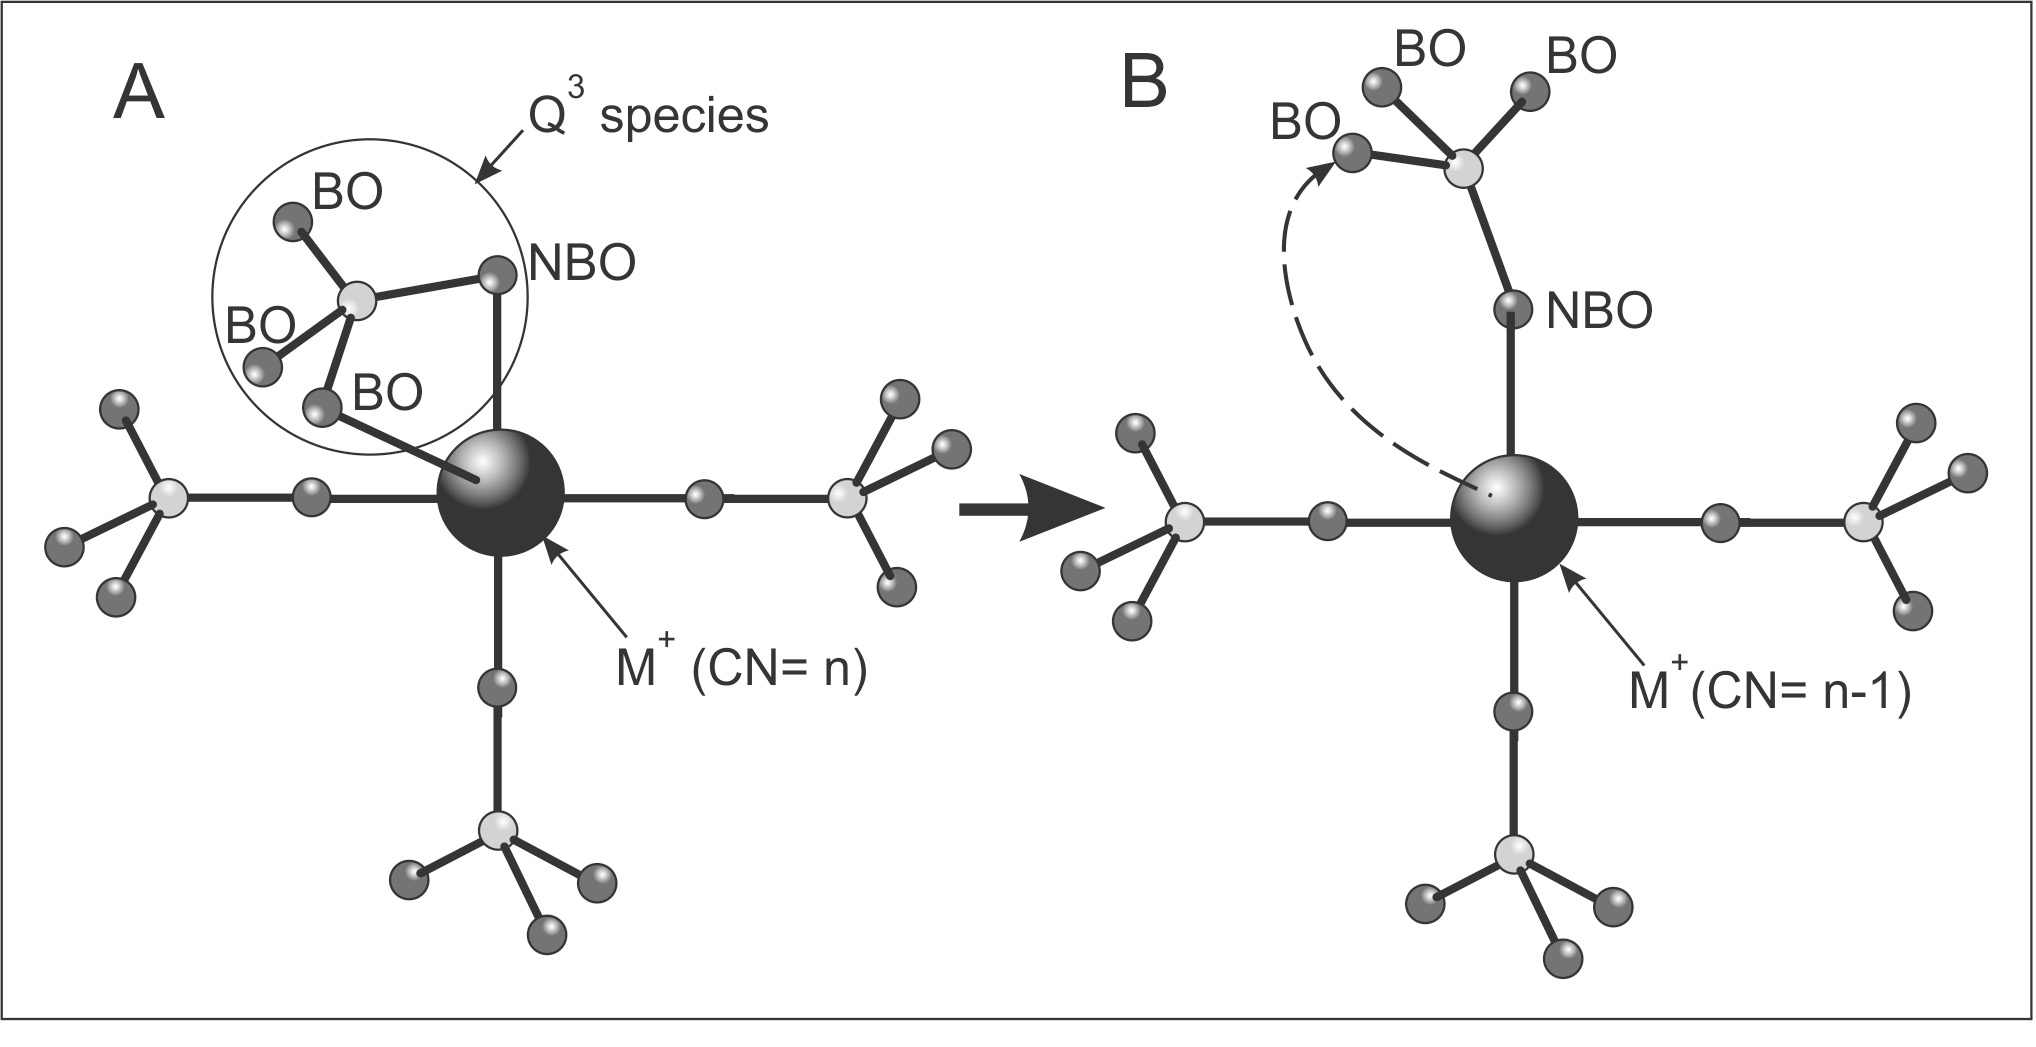
Figure 11A is a schematic diagram of a modifier cation (M) coordinated to ‘n’ O atoms, of which four O atoms are illustrated. The Q3 species contributes a NBO and BO to the first coordination sphere of M (fig. 11A). With the partial charge on BO being less than that on NBO, the BO-M bond is weaker than, and is more likely to dissociate than the NBO-M bond. With rupture of the BO-M bond, BO may rotate away from M (fig. 11B, dashed arrow) thereby decreasing the CN of M by one with no change to the Si content of the second coordination sphere of M. Repeated rupture and re-formation of the BO-M bond results in a non-integer CN value of M averaged over time. Where a NBO approaches M, it may form a NBO-M bond displacing a BO-M bond. As NBO accumulates in the first coordination sphere of the modifier cation its CN may decrease by preferential loss of BOs, as argued in the previous section.
6. CONCLUSIONS
Integration of the differential form for the coefficient of thermal expansion (eq 1) to obtain a logarithmic expression in volume and temperature (eqs 2, 4, 6) simplifies quantification of values and should provide more accurate values of melts (and their components) than do traditional methods. A thermodynamically rigorous equation is developed (eq 11) by which to check values of components of melts or glasses against experimentally determined values of a bulk melt or glass. The equation provides a severe test of the accuracy of partial values of the constituent components of melts and glasses.
The coefficients of thermal expansion of alkali and alkaline earths oxides in siliceous melts are determined primarily by the strength of the Coulombic force of attraction between the cation and oxygen ion. The oxide with the weakest attraction (Cs2O) has the greatest expansivity of the Group 1 and 2 metal oxides whereas that with the strongest Coulombic interactions has the smallest expansivity (MgO). The coefficients of thermal expansion of a few 3d (MnO for example) and 4f metal oxides (Dy2O3 and Ho2O3) also seem to be controlled by the Coulombic force of attraction, but N for the majority of both groups likely are determined by changes to CN. The N values of network formers apparently are determined by changes to CN yielding both large positive and negative values and to electrostriction.
The partial charges on NBO (−0.96) and BO (−0.64) affect their ratio in the first coordination sphere of Na+ (and other modifier cations) as well as affecting the CN of a modifier cation. The greater the number of NBOs in the coordination sphere of a modifier cation, the lower its CN may be. These partial charges also influence, indirectly, the mechanism by which CNs of cations are altered. By the mechanism proposed, changes to the CN of a modifier cation involve only rotation or tilting of Si tetrahedra contributing O atoms to the first coordination sphere of a cation. No disruption to the second coordination sphere (Si atoms) of the modifier cation need occur during changes to CN of the modifier cation.
ACKNOWLEGMENTS
The authors thank Drs. R. Sack, F. Spera, P. Asimow and Dr. Ague for detailed reviews of the manuscript. Their insight and comments resulted in great improvement to the final product. We extend special thanks to Dr. S. Talman for advice concerning clarification of mathematical aspects. We also thank Drs. J. Ague, (associate editor of the journal) and M. Brandon (editor) for providing valuable suggestions and guidance which improved substantially the manuscript. We thank our respective departments and universities for the logistical support required to conduct this study.
Editor: Mark T. Brandon, Associate Editor: Jay Ague