1. INTRODUCTION
During the Cretaceous, major perturbations to the global Earth system led to intervals of ocean deoxygenation (Arthur et al., 1987; Arthur & Sageman, 1994; Jenkyns, 1980; Schlanger & Jenkyns, 1976). One of the common features of these Oceanic Anoxic Events (OAEs) was enhanced burial of organic carbon (Corg). During OAE2 (Cenomanian-Turonian, ~94 Ma), widespread deposition of organic-rich marine sediment occurred, accompanied by a positive carbon isotope excursion (CIE; Scholle & Arthur, 1980). Enhanced organic carbon burial was an ultimate consequence of extreme greenhouse conditions during the Cenomanian-Turonian (Barron, 1983). High global temperatures were linked to large igneous province (LIP) emplacements (Leckie et al., 2002) and elevated volcanic degassing (Arthur et al., 1985; Huber et al., 1995; Jones et al., 2021; Kuroda et al., 2007; Larson, 1991), and thus increased atmospheric CO2 concentrations (Forster et al., 2007; O’Brien et al., 2017; Robinson et al., 2019; Sinninghe Damsté et al., 2010).
Long-term sea-level rise, starting in the early Cretaceous and reaching its high stand in the early Turonian (Haq, 2014; Schlanger & Jenkyns, 1976; Wilson et al., 2002), led to an expansion of epi-continental shelf areas, while an enhanced hydrological cycle (Huber et al., 2002) promoted an increased supply of weathered material and nutrients to coastal areas (Arthur & Sageman, 1994; Jenkyns, 2010; Pogge von Strandmann et al., 2013; Poulton et al., 2015), especially in low latitude locations (Beckmann et al., 2005). High primary productivity in surface waters led to enhanced burial of organic matter (OM) and the global positive CIE (Bowman & Bralower, 2005; Jarvis et al., 2011; Scholle & Arthur, 1980; Tsikos et al., 2004; Voigt et al., 2006).
Ocean circulation patterns also changed during the mid-Cretaceous (Ladant et al., 2020; Poulsen et al., 2001; Robinson & Vance, 2012; Trabucho Alexandre et al., 2010), especially within the semi-restricted proto-North Atlantic. With the deepening of existing connections to the Tethys and Pacific Ocean, and the opening of the Equatorial Atlantic Gateway, a connection between the proto-North Atlantic and the South Atlantic was created (Donnadieu et al., 2016; Dummann et al., 2023; Friedrich & Erbacher, 2006; Poulsen et al., 2001; Ruvalcaba Baroni et al., 2014; Trabucho Alexandre et al., 2010). However, due to a lack of deep water connection and an assumed reduced turnover rate, water within the proto-North Atlantic basin was already low in oxygen compared to the Pacific Ocean (Monteiro et al., 2012). Conditioned by paleogeography, the increasing temperatures and enhanced nutrient input turned the proto-North Atlantic basin into a large-scale nutrient trap (Trabucho Alexandre et al., 2010). This promoted primary productivity in the surface waters of basins and coastal areas, leading to enhanced water column deoxygenation (Monteiro et al., 2012; Trabucho Alexandre et al., 2010).
Black shale deposition was particularly pronounced in the proto-North Atlantic during OAE2 at the Cenomanian/Turonian (C/T) boundary (~93.5 Ma; Jenkyns, 2010). The semi-restricted setting created optimal conditions for the deposition of organic rich sediments, as indicated by the coeval onset of a positive CIE and enhanced Corg burial (Jenkyns, 2010; Kuypers et al., 2002; Tsikos et al., 2004). However, some locations document the deposition of Corg-rich black shales before the onset of the global isotope excursion, pointing to the earlier regional development of dysoxic-anoxic conditions (Eldrett et al., 2014; Monteiro et al., 2012; Westermann et al., 2014). This was particularly the case in the Tarfaya basin, a marine shelf setting at the NW margin of Africa, which was a major site for Corg burial before, during and after OAE2 (Kolonic et al., 2005; Kuhnt et al., 1990). Here, independent organic and inorganic redox proxies (biomarkers, Fe-S systematics and redox-sensitive trace metal patterns) document expanded intervals of anoxic-sulfidic (euxinic) water column conditions, where euxinia periodically reached the base of the photic zone (Goldberg et al., 2016; Kolonic et al., 2005; Kuypers et al., 2002; Poulton et al., 2015; Sinninghe Damsté & Köster, 1998). However, a higher resolution study of the early stages of OAE2 at Tarfaya demonstrated that euxinia was periodically interrupted by the development of ferruginous (anoxic, Fe(II)-containing) conditions, linked to orbitally-driven changes in weathering inputs of reactive Fe and sulfate (Poulton et al., 2015).
The depositional model of Kolonic et al. (2005) suggests that enhanced trade winds controlled by eccentricity led to continental upwelling of nutrient-rich and oxygen-depleted water from deeper parts of the proto-North Atlantic, fuelling surface productivity. However, an additional driver for elevated productivity was extensive recycling of phosphorus (P) from the sediment into the water column, which occurred under both euxinic and ferruginous conditions (Poulton et al., 2015). Indeed, the highest burial of P occurred just before the onset of OAE2, as documented in the Tarfaya Basin (Kraal et al., 2010; Mort et al., 2007), as well as in other shallow and deep locations in the proto-North Atlantic (Hetzel et al., 2009; van Helmond et al., 2014), Tethys and the Western Interior Seaway (WIS; Mort et al., 2007). This likely occurred due to the onset of enhanced weathering inputs, while P recycling from the sediments then decreased the burial of P in the overlying strata (Kraal et al., 2010; Mort et al., 2008; Poulton et al., 2015).
While the onset of OAE2 at Tarfaya has been well-studied, the termination and recovery have received little attention, and thus the drivers controlling the cessation of OAE2, both on a regional and global scale, remain debated. To address this, we present a high-resolution reconstruction of the recovery phase of OAE2 in the highly dynamic Tarfaya basin, which was a region particularly prone to the development of anoxia. With the use of a multi-proxy approach, we reconstruct local redox conditions and P recycling on short timescales, providing new insight into general controls on the termination of past, and potentially future, ocean deoxygenation events.
2. GEOLOGICAL SETTING AND SAMPLE MATERIAL
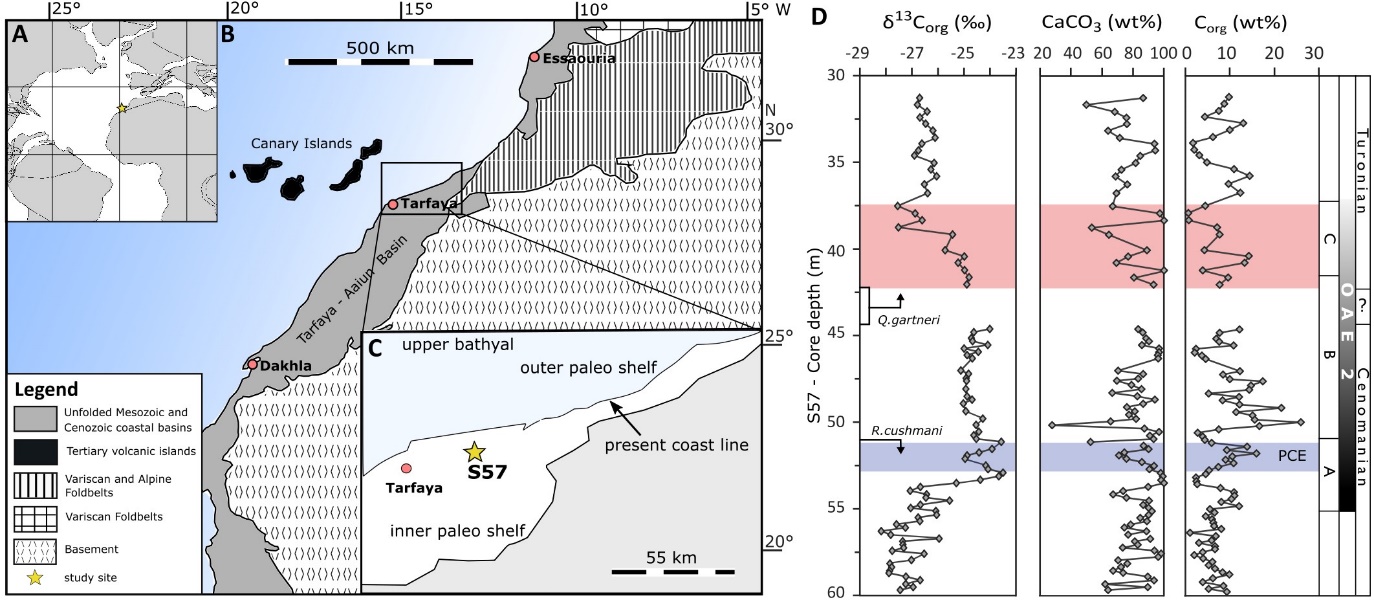
The Tarfaya basin is located on the NW African Atlantic margin (fig. 1A and B), where upper Cretaceous sediments reach a total thickness of ~700 m, and consist of dark-grey, laminated, organic-rich sediments alternating with carbonate-rich sections without lamination (Leine, 1986). In the mid-Cretaceous, the basin was a marine shelf setting open to the proto-North Atlantic, located at a latitude of ~15°N (Kolonic et al., 2005; Kuhnt et al., 2009; Lüning et al., 2004). The sedimentary succession records a complete and expanded OAE2 sequence with a total thickness of 17 m, and high accumulation rates during OAE2 allow paleo-oceanographic and geochemical investigation at centennial scale (Kuhnt et al., 2001). The sediment matrix is composed of micrite, faecal pellets and coccoliths, with occasional shell fragments and fish remains (Leine, 1986). Core samples were obtained from site S57 (fig. 1C), located near the shelf centre in the deepest part of the basin (~250–300 m paleo-water depth; Kuhnt et al., 2005; see Supplementary Information for more details of previous work on this location).
The sedimentary rocks from core S57 record the positive CIE characteristic of OAE2, showing an increase in the isotopic composition of Corg (δ13Corg) from −27.1 to −23.6‰ in phase A (onset and initial peak), followed by phase B (plateau), where δ13Corg is maintained at −24.6 ± 0.4‰ (fig. 1D). Phase C captures the recovery from the CIE, with δ13Corg dropping to about −27.8‰ (Kolonic et al., 2005; Tsikos et al., 2004). The sedimentary succession dominantly comprises calcareous mudstones with CaCO3 generally >60 wt% (fig. 1D). Organic carbon contents range between 2–10 wt% before the onset of OAE2, then increase to ~16 wt% in phase A and up to 26 wt% in phase B (fig. 1D). Our focus is on the end of phase B and phase C, between 42.0 m and 37.5 m core depth, which has a maximum Corg content of ~15 wt%, while CaCO3 ranges between 40 and 95 wt% (fig. 1D).
The investigated section shows no signs of turbidites, but some layers show shallow bioturbation at the centimetre scale (at 41.64–41.59 m, 40.94–40.91 m, 40.71–40.68 m and 37.57–37.55 m, fig. S2). The first occurrence (FO) of the nannofossilmarker Quadrum gartneri is used as a stratigraphic tool to locate the C/T boundary (Tsikos et al., 2004). However, for S57, missing sample material between 44.50 m and 42.04 m core depth likely coincides with the FO of Quadrum gartneri, placing the C/T boundary somewhere within this interval (fig. 1D). Based on sedimentation rates reported by Kuhnt et al. (1997), a duration of ca. 400 ka has been calculated for phases A and B of OAE2, while the duration of phase C was ca. 140 ka. The recovery in the δ13Corg signal during phase C is characterized by a slow decline (fig. 1D).

3. METHODS
Core samples were taken at 1 cm resolution and every second sample was analyzed after crushing in an agate mill. Total sulfur (Stotal), total carbon (Ctotal) and Corg were determined on a LECO C/S analyser. For Corg, samples were pre-treated with 10% (v/v) HCl to remove carbonate phases, and total inorganic carbon (TIC) was calculated as the difference between Ctotal and Corg. Replicate analyses of internal standards (LECO soil standard 502–982 with a carbon content of 22.7 ± 0.3 wt% and a S content of 0.321 ± 0.012 wt%; all errors are reported to 1σ) gave relative standard deviations (RSDs) of 1.5% for Corg, 1.1% for Ctotal, and 6% for Stotal. Organic carbon isotopes were obtained using an Isoprime continuous flow mass spectrometer. The analyses were measured against a CO2 reference gas and results are given in δ notation calibrated to the Vienna-Pee Dee Belemite (V-PDB) scale using UREA and sucrose laboratory standards of known and calibrated isotopic composition (UREA by Merck with δ13Corg= −46.83 ± 0.22‰; Silver Spoon sucrose (commercial) with δ13Corg= −26.19 ± 0.10‰; T&L sucrose (commercial) with δ13Corg= −11.93 ± 0.24‰). Standard reproducibility given by repeat analyses of the internal sucrose standard was better than 0.1‰. Sulfur isotopes were measured on Ag2S precipitates (δ34Spy) from the chromous chloride extraction (see below) at 4 cm resolution. The results given in δ notation were calibrated to the international Vienna-Canyon Diablo Troilite (V-CDT) scale using a seawater laboratory standard (SWS-3) and a chalcopyrite inter-laboratory standard (CP1). These standards have known isotopic compositions of δ34S = +20.3‰ and δ34S = −4.56‰, respectively, which were calibrated using the international standard IAEA S-3, with an assigned δ34S value of −32.06‰. Replicate analyses of all laboratory standards gave a precision of better than 0.2‰.
The total concentration of major and trace elements (Fe, Al, P, K, Na, Mo, U) were determined after an acid digestion (HNO3-HF-HClO4) of ground sediment samples ashed at 550°C. Major element concentrations were determined by ICP-OES, and trace elements were determined by ICP-MS, with RSDs of ≤2.9% and ≤4.3%, respectively. Accuracy was determined relative to an international standard (Green River Shale, SGR-1), with 96 ± 5% for major elements and 93 ± 6% for trace elements.
Enrichment factors (EF) provide a useful way to consider trends in redox-driven trace metal draw down (for example, Algeo & Tribovillard, 2009; Tribovillard et al., 2006), and are commonly calculated as:
ElementEF=Element/AlElementUCC/AlUCC
where UCC represents upper continental crust (for example, Wedepohl, 1995), although other compilations for average shale values can be used (Tribovillard et al., 2006). However, application of EF values to sediments rich in carbonate (and silica) is problematic, since the low detrital Al component typical for such (bio)chemical sediments leads to artificially elevated EF values relative to siliciclastic sediments (Tribovillard et al., 2006; Van der Weijden, 2002). One way around this problem is to consider excess element concentrations, which can be calculated as:
Elementexcess=Elementsample−(Alsample×ElementUCCAlUCC)
However, while useful, excess trace metal values lack the utility of EF values as they provide no information on the relative degree of enrichment, and also cannot be directly compared to established techniques for identifying different paleoredox conditions (for example, MoEF vs UEF crossplots; Tribovillard et al., 2012). To overcome these problems, we developed a new approach to calculate EF values for our carbonate-rich sediments by first calculating ‘excess’ trace metal values (eq 2), which we then use to calculate revised EF values (EF*):
ElementEF∗=Elementexcess+ElementUCCElementUCC
This approach overcomes the problem of low Al contents in chemical sedimentsand allows EF* values to be directly compared to EF values calculated for siliciclastic sediments.
Iron speciation analyses were performed via standard techniques (Poulton, 2021; Poulton & Canfield, 2005) as detailed in table 1A. Steps I-III were performed sequentially, and Fe concentrations were determined by AAS. Steps IV and V were conducted on separate sample splits to determine sulfide-bound Fe (Canfield et al., 1986), where the mass of sulfide was determined stoichiometrically. The RSD for each extraction step is given in table 1, with accuracy (95 ± 2%) ensured relative to an international reference material (WHIT; Alcott et al., 2020). The total amount of Fe considered highly reactive towards sulfide (FeHR) is given by FeHR = Fecarb + Feox + Femag + Fepy, where Fecarb represents Fe associated with carbonate minerals such as ankerite and siderite; Feox represents Fe (oxyhydr)oxide minerals such as ferrihydrite, goethite and hematite; Femag represents magnetite; and Fepy represents pyrite (Poulton, 2021; Poulton & Canfield, 2005, 2011). Note that acid volatile sulfide (FeAVS) was below detection (<0.001 wt%) in all cases and is therefore not included in the FeHR calculation.
The SEDEX sequential extraction method (Ruttenberg, 1992; Thompson et al., 2019) quantifies four P-bearing phases in six sequential extraction steps (details given in table 1B), including: (1) P bound to easily reducible Fe (oxyhydr)oxides (PFe1), crystalline Fe (oxyhydr)oxides (PFe2) and magnetite (Pmag), with these phases combined to give PFe; (2) P associated with authigenic carbonate fluorapatite, biogenic apatite and P bound to CaCO3 (Pauth); (3) P in detrital apatite (Pdet); and (4) organic-bound P (Porg). The P concentration was determined spectrophotometrically via the phosphomolybdate blue method (Strickland & Parsons, 1972) for Pauth and Pdet, or by ICP-OES for PFe and Porg. The total recovery of P, calculated as the sum of all extracted P phases relative to the bulk concentration (PT), was 90.5 ± 5%, and RSDs are reported in table 1B (steps with higher RSDs reflect very low P concentrations in these pools). The Preac pool, which is considered potentially mobile and bioavailable during deposition and early diagenesis, was calculated as Preac = Pauth + PFe + Porg. Prior to the SEDEX method, a fish debris extraction (Schenau & De Lange, 2000) was applied on a set of samples to determine whether appreciable biogenic hydroxyapatite (Pfish) was present, which would complicate determination of Preac concentrations. Samples were washed with 2 M NH4Cl either 9 (n=30) or 12 (n=24) times. After each wash, P was determined spectrophotometrically.
We apply the Chemical Index of Alteration (CIA) proxy and K/Al ratios as indicators of the relative degree of chemical weathering on land. The CIA proxy is commonly calculated as CIA = [Al2O3/(Al2O3 + Na2O + K2O + CaO*)] × 100, where CaO* reflects the concentration of CaO in silicates (i.e., corrected for Ca in carbonates and apatite; Fedo et al., 1995). However, given the very high carbonate content of the Tarfaya section, we took the common approach for such sediments of instead calculating CIA*, where CaO* is omitted (Flögel et al., 2008). During chemical weathering, labile elements (such as Na, K) are preferentially dissolved relative to immobile elements (e.g., Al), leading to elevated CIA ratios (Nesbitt & Young, 1982). By the same logic, lower K/Al ratios in marine sediments can also indicate higher intensity chemical weathering (for example, Garzanti et al., 2014; Harnois, 1988; Zabel et al., 2001).
4. INTERPRETATIONAL FRAMEWORK
4.1. Redox Reconstruction
In this study we utilise a variety of independent inorganic proxies to assess redox and nutrient cycling in the Tarfaya Basin. Using Fe speciation, the pool of FeHR is normalised to total Fe (FeT) to allow comparison between different settings (Poulton, 2021; Poulton & Canfield, 2005, 2011). While it is well-established that, wherever possible, redox-sensitive proxies should be independently calibrated to the particular study area (Algeo & Li, 2020; Poulton, 2021), extensive calibration of Fe speciation in a wide variety of modern and ancient settings has led to general thresholds that provide a first line of evidence to distinguish oxic and anoxic depositional conditions (Clarkson et al., 2014; Poulton, 2021; Poulton & Canfield, 2011; Poulton & Raiswell, 2002; Raiswell et al., 2001, 2018; Raiswell & Canfield, 1998). In this regard, oxic water column conditions are commonly indicated when FeHR/FeT ≤0.22, in contrast to ratios ≥0.38, which commonly occur due to additional water column precipitation of FeHR phases under anoxic conditions (Raiswell & Canfield, 1998). Recognising that no strict threshold will satisfy all sedimentary environments, intermediate FeHR/FeT ratios (between 0.22 and 0.38) are considered equivocal (Poulton & Canfield, 2011).
The ratio Fepy/FeHR can then be used to distinguish between euxinic and ferruginous settings (for anoxic samples), whereby ratios above 0.6–0.8 may indicate euxinia (T. F. Anderson & Raiswell, 2004; Benkovitz et al., 2020; März et al., 2008) and ratios ≤0.6 imply ferruginous conditions (Poulton, 2021; Poulton & Canfield, 2011). Here, we note recent challenges to the use of Fe speciation as a paleo-redox proxy (Pasquier et al., 2022). Indeed, particular care needs to be taken when Fe speciation is applied to sediments with low Fe contents (<0.5 wt% FeT; Clarkson et al., 2014), sediments experiencing rapid deposition (for example turbidites; Canfield et al., 1996), and those in proximity to hydrothermal inputs (Raiswell et al., 2018) or directly adjacent to (sub)tropical mountainous regions, where highly weathered sediment may supply a high proportion of FeHR directly onto the continental margin (Wei et al., 2021), thus circumventing the preferential trapping of FeHR that usually occurs in inner shore environments (Poulton & Raiswell, 2002). However, in addition to calibration in modern environments (Canfield et al., 1996; Raiswell & Canfield, 1998), Fe speciation has also been extensively calibrated in ancient settings (Clarkson et al., 2014; Poulton & Raiswell, 2002; Raiswell et al., 2001), which by definition have undergone the early diagenetic modification that Pasquier et al. (2022) claim compromises the proxy as a paleo-redox indicator. Furthermore, as also extensively discussed in the literature, Fe speciation is best used in combination with other indications of water column redox chemistry (for example, redox-sensitive trace metal systematics; Poulton, 2021).
We therefore consider our Fe speciation data alongside detailed analyses of redox-sensitive trace element (RSTE) concentrations (for example, Algeo, 2004; Algeo & Lyons, 2006; Algeo & Tribovillard, 2009; Hetzel et al., 2009; Tribovillard et al., 2006) to provide the most accurate assessment of the chemical conditions of deposition. In oxygenated modern oceans, the conservative elements Mo and U mainly occur as soluble molybdate (MoO42−) and uranyl carbonate complexes (UO2(CO3)34−; Tribovillard et al., 2006). Sediments deposited under oxic to dysoxic conditions commonly show no U enrichment, but under reducing conditions, U may be enriched following reduction to U(IV) (R. F. Anderson et al., 1989; McManus et al., 2005). Importantly, U enrichments do not require the availability of sulfide (Zheng et al., 2002), and hence occur under both ferruginous and euxinic conditions. However, molybdenum displays contrasting behaviour, whereby under anoxic conditions in the absence of sulfide, moderate Mo enrichments may occur relative to U, via Mo drawdown through adsorption to Fe-Mn (oxyhydr)oxides in the water column (Algeo, 2004; Algeo & Lyons, 2006; Algeo & Tribovillard, 2009). In the presence of free sulfide, however, more extensive enrichments in Mo can occur via the formation and drawdown of thiomolybdate (MoOxS2−4−x), which has a high affinity to sinking particles (Algeo & Lyons, 2006; Erickson & Helz, 2000; Helz et al., 1996; Tribovillard et al., 2004).
Thus, sedimentary enrichments in U and (possibly) Mo, coupled with elevated FeHR/FeT ratios (≥0.38), are highly indicative of deposition beneath an anoxic water column. Euxinia is indicated by a high accumulation of Mo, coupled with high Fepy/FeHR ratios (in the range of 0.6–0.8 or above, for samples with FeHR/FeT ≥0.38). Enrichments in U coupled with low Mo and low Fepy/FeHR ratios (≤0.6, for samples with FeHR/FeT ≥0.38), indicate either ferruginous conditions or possibly weak euxinia, with moderately elevated Mo concentrations indicating moderate euxinia.
4.2. Phosphorus Cycling
The bioavailability of P, the ultimate limiting nutrient for primary productivity on geological timescales (Tyrrell, 1999), exerts a strong control on ocean productivity and is hence closely linked to Corg burial and ultimately oxygen production (Guilbaud et al., 2020; Poulton, 2017; Van Cappellen & Ingall, 1994). Dissolved P delivered to the ocean by weathering is largely deposited in association with Corg and Fe (oxyhydr)oxides (Ruttenberg, 2003). However, the biogeochemical behaviour of P is strongly dependent on the redox state of the water column and sediments (Bowyer et al., 2020; Ingall & Jahnke, 1994; März et al., 2008; Van Cappellen & Ingall, 1994). Under oxic conditions in the water column, up to 90% of OM is commonly decomposed, releasing P back to the water column (Ingall & Jahnke, 1997; Ruttenberg, 2014). Under anoxic conditions, organic P (Porg) may be preferentially released from OM relative to C during microbial remineralization (Ingall et al., 1993; Ingall & Jahnke, 1994). Additionally, P associated with Fe (oxyhydr)oxides is released during reductive dissolution, either via dissimilatory Fe reduction (Thamdrup, 2000) or via direct reaction with dissolved sulfide (Canfield, 1989; Poulton et al., 2004). The preferential release of P from OM leads to elevated Corg/Porg ratios (Algeo & Ingall, 2007; L. D. Anderson et al., 2001), relative to the average Redfield Ratio of 106:1 (L. A. Anderson & Sarmiento, 1994; Redfield, 1958).
Bioavailable P that is released into porewaters under both oxic and anoxic conditions may be partially transformed into authigenic P phases such as carbonate fluorapatite (Ruttenberg & Berner, 1993) or vivianite (Xiong et al., 2019), which is known as ‘sink switching’ (Slomp & Van Cappellen, 2007). Further, re-adsorption of recycled P on Fe (oxyhydr)oxides close to the redox boundary may lead to the additional retention of P in the sediment (Dellwig et al., 2010; Slomp et al., 1996). However, if free sulfide is present, either in the water column or in porewaters below an anoxic non-sulfidic water column, there is the potential for the dissolved P released via OM degradation and sulfide-promoted Fe (oxyhydr)oxide reduction to diffuse back into the water column (Van Cappellen & Ingall, 1994).
To provide detailed insight into the potential significance of P recycling versus fixation in the sediment, we determined Porg and Preac concentrations. The ratio Corg/Porg can be used to determine the extent of preferential P release during anoxic OM degradation (which gives high Corg/Porg ratios relative to the Redfield Ratio). By contrast, Corg/Preac ratios indicate the extent of P retention versus recycling, whereby values close to the Redfield Ratio indicate a low recycling efficiency, and elevated values indicate P recycling. In addition, Corg/Preac ratios below the Redfield Ratio indicate either additional P drawdown from the water column under anoxic conditions (for example, via adsorption to Fe (oxyhydr)oxides; Alcott et al., 2022; Guilbaud et al., 2020) or extensive OM oxidation and retention of the released P by microbial biomass under oxic conditions (Ingall & Van Cappellen, 1990).
5. RESULTS
5.1. Carbon Isotopes and Major Elements
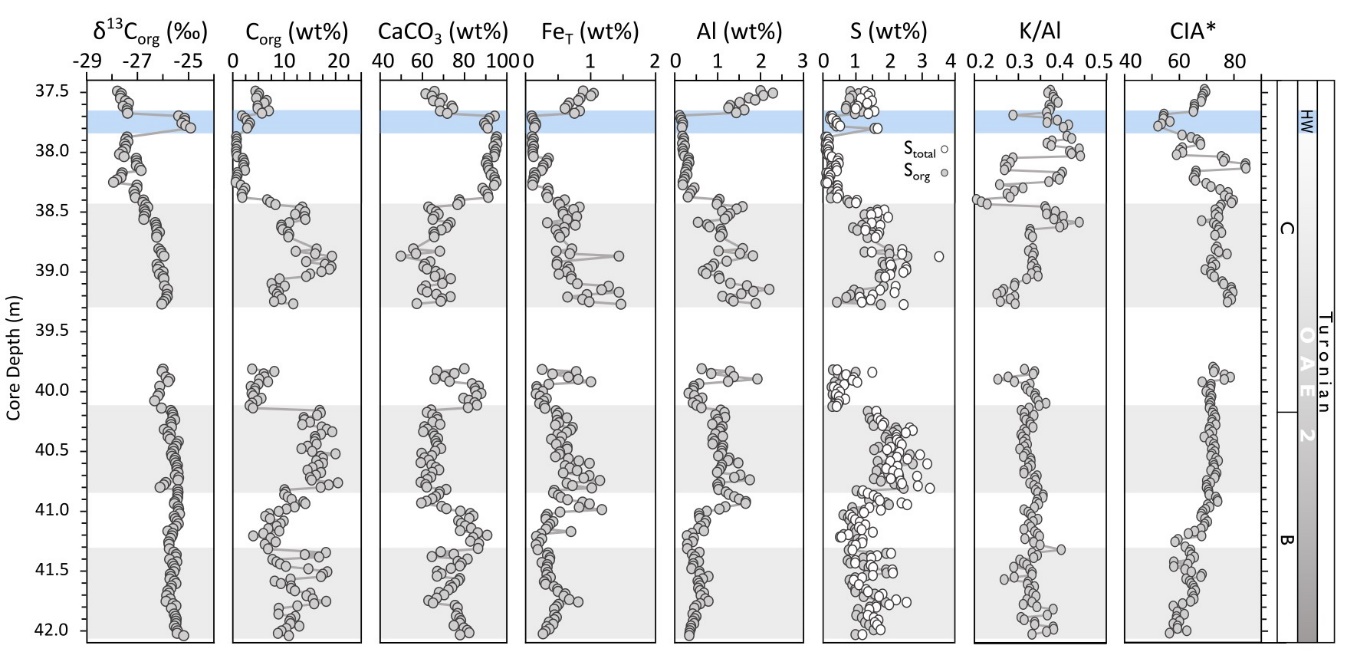
The end of phase B is defined by a gradual return in δ13Corg to pre-excursion values after the main phase of globally-enhanced Corg burial rates (Kuypers et al., 2002). Kolonic et al. (2005) placed the beginning of phase C at ~42.00 m depth (fig. 1D). However, our higher-resolution δ13Corg profile is relatively stable until 40.15 m depth, with an average of −25.6 ± 0.16‰ (fig. 2). The δ13Corg values then progressively decrease from −26.7‰ at 40.10 m to −27.9‰ at 37.49 m, thus placing the beginning of the recovery phase at 40.1 m (fig. 2). The decreasing trend is interrupted by a minor shift to more positive δ13Corg values (up to −26.9‰) at 38.15-38.05 m depth, and a larger, well-defined positive shift (up to −24.9‰) between 37.79–37.69 m (fig. 2).

Darker layers in core S57 have elevated Corg (5–20.5 wt%) and lower CaCO3 (50–75 wt%) contents, whereas lighter colored sections have higher CaCO3 (up to 98 wt%) and lower Corg (<5 wt%) contents (fig. 2). In general, Corg and carbonate contents are inversely correlated, suggesting that the observed trends are controlled by the relative rates of production of each phase. Aluminium concentrations vary between 0.1 and 2.3 wt% (average 0.84 ± 0.5 wt%), with lower values at the end of phase B and higher values with more variation during the recovery phase (fig. 2). Concentrations of Stotal vary between 0.1 and 3.5 wt% and follow the Corg trend. Organic S (Sorg), calculated as the difference between Stotal and pyrite S (assuming a negligible contribution from carbonate-associated S), shows that the majority of the total S is organically-bound (fig. 2). Concentration of K and Na are both low with a range of 0.03 to 0.84 wt% for K and 0.03 to 0.38 wt% for Na. While K shows a similar trend to Al, the concentration of Na is relatively stable throughout most of the section, with higher values in the uppermost 10 cm of the core (see fig. S2). Values for CIA* range between 50 and 85, while K/Al ratios are relatively stable (0.33 ± 0.02), with a minor gradual decrease up-section (from ~0.38 to ~0.32, fig. 2).
5.2. Redox Proxies
Iron concentrations range from 0.1 to 1.5 wt% with only minor fluctuations (average 0.51 ± 0.28 wt%), with 54% of the samples falling below 0.5 wt% (fig. 2). Since the concentration of FeT is relatively low, care has to be taken when evaluating FeHR/FeT ratios (Clarkson et al., 2014). However, unlike most of the carbonate units analyzed by Clarkson et al. (2014), which consisted of relatively pure limestones and dolomites, the Tarfaya samples dominantly comprise calcareous organic-rich sediments, with both OM and CaCO3 constituting major diluting controls on elements such as Fe. Indeed, when calculated on a CH2O-free basis, FeT concentrations average 0.72 ± 0.46 wt%, with 62% of the samples having >0.5 wt% FeT. Furthermore, FeHR/FeT ratios are persistently elevated throughout the section, regardless of FeT concentration patterns. In addition, as discussed below, the interpretation of redox conditions based on FeHR/FeT ratios is entirely consistent with that based on UEF* values (as an independent indicator of water column anoxia), while the interpretation of Fepy/FeHR ratios is entirely consistent with that based on MoEF* values (as an independent indicator of water column euxinia). Thus, as argued by Poulton et al. (2015) for phase A of OAE2 at Tarfaya, the Fe speciation data for these calcareous organic-rich sediments can be considered to provide reliable redox information.
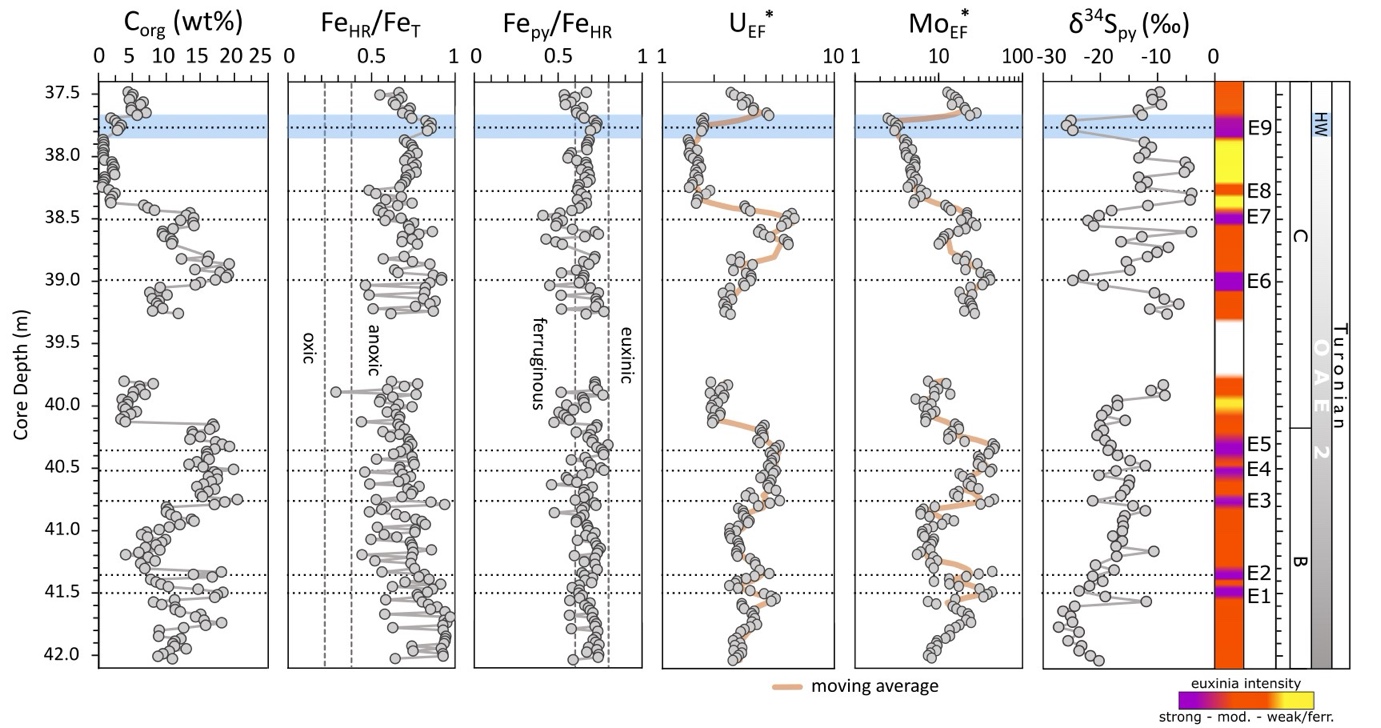
The ratio of FeHR/FeT ranges from 0.4 to 0.9 (n=185) with only one sample falling within the equivocal zone (fig. 3, detailed concentration for each Fe pool in fig. S7). The ratio of Fepy/FeHR varies between 0.4 and 0.8 (fig. 3). However, most samples (77%) fall within the 0.6–0.8 range. There is no correlation between the Fe extraction results and Corg contents (fig. 3).

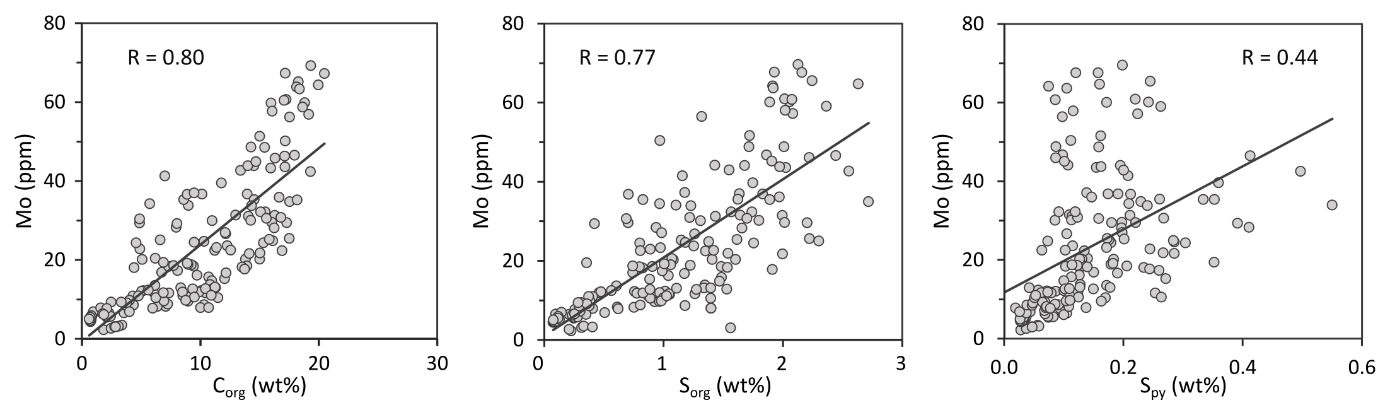
EF*s for U and Mo are variable (fig. 3) but are persistently high throughout the section. The lower part of the section, between 42.04 m and 39.90 m, shows broad systematic changes in U and Mo concentrations, but in the upper part of the section (39.40 to 37.48 m), alternations between higher and lower concentrations occur across shorter intervals. In general, Mo concentrations show a strong correlation with Corg and Sorg records, but a weaker relationship with pyrite-S concentrations (fig. 4). Enrichment factors are persistently elevated for both U (averaging 3.0 ± 1.0) and Mo (16.3 ± 11.3) (fig. 3). In general, the lower part of the section is characterized by the highest MoEF* enrichments, and the amplitude of the peaks progressively decreases in the upper part of the section (fig. 3). Enrichments in U show trends that are similar to Mo in the lower part of the section, but UEF* values do not show the same overall decrease in the upper part of the section (fig. 3).

The δ34Spy compositions show a wide range of values, between −27.3 and −4.0‰, but distinct trends in the data are apparent (fig. 3). The lower part of the section shows an overall increase from −27.3 to −8.7‰, with relatively little fluctuation, whereas the upper part of the section is characterised by larger, cyclical fluctuations (fig. 3).
5.3. Phosphorus
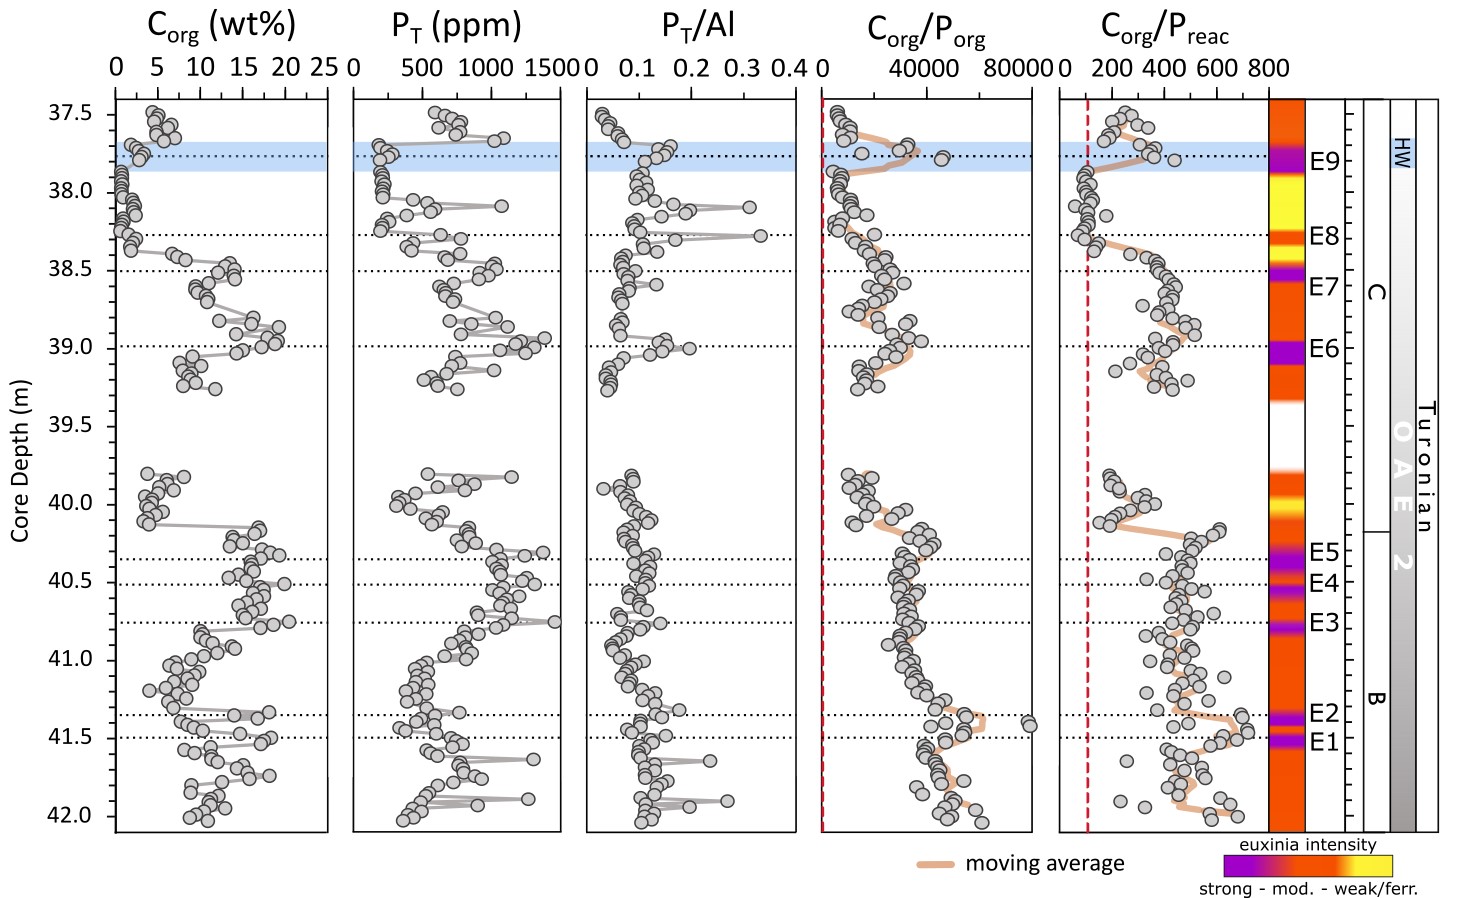
The total phosphorus concentration (PT) ranges between 184 and 1494 ppm, with the highest values occurring in Corg-rich intervals (fig. 5). These data give average PT/Al ratios of 0.1 ± 0.05 (in ppm/ppm), which is an order of magnitude higher than the UCC value of 0.01 (Wedepohl, 1995). In more detail, however, PT/Al ratios are generally relatively constant in the lower part of the section, while the upper part of the section is characterized by more frequent pulsed intervals of elevated PT/Al that are superimposed on an overall increasing trend, which is followed by a decrease at the very top of the section (fig. 5).

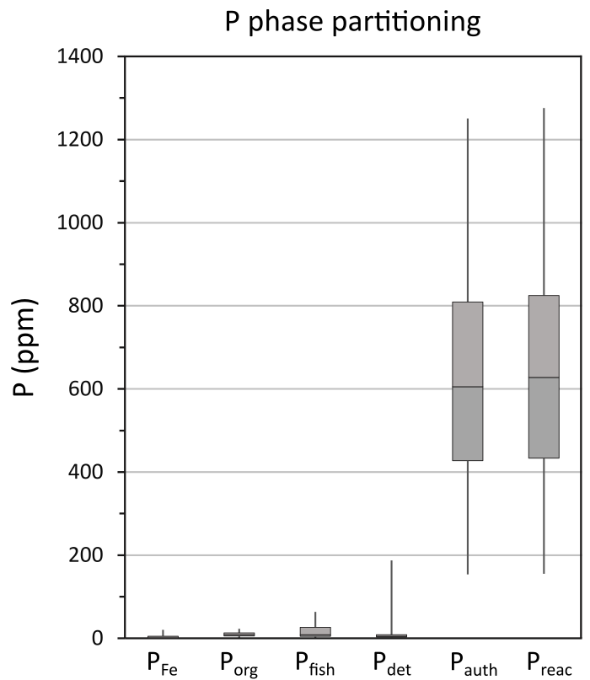
Data for the overall phase partitioning of P are displayed in figure 6. Concentrations of PFe, Pdet and Porg are low and generally relatively constant (fig. 6). The largest P pool is Pauth, with concentrations of up to 1250 ppm, representing an average contribution of 87 ± 6% to PT and 98 ± 1% to the Preac pool. The quantification of Pauth has the potential to be slightly overestimated as the extraction step may also include biogenic hydroxyapatite (fish debris) (Schenau & De Lange, 2000). We note, however, that Pfish comprises only 2.6 ± 3.2% of PT in the analyzed samples, suggesting a minimal contribution from fish debris (fig. 6), which is consistent with the results reported by Kraal et al. (2010). Molar Corg/Porg ratios are above the Redfield Ratio throughout the core, with exceptionally high values in the lower part of the section (fig. 5). This is followed by a general decreasing trend towards the top of the core, with values that approach those more commonly found in ancient euxinic marine settings (for example, Alcott et al., 2022; Dijkstra et al., 2018; Mort et al., 2010; Reinhard et al., 2017; Slomp et al., 2004), although very high Corg/Porg ratios return during the small positive δ13Corg isotope excursion at ~37.9–37.7 m depth (figs. 2 and 5).

Molar Corg/Preac ratios are relatively stable in the lower part of the section (on average 500 ± 119), but higher variability occurs above ~40.13 m, with ratios ranging between 61 and 511 (fig. 5). In general, an overall decreasing trend in Corg/Preac is apparent towards the top of the core. However, it is also worth noting trends in Corg/Preac ratios across the three intervals of particularly high carbonate content (>85% CaCO3) that occur between 37.87–38.37 m prior to the onset of the Holywell Event (HW; see below), 39.96–40.12 m and 41.19–41.32 m core depth (fig. 2). In the lowest carbonate-rich interval, which occurs during the latest stages of phase B when δ13Corg values are still high (fig. 2), Corg/Preac ratios (434 ± 81) are relatively high and indistinct from the surrounding background ratios (fig. 5). By contrast, in the middle carbonate-rich interval, which occurs as δ13Corg values start to slightly decrease, Corg/Preac ratios drop to lower values (263 ± 70), while in the upper carbonate-rich interval towards the end of the recovery phase, Corg/Preac ratios drop further, to values (110 ± 24) close to the Redfield Ratio (fig. 5).
6. DISCUSSION
6.1. Carbon-Sulfur Systematics
The high Corg contents that occur throughout most of phase C (up until ~38.50 m depth) indicate that high OM export was maintained in this region, despite the global recovery from the δ13Corg excursion. The decline in δ13Corg reflects the return to pre-OAE conditions, and thus the recovery from the carbon cycle perturbation on a global scale (Arthur et al., 1988), which in other, less productive sites occurs alongside a decrease in Corg concentrations (Eldrett et al., 2014; Gangl et al., 2019; van Bentum et al., 2009; van Helmond et al., 2014). The two short positive δ13Corg excursions between 38.15 and 37.69 m depth appear to represent perturbations to the system during the final stages of the recovery phase. While the first of these excursions has not been documented in other OAE2 locations, the second excursion equates to the Holywell Event, which was first documented by Jarvis et al. (2006) as a small CIE of 0.2‰ in Holywell Chalk. This positive δ13Corg excursion has since been recognized globally, with isotopic shifts varying between 0.5 and 2.5‰ (Gale et al., 2005; Hetzel et al., 2009; van Bentum et al., 2009; van Helmond et al., 2014; Voigt et al., 2008). In the Tarfaya section, a shift of ~2.5‰ is apparent, which is similar to that observed at the peak of the C cycle perturbation in phase B (fig. 2).
The molar ratio of FeHR:S is consistently below the 1:2 ratio of Fe:S in pyrite (fig. S3), which is the main removal mechanism for sulfate under anoxic marine conditions (Poulton & Canfield, 2011), indicating an overall excess of S over Fe. This occurs despite elevated Fepy/FeHR ratios, suggesting that the system was likely reactive iron-limited and hence the redox conditions were not controlled by highly elevated riverine Fe inputs (c.f. Scholz et al., 2019). This observation is supported by the high degree of OM sulfurization, where S is overwhelmingly in the form of Sorg, rather than as pyrite-S, with Sorg showing a similar profile to Corg (figs. 2 and S4). Rapid, particle-hosted sulfurization of OM under oxygen-depleted conditions has been considered to play a key role in enhancing the preservation of Corg during OAEs (Hülse et al., 2019; Raven et al., 2019) and in particular in the Tarfaya basin (Kolonic et al., 2005).
6.2. Water Column Redox Conditions
Despite the occasional occurrence of limited bioturbation, the redox proxy results show consistently elevated values, probably because bioturbation during short-term intervals of oxygenation would homogenise the sediment over the affected sample depths (2–6 cm), maintaining overall enrichments in FeHR and RSTE (Poulton, 2021). Elevated FeHR/FeT ratios (>0.38) and UEF* values (>5) are entirely consistent with near-persistent bottom water anoxia throughout the section (fig. 3). In support of this, a negative correlation is apparent between U and CaCO3 contents (R=0.73, fig. S5), indicating that U patterns are not controlled by incorporation into carbonate phases (Sturchio et al., 1998; Zhao et al., 2016), and instead likely represent authigenic enrichments due to persistent anoxia. Furthermore, FeT concentrations show high variability within the carbonate-rich layers (fig. 2 and fig. S6) and FeHR/FeT ratios show no systematic changes related to lithology (fig. 3), suggesting an independent control driven by water column anoxia.
Euxinic water column conditions of variable intensity are indicated by high Fepy/FeHR ratios and highly elevated, but variable, MoEF* values (fig. 3). However, it remains possible that the water column may have periodically fluctuated to ferruginous conditions, but with elevated Mo drawdown occurring due to the presence of sulfidic porewaters at the sediment-water interface (Goldberg et al., 2016; Poulton et al., 2015). The ultimate phase that sequestered Mo is unclear, but the high concentrations of Sorg (fig. 2), alongside the strong relationships between both Corg and Mo, and Sorg and Mo (fig. 4), suggest that sulfurized OM may have been a major host (Kolonic et al., 2002; Tribovillard et al., 2004). However, when considered in detail, it is apparent that the observed variability in MoEF* values is not solely due to changes in Corg, since there are clear intervals of decoupled behaviour, including, for example, between strongly euxinic intervals E2 and E3, when MoEF* values decrease as Corg increases (fig. 3). Thus, the variability in MoEF* values more likely reflects changes in the intensity of euxinia, which itself may at least partly reflect productivity levels and the intensity of Corg production in the water column, which would produce the overall correlation observed between Corg and Mo (fig. 4).
In total, 9 moderately to strongly euxinic intervals may be identified by relative variability in MoEF* values (fig. 3; note that the temporal extent of interval E9 is based on additional considerations discussed below). In the lower part of the section (below ~38.9 m), intervals E1-E5 have particularly high MoEF* values. However, while clear peaks in MoEF* values are apparent in this part of the section, peaks E1-E2 and E3-E5 appear to cluster across two broader intervals of generally more intense euxinia (fig. 3). It is interesting to note that these two broader intervals appear to repeat on a timescale that is similar to the clear cyclicity that occurs between euxinic and ferruginous conditions during phase A of OAE2 at Tarfaya (Poulton et al., 2015), although our data suggest fluctuations in the intensity of euxinia during the final stages of phase B, rather than clear transitions to ferruginous conditions.
Above ~39.0 m depth, a clear feature is a progressive decrease in MoEF* values from E6 to E9. Although Mo depletion has been suggested for phase A of OAE2, due to global drawdown of Mo under extensive euxinia (Eldrett et al., 2014; Goldberg et al., 2016; Hetzel et al., 2009; Ostrander et al., 2017; Owens et al., 2013), such a process seems unlikely to have become more prevalent during the recovery phase. The exception to this relates to the HW. Here, the global δ13Corg perturbation (fig. 2) likely indicates a return to more reducing conditions on a widespread scale, which is supported by evidence for more intense euxinia at Tarfaya based on both P systematics (see discussion below) and a clear spike in UEF* values (fig. 3). Thus, the relatively low MoEF* values apparent during the HW likely result from global Mo drawdown due to expanded global euxinia, which finds support in observations of Mo enrichments at the beginning of this event at other sites, which are then followed by Mo depletion (Hetzel et al., 2009; van Bentum et al., 2009; van Helmond et al., 2014). This is also consistent with a return to higher MoEF* values above the HW interval (fig. 3), where the δ13Corg profile documents the end of OAE2 on a global scale (fig. 1), suggesting that the higher MoEF* values likely reflect local euxinia and a replenishment of the global Mo reservoir under more pervasively oxygenated conditions.
Overall, the progressively diminished Mo enrichments apparent during the recovery phase appear to document gradually decreasing dissolved sulfide concentrations. Indeed, it is notable that the cyclical fluctuations become particularly pronounced as the recovery phase of the OAE proceeds (as indicated by the onset of a more rapid recovery in the δ13Corg profile at ~39 m; fig. 2), and we explore potential controls on these dynamic redox fluctuations below.
6.3. Phosphorus Cycling
Changes in PT concentrations and PT/Al ratios show no consistent relationship to the intensity of euxinia (fig. 7), but the PT profile is broadly similar to the Corg profile, which perhaps unsurprisingly suggests that Corg was the dominant phase that delivered P to the sediment, rather than drawdown in carbonate phases (see Poulton & Canfield, 2006). However, given that Corg contents are relatively high (fig. 5), the low Porg values apparent throughout the studied interval (fig. 6), which also occur during phases A and B at Tarfaya (Kraal et al., 2010), imply extensive preferential release of P from OM during early diagenesis (Ingall & Jahnke, 1997). This is supported by the exceptionally high molar Corg/Porg ratios that occur throughout the studied interval (fig. 5). In addition, however, the progressive decrease observed in Corg/Porg ratios (excluding the clear spike during the HW; fig. 5) is entirely consistent with the evidence from MoEF* values for an overall decrease in the intensity of sulfide production (fig. 3). Superimposed on this trend, there are slight peaks in Corg/Porg ratios during some of the intervals identified as being characterised by more intense euxinia (for example, E1-E2, E6, E7, and particularly E9), which is also consistent with a microbial sulfate reduction control on the preferential release of P from OM.

The occurrence of considerably lower molar Corg/Preac ratios relative to molar Corg/Porg ratios (fig. 5) clearly demonstrates sink switching of a large proportion of the P released from OM, with the P dominantly being fixed in the form of authigenic carbonate fluorapatite (fig. 6). However, throughout much of the section, the elevated Corg/Preac ratios relative to the Redfield Ratio demonstrate extensive recycling of a proportion of the released P back to the water column (fig. 5). In this relatively shallow water setting, this recycled P would have imposed a positive productivity feedback (Van Cappellen & Ingall, 1994), thus helping to maintain high levels of OM production and burial, as well as anoxic water column conditions.
There is, however, a suggestion of an overall progressive decrease (and more variability) in P recycling in the upper half of the section, including intervals where Corg/Preac ratios are close to the Redfield Ratio (fig. 5). Sedimentation rate may impact the extent of P recycling, and it is noticeable that the particularly low Corg/Preac ratios that occur from 38.37–37.87 m coincide with an interval of very high carbonate content, potentially reflecting more rapid sedimentation and hence more efficient trapping of P in the sediment. However, the progressive decrease in Corg/Preac ratios that occurs across the three intervals of particularly high carbonate deposition identified above, supports a general decrease in the intensity of P recycling through the recovery phase. This is again consistent with the proposed decrease in both the production of sulfide and the preferential release of P from OM. It is also noticeable that there are peaks in P within the upper carbonate-rich interval (indicated by elevated PT/Al ratios at ~38.27 m and ~38.09 m) that do not coincide with elevated Corg, suggesting particularly enhanced sequestration of P in the sediment (fig. 5). Thus, while P recycling was a pervasive feature throughout most of OAE2 (Beil et al., 2020; Kraal et al., 2010; Mort et al., 2007, 2008; Poulton et al., 2015), including during much of the recovery phase, the overall decrease in recycling towards the end of the recovery phase likely points to a driving mechanism for the termination of water column anoxia through decreased P availability.
The HW represents an interruption to this general trend, whereby Corg/Preac ratios increase substantially, despite continued deposition of sediments with a very high carbonate content (c.f. figs. 2 and 5). This is consistent with more intense P recycling back to the water column due to a return to more intense euxinia. This, in turn, likely resulted in the higher Corg contents of the HW interval (up to 3.8 wt%; fig. 5) relative to the background contents (1.1 ± 0.6 wt%) of the preceding carbonate-rich horizon.
6.4. Controls on Redox Cycling
Having established a strong redox control on P cycling, we next consider possible drivers of the observed redox changes, as well as reasons for the distinctive dynamics of the recovery phase relative to the end of phase B. Poulton et al. (2015) argued that the redox cyclicity observed during phase A of OAE2 was due to fluctuations in the relative weathering influxes of sulfate and reactive Fe, reflecting orbitally-driven perturbations to the hydrological cycle. In a setting such as Tarfaya, an alternative possibility relates to changes in the availability of dissolved sulfate due to extensive drawdown (as pyrite) under euxinic conditions. We investigate these possibilities via an integrated consideration of several pertinent aspects of the data.
The isotopic composition of Cretaceous seawater sulfate is considered to have been relatively heterogeneous (in the range of ~8–22‰), with values of 18–19‰ generally occurring towards the end of OAE2 (Adams et al., 2010; Owens et al., 2013; Paytan et al., 2004; Poulton et al., 2015). This gives fractionations between seawater sulfate and δ34Spy of 40–50‰ in the lower part of our section (below ~40 m), which are atypical of Mesozoic fractionations as a whole, and instead are similar to those commonly observed during the lower Paleozoic, when seawater sulfate concentrations are considered to have been lower than average Mesozoic concentrations (Algeo et al., 2015). These fractionations are, however, consistent with the suggestion of relatively low seawater sulfate concentrations (estimated to be in the range of <1 to ~7 mM) during OAE2 itself Adams et al., 2010; Gomes et al., 2016; Owens et al., 2013; Poulton et al., 2015). Such low background concentrations would potentially promote significant changes in seawater sulfate concentrations as a consequence of intense euxinia, and hence ultimate drawdown of sulfate (via sulfide) as pyrite.
Changes in sulfate availability would also have had an impact on the δ34S signature of sulfurized OM. However, while δ34Spy fluctuations are observed throughout OAE2 in Tarfaya, the δ34S composition of Sorg remains relatively stable (Raven et al., 2019), suggesting that changes in seawater sulfate concentrations were unlikely to have been the dominant driver for the observed isotopic shifts in δ34Spy. However, in addition to being influenced by sulfate availability in the water column, δ34Spy fractionations may also be controlled by sedimentation rate (which affects the extent of pyrite formation under closed system conditions during diagenesis) and Corg loading (for example, W. Chen et al., 2022; Liu et al., 2021; Pasquier et al., 2017; Pasquier, Bryant, et al., 2021; Pasquier, Fike, et al., 2021). Thus, we consider these possibilities in terms of the δ34Spy record through the studied interval.
In the lower half of the section (up to a depth of ~40 m), the δ34Spy record shows no distinct trend in relation to the suggested redox variability (which is similar to phase A at Tarfaya; Poulton et al., 2015), but there is an overall increase in δ34Spy values up-section (fig. 7). It is difficult to conclusively resolve the underlying reason for this increase, but a slight increase in sedimentation rate has been proposed between the end of phase B and the beginning of phase C (Kolonic et al., 2005). While the low resolution of the sedimentation rate reconstruction precludes a direct comparison with the δ34Spy profile, if the suggested higher sedimentation rate was progressive, it may have contributed to the overall increase in δ34Spy by increasingly focusing the locus of pyrite formation deeper in the sediments (Liu et al., 2021; Pasquier, Bryant, et al., 2021; Pasquier et al., 2017; Pasquier, Fike, et al., 2021). In this scenario, increased sedimentation rates would have limited the diffusion of sulfate into the sediment, thereby increasing δ34Spy compositions. By contrast, there is no evidence for consistent changes in Corg export, either when reported in terms of bulk contents (fig. 2) or on a carbonate-free basis (fig. 7). Together with the persistently high Corg contents, this suggests that changes in Corg availability did not drive the observed trend in δ34Spy below ~40 m depth.
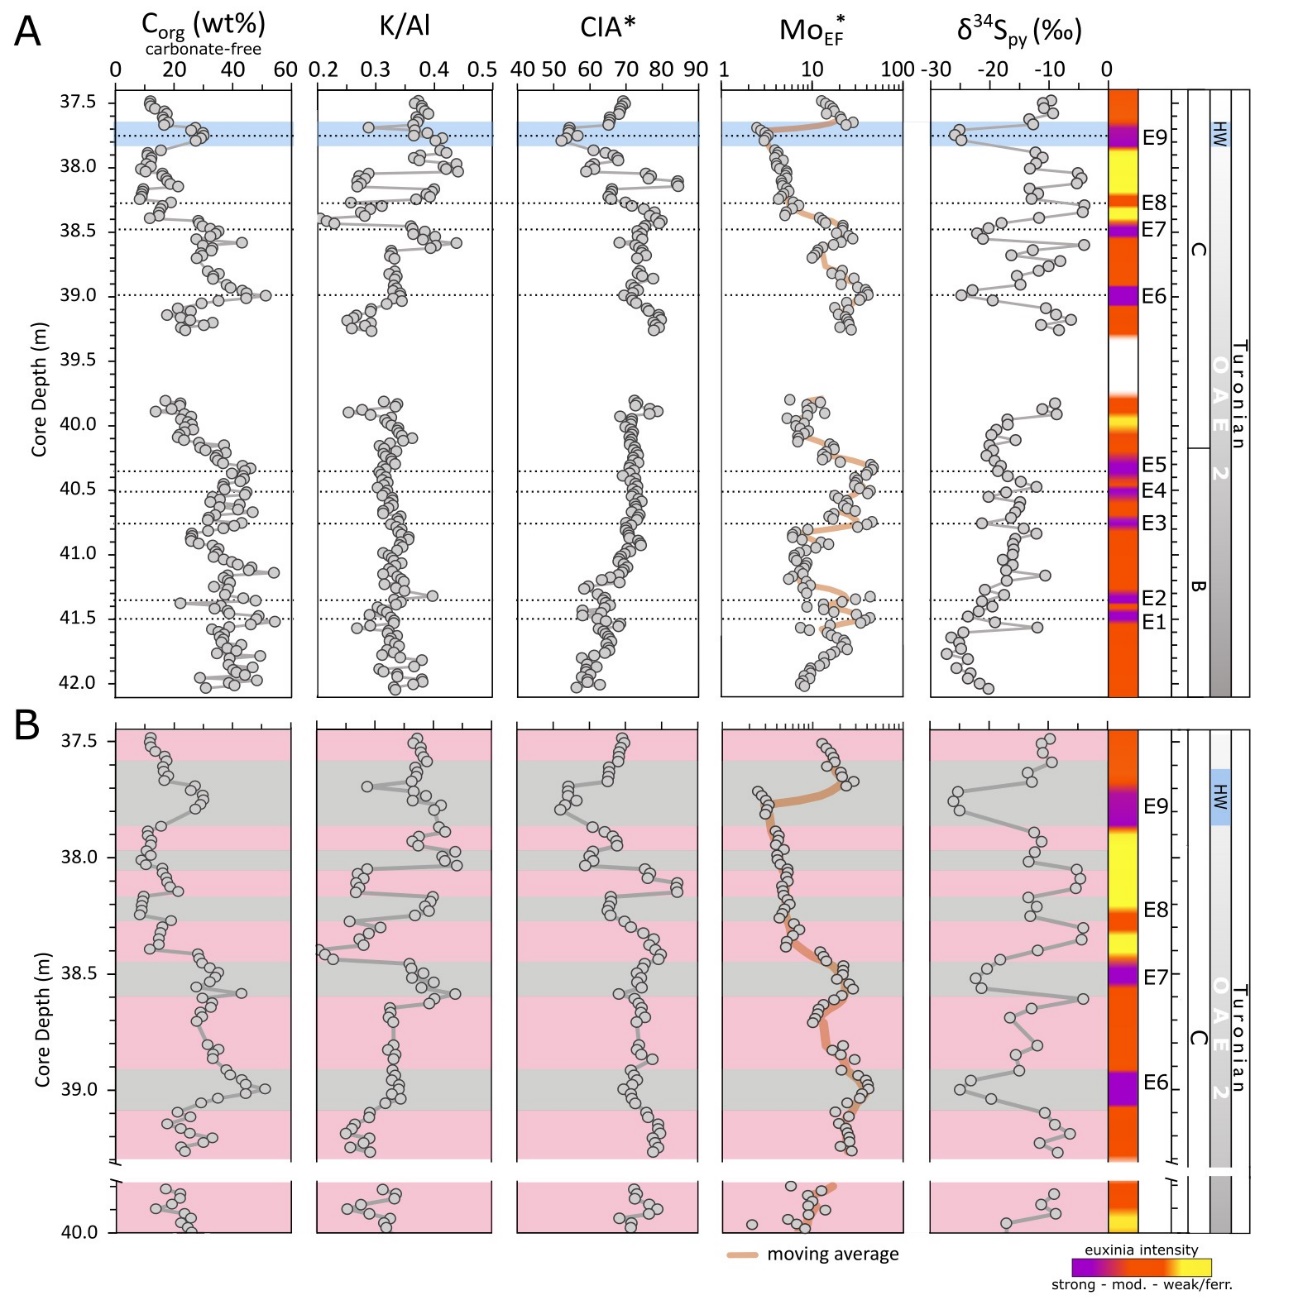
Above a depth of ~40 m there is a change in the nature of the δ34Spy signal, with clear cyclicity between higher and lower values (fig. 7). Again, these cycles show no consistency with Corg contents (figs. 2 and 7), and we also note that there is no evidence for linked changes in sedimentation rate that could otherwise drive changes in δ34Spy. Indeed, fluctuations in the extent of carbonate deposition, which may reflect changes in sedimentation rate, are entirely independent of the observed cyclicity in δ34Spy (figs. 2 and 7). However, other parameters do show broadly consistent behaviour (fig. 7B), although the degree of consistency shows some variability. Above a depth of ~40 m, higher δ34Spy values commonly coincide with intervals of lower MoEF* values (i.e., less intense euxinia) and vice versa (noting the discussion above about decreased MoEF* values through interval E9) (fig. 7B). This observation is inconsistent with a water column sulfate concentration control on the redox cyclicity. If this were the case, intervals of intense euxinia should have promoted decreased sulfate availability and hence higher δ34Spy compositions, which is opposite to the observed trends. As an alternative, integrated explanation for the observed changes in redox conditions and δ34Spy systematics through the section, we thus consider potential weathering controls using CIA* and K/Al ratios.
Similar to the δ34Spy profile, CIA* values show a slight overall increase up to a depth of ~40 m, with no distinct relationship to the observed redox variability (fig. 7A). Similarly, K/Al ratios show no relationship to the redox variability (fig. 7A). These weathering proxy profiles thus suggest a slight increase in the intensity of chemical weathering towards the end of phase B, which is consistent with peak temperatures occurring at the C/T boundary (Hasegawa et al., 2012; Lunt et al., 2016; O’Brien et al., 2017). Overall, the weathering signal is muted in the lower part of the section. A similar muted continental weathering signal has been reported for OAE2 in the WIS (Nana Yobo et al., 2021). Here, both Sr and Os isotopes show a typical hydrothermal signature at the beginning of OAE2 related to increased volcanic activity, while an effect of continental weathering on the Sr influx is not apparent. However, due to the proximity of the WIS to the Caribbean LIP emplacement, changes in continental input may have been masked by the increased volcanic Sr supply. During the course of OAE2, the Sr weathering signal becomes more prominent, likely due to waning volcanism (see below).
As phase C progresses, there are much clearer relationships between δ34Spy, the intensity of euxinia, and chemical weathering intensity, with variability in the weathering proxies becoming increasingly pronounced (fig. 7B). Our data demonstrate that the intervals of more intense euxinia and lower δ34Spy generally correspond to intervals of decreased weathering intensity (i.e., higher K/Al ratios and lower CIA* values). Higher rates of chemical weathering tend to increase the oceanic influxes of both sulfate and FeHR, as a result of increased pyrite weathering (Poulton & Canfield, 2011). However, the influx of FeHR is increased relative to sulfate, because in addition to being sourced from the oxidation of pyrite, more intense chemical weathering converts more silicate Fe to FeHR (Canfield, 1997; Poulton & Raiswell, 2002). Thus, more intense weathering results in a higher FeHR:sulfate ratio.
The modern ocean is poised at a molar FeHR:sulfate ratio of 1:1.8, which is close to the stoichiometric 1:2 ratio of FeHR and sulfide in pyrite (Poulton & Canfield, 2011). Since the dominant initial removal mechanism for FeHR and sulfate on a global scale is generally in the form of pyrite in anoxic settings, a riverine input with a higher FeHR:sulfate ratio would promote lower sulfide availability in the water column due to more intense scavenging by FeHR (Poulton et al., 2015). Indeed, the Tarfaya region would have been particularly prone to changes in sulfide availability through the additional intensive drawdown of sulfide in association with OM (i.e., as Sorg; fig. 2). Overall, more intense chemical weathering would have resulted in less intense water column euxinia, or even the development of ferruginous conditions (Poulton & Canfield, 2011), as evident during phase A at Tarfaya (Poulton et al., 2015). The higher availability of FeHR would also have shifted the dominant locus of pyrite formation to deeper in the sediments, where under closed system conditions (with respect to sulfate diffusion into the sediment porewaters), increased δ34Spy compositions would have been generated, as observed in the record at Tarfaya (fig. 7).
Conversely, lower intensity chemical weathering would have resulted in relatively more intense euxinia as less sulfide would have been scavenged by FeHR in the water column. Furthermore, since rates of sulfidation of FeHR depend on ambient sulfide concentrations (Canfield et al., 1992; Poulton et al., 2004), higher sulfide concentrations in the water column would have led to proportionately more FeHR being sulfidized, either directly in the water column or during very early diagenesis when porewaters were still open to diffusion of sulfate from the water column (Meyers, 2007; Poulton et al., 2015). This more open system δ34Spy scenario would have resulted in the observed lighter δ34Spy compositions relative to intervals of more intense chemical weathering and lower sulfide concentrations (fig. 7).
In summary, and consistent with recent studies of pyrite-S isotope systematics (for example, Bryant et al., 2020; Liu et al., 2021; Pasquier, Bryant, et al., 2021; Pasquier et al., 2017; Raven et al., 2019), our δ34Spy data do not simply reflect changes in water column sulfate availability, but rather reflect a balance between the relative significance of “early” (water column/shallow sediment) versus “late” (deeper in the sediment) pyrite formation. However, rather than being driven by changes in sedimentation rate or Corg loading, our data suggest that under anoxic conditions, the intensity of water column euxinia (which was influenced by the relative availability of FeHR) likely exerted a major control on the observed shifts in δ34Spy. Furthermore, while a variety of factors may have contributed (see fig. 8), changes in the intensity of chemical weathering appear to have exerted a dominant control on the observed redox variability by altering the FeHR:sulfate ratio in the basin (and hence the extent of P recycling). In the upper part of the section, the redox variability was likely driven by orbital-timescale changes in the hydrological cycle (Wagner et al., 2013), as previously suggested for phase A at Tarfaya (Poulton et al., 2015). In the lower part of the section, the progressive increase in δ34Spy also appears to have been affected by a slight increase in chemical weathering intensity as phase B came to an end, although a potential increase in sedimentation rate may also have contributed.

An additional interesting feature of the data concerns the muted response of weathering parameters and δ34Spy values to orbital forcing during the end of the OAE2 phase B, relative to the phase A and phase C. We suggest that this may be due to the relative significance of orbital changes in the hydrological cycle and chemical weathering at times of peak temperatures, compared to the onset and termination of such climatic perturbations. As mentioned above, peak temperatures are considered to have occurred around the C/T boundary (i.e., at the end of the phase B; Hasegawa et al., 2012; Lunt et al., 2016; O’Brien et al., 2017), and indeed, OAE2 is considered to represent one of the warmest intervals of the Phanerozoic (Jenkyns, 2010). Particularly high temperatures at high latitudes would have resulted in a low temperature gradient between the poles and the equator (Barron, 1983). We thus speculate that at these extreme temperatures, the effects of orbital forcing on the hydrological cycle and hence weathering intensity would have been more muted. Indeed, a nonlinear response of both the sedimentary record and the hydrological cycle to orbital forcing, in particular at low latitudes, has been shown in climate modeling (Park & Oglesby, 1991). Nevertheless, despite the muted response evident at Tarfaya, orbital forcing does appear to have had a more subtle influence on the intensity of euxinia during the end of phase B, as indicated by the two clusters (for example, E1-E2 and E3-E5) of more intense euxinia (fig. 3).
6.5. Controls on the Termination of OAE2
The general driver behind the termination of OAE2 is considered to have been a return to cooler temperatures and a less active hydrological cycle as a result of CO2 sequestration through both silicate weathering and the burial of OM (Arthur et al., 1988; Hülse et al., 2019; Kuypers et al., 1999), which is supported by various weathering proxies (Pogge von Strandmann et al., 2013). Ultimately, this would have exerted a negative feedback on chemical weathering and the oceanic influx of nutrients, thus impacting global rates of productivity and carbon production, and hence water column oxygen depletion (Pogge von Strandmann et al., 2013). Tracers for weathering intensity such as Li isotopes, Sr isotopes and Hf isotopes, reported for the Tethys (Frijia & Parente, 2008; Pogge von Strandmann et al., 2013) and at high-latitudes in both the proto-Indian Ocean (H. Chen et al., 2023; Jones et al., 2023) and the Pacific Ocean (Takashima et al., 2024), show a 1.8- to 3.0-fold increase in chemical weathering (Jones et al., 2023; Nana Yobo et al., 2021; Pogge von Strandmann et al., 2013) coincident with the onset of OAE2. While the timing and intensity of the weathering perturbation does not seem to be uniform (Blättler et al., 2011; Pogge von Strandmann et al., 2013), weathering proxies across all locations report a decrease in weathering intensity towards the end of the CIE recovery phase (Blättler et al., 2011; H. Chen et al., 2023; Jones et al., 2023; Pogge von Strandmann et al., 2013; Takashima et al., 2024).
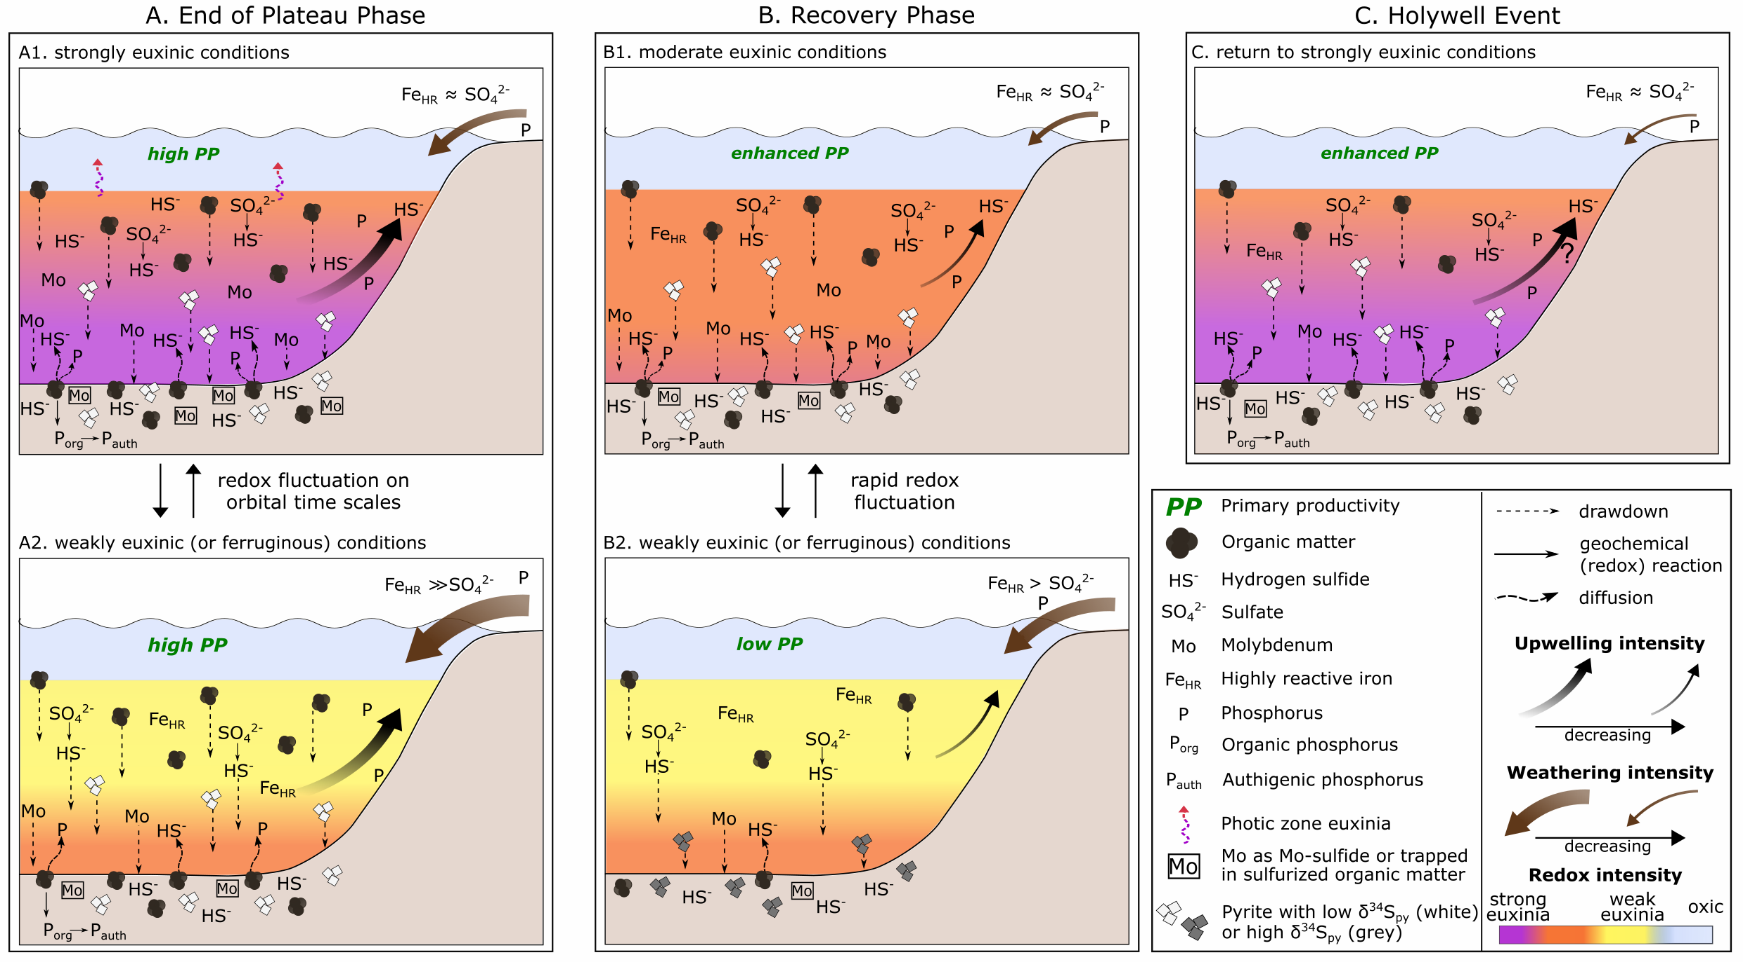
These observations are consistent with our findings. An overall decrease in chemical weathering intensity through phase C is supported by our CIA* and K/Al profiles, where, despite the evident cyclicity, background CIA* values progressively decrease, and K/Al ratios progressively increase (fig. 7). While this would have impacted the weathering supply of nutrients to the basin (fig. 8A and B), we also note that Tarfaya was located within the outer limb of the Hadley Cell, where trade wind intensities are closely linked to latitudinal variations in the position of the Intertropical Convergence Zone (ITCZ; Wagner et al., 2013). It has been proposed that an interplay between trade wind induced upwelling and the collapse of the upwelling cell occurred during the termination of OAE2 (Kolonic et al., 2005; Prauss, 2012). Thus, although anoxia was maintained at Tarfaya, at least during phase C of OAE2 (fig. 3), the total supply of nutrients to the Tarfaya basin may have been significantly reduced as a consequence of both decreased chemical weathering influxes and decreased upwelling (fig. 8B).
In addition, model simulations have shown that rapid sulfurization of OM results in enhanced Corg preservation in sediments (Hülse et al., 2019), which would draw down CO2 and lower rates of oxygen consumption in the water column. As discussed above, sulfurization of OM would help to remove dissolved sulfide from the water column. Thus, the combined effects of OM sulfurization would help the recovery from strongly euxinic conditions (Hülse et al., 2019). However, while decreased nutrient fluxes and sulfurization of OM likely set the stage for the recovery from extreme redox conditions, our high-resolution data provide nuanced insight into the dynamics and precise nature of the processes that allowed the ocean to recover from the global OAE2 perturbation (fig. 8).
During the recovery period (fig. 8B), euxinia became progressively less intense (with the exception of the HW), which was likely initiated by the proposed decrease in the supply of nutrients. In addition, stronger fluctuations between weak and more intense euxinia are apparent, relative to the phase B (fig. 8A), and these fluctuations became more frequent during phase C (fig. 7). This resulted in a progressive decrease in P remobilisation from OM during diagenesis, as indicated by decreased Corg/Porg ratios, as well as intervals of greatly reduced P recycling back to the water column, as indicated by low Corg/Preac ratios (fig. 5). Indeed, there are intervals where Corg/Preac ratios sit close to, or below, the Redfield Ratio (fig. 5). In a persistently anoxic setting such as Tarfaya, Corg/Preac ratios below the Redfield Ratio suggest additional drawdown of P in association with Fe (oxyhydr)oxide minerals that escaped sulfidation in the euxinic water column (for example, Alcott et al., 2022; Bowyer et al., 2020; Guilbaud et al., 2020), with sink switching of PFe to Pauth during the reductive dissolution of Fe (oxyhydr)oxides during diagenesis. This process would have actively created a negative productivity feedback, further aiding the recovery from intensely reducing conditions.
Although similar detailed studies of other shelf, and particularly deeper water, settings are required, our data suggest that decreased recycling of P from shelf environments, coupled with waning nutrient influxes from continental weathering, likely drove the recovery from global anoxia. This recovery persisted over a protracted period during which orbitally-driven changes in the intensity of euxinia impacted the efficiency of P sequestration in the sediments. This is particularly apparent during the HW (fig. 8C), when the ocean appears to have returned to a more reduced state on a global scale, as indicated by the global δ13Corg excursion. At Tarfaya, the HW is characterized by a particularly low chemical weathering input (fig. 7B), which we suggest initiated a biogeochemical cascade, starting with a reduced input of FeHR relative to sulfate and leading to more intense water column euxinia (fig. 5). This subsequently promoted efficient P recycling back to the water column (fig. 8C), driving enhanced primary productivity not only on the Tarfaya shelf, but also probably in the global ocean (likely with differing degrees of impact in different regions), as indicated by the global, but variable (in terms of magnitude) nature of the HW δ13Corg excursion.
It is also interesting to note that a global short-term perturbation is observed shortly after the initiation of OAE2, where a sharp overall increase in δ13Corg is interrupted by the Plenus Cold Event (PCE; Forster et al., 2007; Gale & Christensen, 1996; Jefferies, 1962), represented by a negative isotopic shift of 1–2‰ that divides the onset of the CIE into two phases (fig. 1D). Intermittent cooling during the PCE (Lamolda et al., 1994; Sinninghe Damsté et al., 2010) has been interpreted to be a direct consequence of extensive removal of atmospheric CO2 (Jarvis et al., 2011; Kuypers et al., 1999). While the PCE is represented globally in the geological record, concomitant cooling during the PCE is not consistent in timing and expression (O’Connor et al., 2020). For the HW, global temperature reconstructions suggest relatively warm, stable sea surface temperatures lasting until the mid-Turonian, with no particular changes during the HW itself, although the resolution of these studies may have been insufficient to document such a short-lived change (Forster et al., 2007; Robinson et al., 2019). Similar to the PCE, the HW does not seem to show consistency on a global scale. Nevertheless, both the HW and the PCE document environmental instability as the Earth system transitioned from one climate state to another, and hence it is intriguing to consider that such instability may be a common feature during the transition stages of major climate-induced perturbations.
7. CONCLUSIONS
Our high-resolution geochemical study of the mid-Cretaceous, high-productivity Tarfaya shelf documents persistent anoxia, with fluctuations in the intensity of euxinia, from the end of phase B of OAE2 and through phase C. Towards the end of phase B, intervals of intense euxinia repeat on a timescale similar to the redox cyclicity that is apparent during phase A of OAE2. However, during the recovery period, fluctuations in the intensity of euxinia became more pronounced and more rapid. In addition, the intensity of euxinia progressively decreased during phase C, with the exception of a return to particularly intense euxinia during the global Holywell Event.
Consideration of chemical weathering proxies (CIA*, K/Al) suggests a relatively muted response to orbital forcing of the hydrological cycle towards the end of phase B, although this may still have driven the observed, relatively subtle changes in the intensity of euxinia. During phase C, intervals of enhanced chemical weathering clearly coincide with less intense euxinia. Consistent with phase A at Tarfaya (Poulton et al., 2015), we suggest that this reflects an enhanced influx of FeHR relative to sulfate from land, due to the increased transfer of unreactive silicate Fe to FeHR as weathering intensity increased. A greater availability of FeHR ultimately promoted less intense euxinia and also resulted in proportionately more FeHR being sulfidized during diagenesis, which promoted the observed increases in δ34Spy.
In general, the prevalence of euxinia led to a high degree of preferential P release during OM remineralization and also extensive P recycling back to the water column, which would have promoted a positive productivity feedback. This helped to maintain exceptionally high levels of OM production at Tarfaya and also may have provided a source of P to maintain widespread ocean anoxia. However, the extent of P recycling progressively diminished as the intensity of euxinia decreased, with intervals of enhanced P drawdown being apparent during phase C. In combination with waning P inputs from chemical weathering, and possibly also a decline in the intensity of P supplied via upwelling, this helped to drive the system to recovery from the C/T boundary carbon cycle perturbation. However, the clear cyclicity apparent in local redox conditions during phase C suggests a high degree of instability, driven by orbital forcing, as the system transitioned from the OAE into a more stable climate state. Global instability during this interval is particularly highlighted by the Holywell Event, where a positive δ13Corg excursion of up to ~2.5‰ interrupts the gradual recovery from the CIE. This short episode of strongly reducing conditions was, perhaps paradoxically, initiated by decreased chemical weathering, which drove the water column to more intense euxinia. Under these conditions, increased P recycling transiently returned, and thus primary productivity was promoted on the shallow Tarfaya shelf, and probably also on a global scale.
In modern oceans, the impact of climate change is visible in the expansion of oxygen minimum zones (Breitburg et al., 2018; Grégoire et al., 2021; Schmidtko et al., 2017). Studies of intervals of past ocean deoxygenation, such as OAE2, clearly show that biogeochemical feedbacks linked to climate change can result in changes in the availability of dissolved sulfide. Linked to this, changes in sulfide availability above a tipping point may lead to extensive recycling of P, thus driving more intense local and global anoxia. In this context, more research is required to identify the precise tipping point(s) and parameters that may drive the ocean system to an extreme reducing condition.
Acknowledgments
This work was supported by Leeds-York-Hull Natural Environment Research Council (NERC) Doctoral Training Partnership (DTP) Panorama grant NE/S007458/1 to CK. SWP and RJN acknowledge support from NERC grant (NE/N018559/1). We thank two anonymous reviewers and the Associate Editor for very helpful comments that significantly improved the final manuscript.
Author contributions
SWP and TW designed the research. Samples were provided by TW. CK performed geochemical analyses. CK and SWP interpreted the data and wrote the manuscript. All authors were involved in the discussion of the project and contributed to revising the manuscript.
Competing Interests
The authors declare no conflict of interests.
Data availability
All the data are available as an electronic supplement.
Supplementary Information: https://doi.org/10.17632/cnjj8smxr3.1
Excel Data: https://doi.org/10.17632/8zdxdbscnf.1
Editor: C. Page Chamberlain, Associate Editor: Kimberly Lau